ORIGINAL RESEARCH
Diffusion-Weighted Imaging of Hyperacute
Cerebral Hypoglycemia
P. Schmidt J. Bo¨ttcher A. Ragoschke-Schumm H.J. Mentzel G. Wolf U.A. Mu¨ller W.A. Kaiser T.E. Mayer A. Saemann
BACKGROUND AND PURPOSE: Cerebral hypoglycemia can result in reversible metabolic brain insults and can be associated with impaired diffusion disturbances. Our aim was to evaluate possible changes in DWI of the human brain during hyperacute short-term severe hypoglycemia.
MATERIALS AND METHODS: Ten individuals scheduled for a clinical IST were examined with DWI while the test was performed. Venous blood glucose was continuously measured, and sequential DWI sequences were performed without interruption. Hypoglycemia was terminated with intravenous glucose administration when glucose levels were atⱕ2.0 mmol/L.
RESULTS: Blood glucose levels were lowered to a mean nadir of 1.75⫾0.38 mmol/L. No alterations of cerebral diffusion could be observed in any individuals on DWI.
CONCLUSIONS:Hyperacute short-term severe hypoglycemia does not induce visible changes in DWI of the human brain.
ABBREVIATIONS:A⫽agitation; ADC⫽apparent diffusion coefficient; BS⫽blurred speech; D⫽ drowsiness; DA ⫽ dysaesthesia; DP ⫽ dyspnea; DWI ⫽ diffusion-weighted imaging; EEG ⫽ electroencephalography; FC ⫽ feeling cold; FG ⫽ fatigue; FLAIR ⫽ fluid-attenuated inversion recovery; H⫽hunger; IST⫽insulin stress test; IV⫽impaired vision; LC⫽loss of consciousness; LMC⫽loss of mental concentration; N⫽nausea; n.a.⫽not applicable; S⫽sweating; T⫽tremor; TH⫽thirst; V⫽vertigo
T
he effect of hypoglycemia on the brain is well known, caus-ing a wide range of vegetative and neurologic symptoms, such as alterations of mental status, seizures, paresis, coma, and death.Hypoglycemia is seen in the context of numerous meta-bolic and medical diseases like neoplastic overproduction of endogenous insulin, a major illness like sepsis, Addison dis-ease, or renal failure. However, severe hypoglycemia is seen most commonly in individuals with insulin- or sulfonylurea-treated diabetes mellitus. Hypoglycemia is also of importance in forensic medicine in cases of homicide or suicide attempts. In type 1 diabetes, severe hypoglycemia is a frequent ther-apeutic side effect with approximately 2 episodes of mild hy-poglycemia per week and an episode of severe, at least tempo-rarily disabling, hypoglycemia approximately once a year. Epidemiologic data indicate that up to 4% of deaths in type 1 diabetes are associated with severe hypoglycemia.1Some of these patients develop reduced sympathoadrenal responses causing “hypoglycemia unawareness,” which describes the state in which autonomic warning symptoms do not occur or are not recognized before neuroglycopenia develops.2 There-fore these patient are known to have a higher risk of having seizures or coma or requiring another person’s assistance to recover from hypoglycemia.3
The rates of severe hypoglycemia in type 2 diabetes are
approximately 10% of those in type 1 diabetes.4In the U.K. Prospective Diabetes Study, the 6-year incidence of overall hypoglycemia in type 2 diabetes was 2.4% in participants with metformin therapy, 3.3% in the sulfonylurea-treated group, and 11.2% in the insulin therapy group, respectively.5In a large survey in Germany, severe hypoglycemic events, treated by glucagon injection or glucose injection intravenously for example, were 6 episodes per 100 patients per year on the primary care level and 0.31 episodes per 100 patients per year in hospital populations.6Severe hypoglycemic events in pa-tients with type 2 diabetes on insulin therapy were 0.01 per 100 patients per year in Germany.
Despite the potentially fatal outcome of hypoglycemia, neuroimaging of this condition is not well-studied, with only a few reported cases.7-19An overview is given in Table 1. A view of these cases reveals a possible association between re-versible DWI lesions and elderly patients with diabetes, but, to our knowledge, a systematic investigation is still lacking. DWI of patients with acute hypoglycemia has shown high-intensity signals in numerous different locations of the brain like the internal capsules,7,8,11,14,15hippocampus,12,16basal ganglia,12 pons,17splenium of the corpus callosum,9,13,15corona radi-ata,8,9 and cortex of the frontal or parietal or occipital lobe.8,10,12,15,16,18,19 After correction of hypoglycemia, the high-intensity signals are reported to disappear within 2 hours20and within 10 minutes in rats.21Although the cortex, basal ganglia, and hippocampus seem to be the brain tissues most vulnerable to hypoglycemia,22the underlying mecha-nism of the distribution pattern of the high-intensity signals remains unclear. Asymmetry of the lesions might be explained by the asynchronous onset of electrocerebral silence between the hemispheres.22
Although with signal-intensity augmentation, cerebral hy-poglycemia and cerebral ischemia exhibit similar findings in
Received September 16, 2010; accepted after revision November 8.
From the Institute of Diagnostic and Interventional Radiology (P.S., J.B., A.R.-S., H.J.M., W.A.K., T.E.M.) and Department of Internal Medicine III (G.W., U.A.M., A.S.), University Hospital, Friedrich-Schiller-University Jena, Jena, Germany.
This work was supported by Sunlight Medical Ltd in the form of a grant of Omnisense, a quantitative ultrasound machine.
Please address correspondence to Peter Schmidt, MD, Neuroradiology, Institute of Diag-nostic and Interventional Radiology, University Hospital of the Friedrich Schiller University Jena, Erlanger Allee 101, D-07740 Jena, Germany; e-mail: peter.schmidt@med.uni-jena.de
DOI 10.3174/ajnr.A2464
BRAIN
ORIGINAL
DWI, the underlying processes on a cellular basis are pro-foundly different in respect to their pathogenesis, indicating various therapeutic regimens used to protect cerebral integrity.
The purpose of this study was to evaluate the effect of short-term severe hypoglycemia on DWI of the brain in neu-rologically healthy individuals. Therefore, we formulated a hy-pothesis that severe hyperacute hypoglycemia of the brain in-duced by insulin administered within a standard clinical test may alter diffusion conditions at the cellular level and thus become visible on DWIs as signal-intensity increase or changes of ADC values.
Materials and Methods
Participants
Participants for this study were recruited in the Unit for Endocrinol-ogy and Metabolic Disorders of the Department of Internal Medicine III of the University Hospital, Jena, Germany, where all participants had been scheduled for a diagnostic IST. The highly standardized IST is widely used as a potent provocative test for assessing growth hor-mone and adrenocorticotropic horhor-mone reserve in adults by means of an induced hypoglycemia. The IST, when performed by experi-enced medical staff, is a safe, effective, and reliable procedure.23In
some centers, the IST is performed by endocrine specialist nurses24;
in our clinic however, the test is always performed by experienced physicians. The only change to the standard clinical routine IST pro-cedure was the alteration of the environmental setting: The partici-pants were asked days in advance whether they would agree to have the test performed in an MR imaging scanner instead of the standard examination room to obtain brain diffusion images during the IST.
After approval of the institutional ethics committee of the
Friedrich-Schiller-University was granted, 10 participants (Table 2) were included (5 women, 5 men; median age, 41.5 years; range, 23– 62 years). The group consisted of 3 patients with diabetes mellitus type I who had a history of several severe hypoglycemic episodes; these pa-tients were scheduled for the IST to rule out/confirm the possibly dangerous diagnosis of hypoglycemia unawareness. Three patients included in the study had a known history of abnormal adrenal cortex function (adrenal insufficiency); they were scheduled for the IST to evaluate the extent of the adrenal insufficiency. Four more patients included in the study were scheduled for the IST to rule out any abnormal pituitary or adrenal cortex function, but they finally were found to be in good health with normal IST findings.
Exclusion criteria were the following: 1) history of neurologic, neurosurgical, or psychiatric disorders; 2) acute diseases; 3) multi-morbidity; 4) MR imaging contraindications; 5) age younger than 18 years or older than 65 years; and 6) pregnancy. Written consent for participation in the study was obtained from each individual.
Experimental Design
[image:2.594.58.531.66.354.2]Experimental sessions were started at 7:00AM. The IST was performed by a consultant in internal medicine. After an overnight fast, the par-ticipants were placed in the MR imaging scanner. An indwelling can-nula for infusion of regular human insulin and glucose was placed in a superficial vein of the dorsum of 1 hand and a second cannula for collection of blood glucose samples, on the contralateral side. On-site testing of venous blood glucose was performed every 5 minutes to monitor hypoglycemia by using a quality-controlled glucometer (OneTouch; LifeScan, Milpitas, California). Venous blood samples were collected every 5 minutes in containers with fluoride to prevent glucose metabolism. Blood glucose was measured in these samples within 3 hours after collection with a quality-controlled laboratory Table 1: Reported location of hypoglycemic lesions based on DWI imaging of the cerebrum
Authors
Patient (Age 关yr兴, Sex)
Blood Glucose
(mmol/L) Symptoms
Hyperintense Lesion Localization on DWI
Reported Time between Onset of
Hypoglycemic Symptoms and Initial
DWI (hr)
Albayram et al7 68, F 1.77 Hemiparesis, slurred speech Internal capsules 1
Maekawa et al16 62, M 2.0 Comatose Cortical occipital lobe, hippocampus 18
Lo et al15 65, M 2.11 Seizures Diffuse cortical lesions 120
69, M 1.9 Speech difficulty, weakness Corona radiata, internal capsules, splenium of the corpus callosum
0.75 Kim et al14 78, F 2.10 Dysarthric, less responsive Splenium of the corpus callosum, internal
capsules
2 Yanagawa et al18 20, F 3.69 Cortical and subcortical (sparing motor,
sensory, and visual centers)
120 Kim et al13 78, F 2.1 Somnolent Splenium of the corpus callosum, internal
capsules
2 41, M 1.16 Drowsy Splenium of the corpus callosum 2 42, M 0.16 Comatose Splenium of the corpus callosum 3 Yoneda and Yamamoto19 37, M n.a. Deeply comatose Periventricular white matter 24
Cortical frontal lobe and insula 504 Cordonnier et al11 24, F 2.2 Hemiparesis Internal capsula 2
Shirayama et al17 58, M 0.9 Deeply comatose Pons 3
Bo¨ttcher et al9 77, M 1.71 Hemiparesis, somnolent Corona radiata, splenium of the corpus
callosum
1 Aoki et al8 73, F 1.1 Unresponsive Bilateral internal capsules, corona radiata,
cortical frontal and parietal lobes
On admission Chan et al10 53, M 1.1 Seizures, diaphoresis Cortical, temporal, and occipital lobes 24
Finelli12 53, M 1.27 Unresponsive Basal ganglia, hippocampus, cortical
temporal lobe
method (Architect c8000; Abbott Laboratories, Abbott Park, Illinois). For induction of hypoglycemia, a single intravenous bolus of regular human insulin was given (Actrapid, Novo Nordisk, Bagsværd, Den-mark; 0.15 IU per kilogram of body weight). Hypoglycemia was ter-minated with an intravenous bolus of 30 mL of glucose 40% as soon as the blood glucose level was atⱕ2.0 mmol/L or the subject wished to abandon the trial due to vegetative symptoms. The subjects were con-tinuously monitored by the consultant who was present in the scan-ner room while a neuroradiologist was constantly evaluating the ob-tained MR images.
MR Imaging
MR imaging was performed on a 1.5T whole-body MR imaging scan-ner (Magnetom Sonata; Siemens, Erlangen, Germany) equipped with echo-planar-imaging data capability designed to obtain rapid diffu-sion images. The study protocol included a DWI sequence (acquisi-tion time, 114 seconds; TR, 4500 ms; TE, 107 ms; 25 sec(acquisi-tions; sec(acquisi-tion
thickness, 5.0 mm; matrix, 128⫻128). The DWI sequence was ac-quired with 2 different b-values (b⫽0 s/mm2andb⫽1000 s/mm2). The diffusion gradients were applied in the x-, y-, and z-directions, and the acquired images were combined to form a single composite DWI (trace-weighted image). The ADCs were calculated for each pixel and composed in an ADC map. The ADC values were measured on the ADC map, which was calculated on the basis of b-values of 0, 500, and 1000 s/mm2. These ADC maps were calculated by using
algorithms implemented within the Magnetom scanner software (Syngo, Siemens). The regions of interest were set as the circle with an area of 0.68 cm2. They were manually set for the bilateral thalamus
and splenium according to Fig 1. We analyzed the last ADC map calculated in the normoglycemic state before insulin administration and the last ADC map calculated in hypoglycemic state before starting glucose infusion, which terminated the IST. Statistical analysis was performed with the Studentttest for the comparison between the ADC values of normoglycemic and hypoglycemic states.
Fig 1.Example of region-of-interest setting on ADC maps. The circular region of interest of 0.68 cm2
[image:3.594.52.535.65.225.2]was set for the bilateral thalamus and splenium. ADC values were calculated before (left image) and after (right image) insulin was administered.
Table 2: Subject data showing the duration of hypoglycemia, minimal blood glucose level, clinical symptoms, and visible DWI lesions
Patient Age
(yr) Sex
Duration of Hypoglycemia MinimalPlasma
Glucose Level (mmol/L)
Hypoglycemic Symptoms
Visible DWI Alterations at Minimum Glucose
Level (ⱕ4 mmol/
L) (min)
(ⱕ3 mmol/ L) (min)
(ⱕ2.5 mmol/ L) (min)
(ⱕ2 mmol/
L) (min) Autonomic
Neuroglyco-penic
1 23 F 40 25 20 20 1.3 S, H, T D, LMC, FG, LC None
2 33 M 50 35 25 10 1.6 S, H, A FG None
3 41 M 45 15 10 10 1.8 T, N, A D, LMC, IV None 4 42 F 20 10 5 None 2.4 S, T, N, DP DA, BS None
5 50 F 40 40 15 None 2.3 S, H D None
6 31 F 45 30 25 15 1.3 S D, FG, V, LMC None
7 24 F 40 40 20 5 1.8 FC, T, N D None
8 62 M 45 35 20 5 1.9 S, H, FC D, FG None
9 49 M 50 35 20 5 1.7 S, H, N FG None
[image:3.594.133.454.449.705.2]All subjects were scanned with standard MR images in the trans-versal plane by using a T1-weighted spin-echo sequence (acquisition time, 180 seconds; TR, 500 ms; TE, 16 ms; 19 sections; section thick-ness, 6.0 mm; matrix, 256⫻256; FOV, 210 mm; flip angle, 70°), a proton- and T2-weighted turbo spin-echo (double-echo) sequence (acquisition time, 283 seconds; TR, 2900 ms; TE, 13 ms and 81 ms; 19 sections; section thickness, 6.0 mm; matrix, 256⫻256; FOV, 210 mm; flip angle, 150°), and a FLAIR sequence (acquisition time, 218 seconds; TR, 9000 ms; TE, 108 ms; 19 sections; section thickness, 6.0 mm; matrix, 256⫻256; FOV, 210 mm; flip angle, 150°) before hypo-glycemia to rule out pathologic brain findings. During hypohypo-glycemia, sequential DWI sequences were obtained without interruption, ex-cept the necessary loading time for the sequence parameters. The standardized protocol repeated 1 DWI scan as soon as the ongoing DWI scan had finished until the end of the IST. With an acquisition time of 114 seconds, we could obtain 5 scans within 10 minutes. The end of the IST was indicated by the consultant of internal medicine, who performed the IST in the scanner room.
Five minutes after normalization of blood glucose to valuesⱖ4.0 mmol/L, 1 final DWI sequence and 1 final gadolinium-enhanced T1-weighted spin-echo sequence (after intravenous infusion of 0.1 mmol/kg of gadopentetate dimeglumine [Magnevist, Schering, Ber-lin, Germany]) were performed. The total scanning time per subject was between 2 and 3 hours, depending on the time needed to establish the individual subject’s hypoglycemia. All MR images were indepen-dently assessed by 2 neuroradiologists blinded to the clinical information.
Results
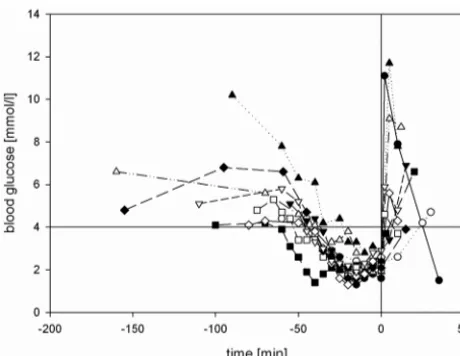
Severe hypoglycemia was established in all subjects: Blood glucose levelsⱕ4.0 mmol/L were achieved for 43.8⫾10.9 minutes,ⱕ3.0 mmol/L for 31.5⫾12.0 minutes, andⱕ2.5 mmol/L for 20.5⫾10.7 minutes. In 8 subjects, blood glu-cose was lowered toⱕ2.0 mmol/L for 10⫾5.3 minutes (Fig 2). All subjects developed clinical symptoms of neurogly-copenia or adrenal counter-regulation (Table 2). The mean nadir of blood glucose was 1.75⫾0.38 mmol/L, ranging from 1.3 to 2.4 mmol/L (Fig 3). There was no difference in the nadir of hypoglycemia regarding sex (women, 1.82
mmol/L, versus men, 1.68 mmol/L). Two of 10 participants started developing neuroglycopenic symptoms at a blood glucose level of 2.8 –3.0 mmol/L. The first onset of neuro-glycopenic symptoms was observed at a mean blood glucose level of 2.51⫾0.93 mmol/L.
Analyzing the DWIs, we observed no visible alterations of the DWIs and ADC maps during hypoglycemia in any indi-vidual (Table 3). The ADC measurements were stable. The mean ADC value of the splenium in normoglycemic state was 74.31 mm2/s⫻10⫺6⫾7.27 versus 74.18 mm2/s⫻10⫺6⫾ 7.54 in hypoglycemic state; statistical analysis showed no sig-nificant difference (P⫽.95). Analyzing the ADC values of the left and right thalamus showed similar results: The mean ADC value of the right thalamus in a normoglycemic state was 73.14 mm2/s⫻10⫺6⫾5.10, while the mean ADC value was 74.0 mm2/s⫻10⫺6⫾4.11 in a hypoglycemic state. Statistical anal-ysis showed no significant difference (P⫽.17). The mean ADC value of the left thalamus in a normoglycemic state was 73.55 mm2/s⫻10⫺6⫾4.57, while the mean ADC value was 74.98 mm2/s⫻10⫺6⫾4.65 in a hypoglycemic state. Statistical analysis showed no significant difference (P⫽.09).
The final contrast-enhanced T1-weighted sequence after hypoglycemia revealed no signs of blood-brain barrier leak-age. The findings of the initially performed T2 and FLAIR scans were all normal.
Discussion
The physiologic postabsorptive blood glucose concentration range is 4.0 – 6.0 mmol/L.4Although 3.9 mmol/L is commonly cited as the lower limit of normal blood glucose, there is no commonly accepted precise value of a blood glucose level de-fining the beginning of hypoglycemia. The American Diabetes Association reported in“Standards of Medical Care in Diabe-tes-2007,”25a blood glucose level of 3.9 mmol/L as a glycemic threshold for hypoglycemia with the need of treatment. The glycemic threshold for neuroglycopenic symptoms and cogni-tive impairments is reported at 2.8 –3.0 mmol/L.4The Cana-dian Diabetes Association26proposed a blood glucose level of 4.0 mmol/L as an operational clinical cutoff for hypoglycemia and classified hypoglycemia as“severe” when the blood glu-cose level is lower than 2.8 mmol/L, the individual requires the
Fig 2.Blood glucose levels of subjects during the procedure. The horizontal line indicates
the lower threshold of physiologic postprandial blood glucose concentration (4.0 mmol/L); the vertical line indicates the end of hypoglycemia by administering 40 mL of glucose 40% intravenously.
Fig 3.Duration of hypoglycemia during DWI. The blood glucose level was lowered to⬍4.0
[image:4.594.53.283.42.220.2] [image:4.594.300.531.43.200.2]assistance of another person, or the patient may be unconscious.
In this study, a mild hypoglycemia was defined as a labora-tory blood glucose measurement ofⱕ3.3 mmol/L without clinical symptoms of neuroglycopenia or adrenal counter-reg-ulation (sweating, hunger, freezing, nausea, tremor, agitation, drowsiness, double vision, loss of mental concentration, fa-tigue, dysaesthesia, or blurred speech). Severe hypoglycemia was defined as a laboratory blood glucose measurement of
ⱕ2.5 mmol/L and clinical symptoms of neuroglycopenia or adrenal counter-regulation.
Severe cerebral hypoglycemia with onset of neurologic symptoms is reported to be associated with diffusion distur-bances, which could be visualized as hyperintense lesions in DWI in very different regions of the brain such as the internal capsules,7,8,11,14,15hippocampus,12,16basal ganglia,12pons,17 splenium of the corpus callosum,9,13,15corona radiata,8,9and cortex of the frontal or parietal or occipital lobe.8,10,12,15,16,18,19 A summary is given in Table 2. The reported signal-intensity augmentation in DWI corresponds to a low diffusion value. In normal brain tissue, random water diffusion (Brownian mo-tion) decreases the amplitude of the signal intensity due to phase incoherence. With cytotoxic edema, there is no net change in water content, only a change in its distribution. The amount of water within the cellular compartment, where the Brownian motion is restricted, increases. Phase coherence here is preserved, and there is more signal intensity recovered during the diffusion observation period, producing a high sig-nal intensity.
Hypoglycemia constitutes a unique metabolic brain in-sult.27Most knowledge of hypoglycemic effects on the brain is derived from animal studies.28-30Although infarction and hy-poglycemia exhibit similar findings on DWI, the neurochem-ical analyses reveal profound differences: Cellular redox sys-tems are reduced in ischemia but are oxidized in hypoglycemia31; and brain pH is decreased in ischemia due to the formation of lactic acid but is elevated in hypoglycemia32 due to the formation of ammonia from deamination of amino acids, the absence of lactic acid, and the consumption of met-abolic acid. In hypoglycemia, adenosine triphosphate levels are still more than one-third of normal29but less than 5% in ischemia.33
Hypoglycemia only causes neuronal death during blood glucose levels ranging from 1.36 to 0.12 mmol/L, when EEG isoelectricity is established. Significant neuronal damage oc-curs after 30 minutes of electrocerebral silence.34The onset of ionic and metabolic changes occurs abruptly at the onset of EEG isoelectricity, and neuronal damage is absent in hypogly-cemia unless the EEG becomes isoelectric, regardless of the blood glucose level at which the EEG goes flat.34 Hypoglyce-mia kills neurons actively and not, as was assumed earlier, by depriving them of glucose. In hypoglycemia, the glycolysis is reduced, resulting in accumulation of oxaloacetate because there is little acetate with which to condense to form citrate. This shifts the aspartate-glutamate transaminase reaction to-ward aspartate. Aspartate is a known neurotoxin by virtue of its excitatory properties.35The excitatory amino acid aspartate in tissue increasesⱕ400%30and is massively released into the extracellular space, where aspartate levels increase up to 1500%36and flood the excitatory amino acid receptors located on neuronal dendrites. The characteristic neuropathology is the destruction of dendrites due to the location of receptors. Calcium fluxes occur, and membrane breaks in the cell lead rapidly to neuronal necrosis. Selective neuronal necrosis re-sults when cell membrane destruction spreads from dendrites to neuronal perikarya. Aspartate leads to selective neuronal necrosis predominantly in the cerebral cortex, caudoputamen, and hippocampus,37thus offering a different lesion pattern compared with lesions caused by cerebral ischemia. Further-more, hypoglycemia is generalized but not dependent on vas-cular territories, resulting in a distribution of lesions that does not follow any vascular territory.38
Other imaging modalities could also contribute to differ-entiating ischemia and hypoglycemia: MR spectroscopy, though it needs some time to be performed and analyzed, could possibly detect changing concentrations of lactic acid in ischemic brain tissue. Also perfusion imaging should contrib-ute to the differentiation of hypoglycemia and ischemia: In ischemia, perfusion imaging is more likely to detect a perfu-sion deficit in the area where the diffuperfu-sion disturbance is de-tected, visualizing the penumbra, whereas in hypoglycemia, it is not likely to depict a perfusion deficit.
This characteristic lesion pattern in hypoglycemia offers the possibility of distinguishing lesions of ischemic and hypo-Table 3: ADC values in different regions of interest before starting and before ending the hypoglycemic statea
ADC Values in Normoglycemic State (mm2/s⫻10⫺6) ADC Values in Hypoglycemic State (mm2/s⫻10⫺6)
Splenium
Thalamus
Splenium
Thalamus
Right Left Right Left
77.8 74.9 76.2 83.7 75.0 76.5
79.3 71.4 73.4 86.6 71.2 74.3
65.2 72.3 74.1 67.7 72.0 73.8
76.5 72.4 72.3 72.4 73.2 72.9
76.7 81.7 82.0 82.6 80.6 84.3
65.4 73.0 70.4 64.4 72.0 67.3
86.2 76.4 73.5 73.8 77.3 74.7
79.8 78.5 79.1 76.2 80.0 81.4
74.0 68.6 69.3 69.4 72.3 74.1
62.2 62.2 65.2 65.0 66.4 70.5
Mean 74.31 73.14 73.55 74.18 74.0 74.98
SD 7.27 5.10 4.57 7.54 4.11 4.65
a
[image:5.594.53.533.60.221.2]glycemic origin by using DWI of the brain. Even postmortem, it is sometimes possible to distinguish brain damage of hypo-glycemic origin (eg, due to insulin overdose) and brain dam-age of ischemic origin. If prevailing symmetric superficial lam-inar necrosis of the cerebral cortex is demonstrable, then hypoglycemic brain damage is more likely,38while symmetric superficial laminar necrosis after ischemia is less often seen.37 Considering the effect of glucose infusion may be an addi-tional diagnostic tool because severe transient hypoglycemia causes reversible hyperintense lesions in humans8,9and in an-imal studies,21whereas ischemic hyperintense lesions should not disappear.
To our knowledge, our results demonstrate, for the first time, that neither hypoglycemia with a blood glucose level of ⬍2.5 mmol/L for a duration of 20 minutes nor severe hypo-glycemia of ⬍2.0 mmol/L for 10 minutes induce visible changes in DWI of the human brain.
Our findings in humans are in concordance with the data from animal experiments, which show that serious brain dam-age does not occur in hypoglycemia until electrocerebral si-lence is present for at least several minutes. Neuronal death only appears after 30 minutes of EEG isoelectricity, and the attenuation of neuronal necrosis is positively related to the number of minutes of cerebral isoelectricity up to the maxi-mum examined period of 60 minutes.34
Boyle et al39reported that some patients with insulin-de-pendent diabetes mellitus might develop higher rates of glu-cose uptake in the brain during hypoglycemia, causing an un-awareness of lower plasma glucose concentrations. It is known that the capillary respective plasma glucose levels do not al-ways represent the cerebral glucose level. Glucose reaches the brain by crossing the blood-brain barrier by means of the spe-cific glucose transport protein 1.40When endothelial cells in capillaries in the brain are deprived of glucose, there is an associated increase in the transcription and translation of this protein,40,41and the normal energy metabolism in the brain could potentially be maintained in the presence of lower sys-temic plasma glucose concentrations. In our study, during the examination, all participants did not show signs of an in-creased glucose uptake because all of them developed signs of physiologic counter-regulations with both autonomic and neuroglycopenic symptoms.
Lindstrom et al42observed that severe hypoglycemia may cause cardiac arrhythmias like bradyarrhythmia, ventricular ectopic beats, ST-depression, and flattening of the T-wave, which hypothetically may also lead to diffusion disturbances visible in DWI of the human brain, presumably caused by cardiac microembolism. These ischemic lesions should not be reversible, when euglycemia is established. However the re-versibility of hyperintense lesions in severe hypoglycemia in humans is reported by Aoki et al8and Bo¨ttcher et al9and in animal studies by Hasegawa et al.21
Our results confirm the hypothesis that visible alterations of brain tissue in DWI of the human brain are potentially induced not only by the severity of hypoglycemia but also by its duration. With respect to the high sensitivity of DWI in visualizing cytotoxic cell edema, whereas in cerebral ischemia high signal intensity occurs only within minutes after ischemia onset, we conclude that short-term severe hypoglycemia does not induce visible diffusion changes on DWI, assuming that
on a cellular level, the metabolic transpositions are still compensable.
These findings are of major clinical relevance when assess-ing the impact of short-term severe hypoglycemia on the hu-man brain in patients with diabetes, in whom this type of hypoglycemia is most typical and frequent.
We are well aware of the limitations of our study: First, the small number of participants may not be powered to detect rare DWI changes of acute hypoglycemia. Second, the group was not homogeneous with regard to their diagnosis but was homogeneous with regard to the neurologic status of the par-ticipants. Because we focused on the integrity of brain diffu-sion during acute severe hypoglycemia, the homogeneity of the neurologic status is of importance, while a certain sub-group diversity could even lead to an earlier detection of brain diffusion differences within the participating subgroups. An-other self-evident limitation of our study is that we could not ever evaluate diffusion imaging of hypoglycemia in cases with the most severe hypoglycemic symptoms like unresponsive-ness because the IST was always stopped or had to be aban-doned long before this severe hypoglycemic symptom devel-oped. So also in the future, this special aspect of hypoglycemia has to be left to the evaluation and meta-analyses of incidental case reports only.
Further studies with a larger number of participants are still necessary, especially considering that with the ongoing wide-spread clinical use of 3T MR imaging, systematic comparisons of the known differences between 3T and 1.5T43in diffusion imaging are still desirable.
Conclusions
Hyperacute short-term severe hypoglycemia for⬍10 minutes does not induce visible changes in DWI of the human brain, suggesting that prolonged hypoglycemia may be the relevant cause for observed reversible diffusion disturbances in MR imaging. Therefore, prompt adequate therapy for hypoglyce-mia can prevent cerebral injury in patients with diabetes.
Disclosures: Hans-Joachim Mentzel was a speaker at conferences and is a member of the Speaker Bureau for Bayer Healthcare (Germany), GE Healthcare (Germany), and Novartis (Germany). Ulrich Alfons Mu¨ller received research support (including provision of equipment or materials) from Roche Diagnostics in the form of a grant for multicentric evaluation of a structured patient education program for optimization of intensified insulin therapy, which was completed in 2009, and a grant for an ongoing telemedicine project in diabetes mellitus type 2.
References
1. Laing SP, Swerdlow AJ, Slater SD, et al.The British Diabetic Association Co-hort Study. II. Cause-specific mortality in patients with insulin-treated dia-betes mellitus.Diabet Med1999;16:466 –71
2. Cryer PE.Iatrogenic hypoglycemia as a cause of hypoglycemia-associated au-tonomic failure in IDDM: a vicious cycle.Diabetes1992;41:255– 60 3.The effect of intensive treatment of diabetes on the development and
progres-sion of long-term complications in insulin-dependent diabetes mellitus: The Diabetes Control and Complications Trial Research Group.N Engl J Med
1993;329:977– 86
4. Cryer PE, Davis SN, Shamoon H.Hypoglycemia in diabetes.Diabetes Care
2003;26:1902–12
5.U.K. Prospective Diabetes Study 16: overview of 6 years’ therapy of type II diabetes—a progressive disease. U.K. Prospective Diabetes Study Group. Di-abetes1995;44:1249 –58
6. Mu¨ller N, Mu¨ller UA, Kerner W.Care and outcomes in 35,723 adults with diabetes mellitus in Germany 2005.Diabetologia2006;49(suppl);250 7. Albayram S, Ozer H, Gokdemir S, et al.Reversible reduction of apparent
8. Aoki T, Sato T, Hasegawa K, et al.Reversible hyperintensity lesion on diffu-sion-weighted MRI in hypoglycemic coma.Neurology2004;63:392–93 9. Bo¨ttcher J, Kunze A, Kurrat C, et al.Localized reversible reduction of apparent
diffusion coefficient in transient hypoglycemia-induced hemiparesis.Stroke
2005;36:e20 –22
10. Chan R, Erbay S, Oljeski S, et al.Case report: hypoglycemia and diffusion-weighted imaging.J Comput Assist Tomogr2003;27:420 –23
11. Cordonnier C, Oppenheim C, Lamy C, et al.Serial diffusion and perfusion-weighted MR in transient hypoglycemia.Neurology2005;65:175
12. Finelli PF. Diffusion-weighted MR in hypoglycemic coma. Neurology
2001;57:933
13. Kim JH, Choi JY, Koh SB, et al.Reversible splenial abnormality in hypoglyce-mic encephalopathy.Neuroradiology2007;49:217–22. Epub 2006 Nov 30 14. Kim JH, Roh JH, Koh SB.Reversible injury of internal capsule and splenium in
a patient with transient hypoglycemic hemiparesis.Cerebrovasc Dis2006;22: 282– 83. Epub 2006 Jun 29
15. Lo L, Tan AC, Umapathi T, et al.Diffusion-weighted MR imaging in early diagnosis and prognosis of hypoglycemia. AJNR Am J Neuroradiol
2006;27:1222–24
16. Maekawa S, Aibiki M, Kikuchi K, et al.Time-related changes in reversible MRI findings after prolonged hypoglycemia. Clin Neurol Neurosurg 2006; 108:511–13
17. Shirayama H, Ohshiro Y, Kinjo Y, et al.Acute brain injury in hypoglycaemia-induced hemiplegia.Diabet Med2004;21:623–24
18. Yanagawa Y, Isoi N, Tokumaru AM, et al.Diffusion-weighted MRI predicts prognosis in severe hypoglycemic encephalopathy. J Clin Neurosci
2006;13:696 –99
19. Yoneda Y, Yamamoto S.Cerebral cortical laminar necrosis on diffusion-weighted MRI in hypoglycemic encephalopathy. Diabet Med 2005; 22:1098 –100
20. Maruya J, Endoh H, Watanabe H, et al.Rapid improvement of diffusion-weighted imaging abnormalities after glucose infusion in hypoglycemic coma.J Neurol Neurosurg Psychiatry2007;78:102– 03
21. Hasegawa Y, Formato JE, Latour LL, et al.Severe transient hypoglycemia causes reversible change in the apparent diffusion coefficient of water.Stroke
1996;27:1648 –55, discussion 1655–56
22. Auer RN.Hypoglycemic brain damage.Forensic Sci Int2004;146:105–10 23. Lange M, Svendsen OL, Skakkebaek NE, et al.An audit of the insulin-tolerance
test in 255 patients with pituitary disease.Eur J Endocrinol2002;147:41– 47 24. Wright D, Shah M, Peacey SR.The insulin stress test performed by an
experi-enced endocrine specialist nurse: a safe and reliable procedure.Clin Endocri-nol (Oxf)2007;66:755–56. Epub 2007 Mar 23
25. American Diabetes Association.Standards of medical care in diabetes–2007.
Diabetes Care2007;30(suppl 1):S4 – 41
26. Canadian Diabetes Association Clinical Practice Guidelines Expert Committee. Canadian Diabetes Association 2003 clinical practice guidelines for the
pre-vention and management of diabetes in Canada.Can J Diabetes2003;27(suppl 2):S1–152
27. Auer RN.Hypoglycemic brain damage.Metab Brain Dis2004;19:169 –75 28. Kiessling M, Xie Y, Kleihues P.Regionally selective inhibition of cerebral
pro-tein synthesis in the rat during hypoglycemia and recovery.J Neurochem
1984;43:1507–14
29. Agardh CD, Kalimo H, Olsson Y, et al.Hypoglycemic brain injury: metabolic and structural findings in rat cerebellar cortex during profound insulin-in-duced hypoglycemia and in the recovery period following glucose adminis-tration.J Cereb Blood Flow Metab1981;1:71– 84
30. Norberg K, Siesio BK.Oxidative metabolism of the cerebral cortex of the rat in severe insulin-induced hypoglycaemia.J Neurochem1976;26:345–52 31. Rehncrona S, Folbergrova J, Smith DS, et al.Influence of complete and
pro-nounced incomplete cerebral ischemia and subsequent recirculation on cor-tical concentrations of oxidized and reduced glutathione in the rat.J Neuro-chem1980;34:477– 86
32. Pelligrino D, Siesjo BK.Regulation of extra- and intracellular pH in the brain in severe hypoglycemia.J Cereb Blood Flow Metab1981;1:85–96
33. Siesjo BK.Cell damage in the brain: a speculative synthesis.J Cereb Blood Flow Metab1981;1:155– 85
34. Auer RN, Olsson Y, Siesjo BK.Hypoglycemic brain injury in the rat: correla-tion of density of brain damage with the EEG isoelectric time—a quantitative study.Diabetes1984;33:1090 –98
35. Auer RN. Progress review: hypoglycemic brain damage. Stroke
1986;17:699 –708
36. Sandberg M, Butcher SP, Hagberg H.Extracellular overflow of neuroactive amino acids during severe insulin-induced hypoglycemia: in vivo dialysis of the rat hippocampus.J Neurochem1986;47:178 – 84
37. Auer RN, Wieloch T, Olsson Y, et al.The distribution of hypoglycemic brain damage.Acta Neuropathol1984;64:177–91
38. Kalimo H, Olsson Y.Effects of severe hypoglycemia on the human brain: neu-ropathological case reports. Acta Neurol Scand1980;62:345–56
39. Boyle PJ, Kempers SF, O’Connor AM, et al.Brain glucose uptake and unaware-ness of hypoglycemia in patients with insulin-dependent diabetes mellitus.
New Engl J Med1995;333:1726 –31
40. Takakura Y, Trammel AM, Kuentzel SL, et al.Hexose uptake in primary cul-tures of bovine brain microvessel endothelial cells. II. Effects of conditioned media from astroglial and glioma cells.Biochim Biophys Acta1991;1070:11–19 41. Boado RJ, Pardridge WM.Glucose deprivation causes posttranscriptional en-hancement of brain capillary endothelial glucose transporter gene expression via GLUT1 mRNA stabilization.J Neurochem1993;60:2290 –96
42. Lindstrom T, Jorfeldt L, Tegler L, et al.Hypoglycaemia and cardiac arrhyth-mias in patients with type 2 diabetes mellitus.Diabet Med1992;9:536 – 41 43. Kosior RK, Wright CJ, Kosior JC, et al.3-Tesla versus 1.5-Tesla magnetic