The. Interaction Network:
a Performance Evaluation Tool for
Loosely-Coupled Distributed Systems
Paul Ashton and John Penny Technical Report COSC 01/91
e-mail contacts:
paul@cosc. canter bury .ac .nz
penny@cosc .canterbury .ac.nz
Abstract
For users of loosely-coupled distributed systems, questions about "performance" commonly involve interactive performance. The problem of measuring components of interactive response times is approached by representing the processing needed for each interaction as a graph called an interaction network. The critical path through an interaction network shows the sequence of steps that take the longest time to execute. The goal of improving performance is presented as requiring strategies to shorten the lengths of critical paths. To identify these strategies, we augment each interaction network with vertices that represent additional events of interest to a performance analyst. A particular aim has been a unified approach that treats all types of system resource (hardware, software, or data) in a consistent fashion. An example is given to show that a set of event recorders can be designed to provide measurements for an exhaustive decomposition of response times for selected sets of interactions. Finally, details are given of experimental work done to record and analyse interaction networks.Categ01ies and Subject Descriptors: C2.4
[Computer-Communications Networks]:
Distributed Systems -
Distributed Applications;
C.4[Performance of Systems]:
Measurement Techniques; D4.7[Operating Systems]:
Organization and Design -Distributed Systems,
Interactive Systems;
D4.8[Operating Systems]:
Performance -Measurement, Monitors.
1. INTRODUCTION
Much of today's computing is done on what can be broadly described as loosely-coupled distributed systems. By a loosely-coupled distributed system, we mean a collection of separate computer systems (nodes) which communicate and synchronise only by passing messages across
communication networks [25]. Nodes are likely to be grouped within local area networks (LANs), and these LANs to be interconnected by wide area networks. Each user has direct access to a personal computer or workstation, with processing done locally or on one or more workstations or mainframes accessible through the networks.
The equipment that the authors use is a typical example. Each user has direct access to a Sun workstation or an Apple Macintosh. The former is connected directly to an ethernet LAN, and the latter to an Appletalk network which is connected to the ethernet LAN. Processing is done on one or more of the following processors: the local Sun or Macintosh, workstations within the LAN, or mainframe(s) outside the immediate LAN. In almost all cases, the user requires access to a file server which, for any user, is implemented on one or more different nodes somewhere in the network.
The work to be described here is intended to apply for any system in which users interact directly with one workstation, dedicated or shared, and have their computing done on any number of arbitrarily chosen workstations or mainframes that are accessible across networks. The
perfom1ance problems to be solved for this hardware configuration are very different from those encountered when using traditional time-sharing systems.
1.1 Performance Problems
In the past, performance evaluation tended to deal with questions such as whether a CPU was efficiently utilised, or whether jobs could be run in appropriate "mixes" [10, 11]. Lower hardware costs have progressively reduced the relevance of these issues, but decreasing hardware costs have been accompanied by increasing expectations. Performance problems have become more complex, because hardware and software systems are now much more elaborate than they were.
Many applications are implemented today by layering software systems one on top of another, a practical way of making powerful systems work but, in traditional terms, a way that makes very inefficient use of hardware. Whereas performance measurement tools were once concerned mostly with efficient use of hardware, today's performance problems are likely to be at least equally
concerned with the efficiency of large software systems, or of rapid access to large databases. One example, from our own experience, concerns use of the Ingres database management system [9] configured with command interpreters running on individual workstations, and the DBMS itself running (mostly) on a file server. This arrangement worked well for individual data base projects, even with large databases, but was very slow when used by. a class of 20 students, even though each database was trivial. We reduced mean response times by a large factor, simply by doubling the memory on the file server. Perhaps there is still room for improvement by an order of · magnitude or more. Certainly, we see many options that might improve performance, but we need better information on which should be pursued.
Traditionally, a performance project was directed most often at evaluation of a single time-sharing computer system, whose components and configuration were easily specified. Today, we are more likely to be interested in performance of a software sub-system that runs on a distributed system whose limits may be hard to define. We see the archetypal performance problem as one in which the best possible performance is wanted from a software package that:
(1) is used interactively by multiple users, (2) is very large and complex,
(3) can be configured in a number of ways, and runs on a varying set of nodes within a distributed system whose boundaries may be ill-defined, and
)
1.2 Definition of an Interaction
For users of a loosely-coupled distributed system, questions about "performance" most commonly involve interactive performance. Intuitively, we think of interactive performance in terms of interactions, and response times for those interactions. For performance work in the past, interactions have tended to be viewed within a sequential dialogue [14] where the user inputs a command to the system, which processes the request, and passes output back to the user, who then inputs another command, and so on. This way of looking at interactions has been common for work in both measurement ((11, 24] for example) and modelling ((15, 17] for example).
From this transaction-oriented view of user interactions, a definition of response time appeared to follow naturally as (say) the interval between completion of user input and the beginning of system output. Abrams gave a widely-quoted definition of response time as the "elapsed time between the last user keystroke until the first meaningful character is displayed" [1]. Even with that simple definition, individual response times were not easy to measure (20]. The "last user keystroke" of a command might usually be input of a newline character, but not every newline would signify the end of a command. The first output following that particular keystroke might usually be the beginning of the system's response, but might instead be a phrase such as "processing started". This traditional model of user interactions cannot in any case deal with interactive dialogues on
modern workstations. These use graphics as well as text, and allow for a variety of input sources. A user may have simultaneous control of many interactions. Interactive dialogues might also be analysed at different levels; models of interactive dialogues (see (19], for example) tel)d to agree at least on the existence of three levels: lexical, syntactic, and semantic.
Clearly, .i very general model is needed. We define an interaction as one instance of the pair <user action, system reaction>
where the user action provides some input, and the system reaction is all of the processing (which may include output) resulting from that user action.
The definition refers to one instance of the <action, reaction> pair. If a user were to repeat an action, the time to complete the reaction may be longer or shorter. The objective for improvement of interactive performance for (say) some software sub-system can be described informally as follows: given a set of user actions, all being inputs for that sub-system, we would like to make modifications (of hardware, software, and/or data structures) that will substantially reduce the time needed to complete the corresponding system reactions.
1.3 Methodology
To decide what modifications are worth making, we need measurements that can be analysed to show what contributes to the time taken to produce the system reactions. In this paper, the problem of measuring components of response times is approached in the following way. First, the task of producing the system reaction for each user action is seen as a set of sub-tasks, where each sub-task is a period of purely sequential processing. Relationships between sub-tasks are then represented by a directed acyclic graph called an interaction network.
The critical path through an interaction network is the path which shows the sequence of steps that take the longest time to execute. (The idea is analogous to the definition by Yang and Miller [28] of the critical path through a program activity graph (PAG), but we will show that our interaction network is substantially different from a PAG.) The problem of improving performance is
presented as requiring strategies to shorten the lengths of critical paths. We set out to identify these strategies by augmenting each interaction network with vertices representing events that are of interest to someone wanting to analyse performance of the system. A particular aim has been a unified approach that treats all types of system resource (hardware, software, or data) in a consistent fashion simply as system objects. Events to be recorded that relate to those objects are then of only two kinds: begin_use or end_use; we refer to these as object-use events.
give insight into the practical problem of determining what instrumentation is needed for performance measurement of loosely-coupled distributed systems.
At the centre of our work is the idea of representing the processing needed for each interaction as an interaction network. The work shows how systems could be instrumented at design time to record these networks. While it is not easy to modify an existing system to record these networks, we have instrumented a version of SunOS to the point where we can record and display simple interaction networks.
2.
DISTRIBUTEDSYSTEM
MODELThe idea of an interaction network is developed for a model of a distributed system consisting of a collection of nodes connected only by communication networks. That is, nodes cannot share memory, clock signals, or devices. Each node can be a general-purpose computer system or a special-purpose system such as a file server, and may be a uniprocessor or tightly-coupled
multiprocessor system. The model is described in detail in [3], where it is shown that the model is general enough to cover process-oriented and object-oriented operating systems, and to apply to centralised, network, and distributed operating systems, and to collections of different operating systems within a single distributed hardware system.
The two fundamental activities in a computer system, distributed or centralised, are computation and communication, where the latter includes both the exchange of data, and process synchronization. Computation is performed by processors following threads of execution, each thread being "a schedulable unit of flow of control" [7). Each thread has a number of pieces of private context information, including its execution history (usually a stack), and its saved processor state. Other context may be shared between several threads, an example being an address space within which a number of threads execute. The thread is the unit for CPU scheduling, and threads can be created and terminated dynamically.
Threads may communicate through shared memory or by message passing [2]. Shared memory communication is usable only for intra-node communication, whereas message passing can be used for both intra- and inter-node communication.
When two threads communicate by message passing, the sending thread specifies the recipient and the message contents, and sends the message using a send primitive; the receiving thread invokes a receive primitive to receive the message. Each primitive may be blocking or non-blocking. A blocking send blocks the sending thread until the receiving thread reads the message. A
non-blocking send delays the sending thread long enough to put the message into a buffer, but the thread is delayed only if no buffers are available. A blocking receive blocks the receiving thread until a message is available. A non-blocking receive will typically read a message if one is available, and return an error indication if no message is available. The blocking send and receive primitives provide synchronous message passing, and the non-blocking send and blocking receive primitives provide asynchronous message passing [5].
For intra-node communication, a message may be copied from the address space of the sending thread to the address space of the receiving thread, possibly via the kernel address space. An example is the passing of messages using pipes and Unix domain sockets in 4.3 BSD Unix [16). Alternatively, a message can be passed using an area of memory shared by the sending and receiving threads, giving considerable performance advantages over copying for large messages. An example is in Mach [29].
For message passing, the send and receive primitives give threads the ability to exchange data (each message contains data), and to synchronise with each other (a message cannot be received before it is sent or before the receiving thread is ready). With shared memory, data exchange is achieved by threads reading and writing shared variables, and synchronization is achieved by threads using synchronization primitives such as spin-locks and semaphores.
3. THE INTERACTION NETWORK
processing required to perform a single task is represented in an interaction network, a directed acyclic graph that shows both the interrelationships of the sub-tasks constituting the task, and events that occur within each sub-task.
In this section, we describe how a task is divided into sub-tasks, the events to be recorded in an interaction network, and how these events relate to sub-tasks. We then refer back to the distributed systems model to show how computation and <::ommunication are represented in an interaction network. Finally, an example is given of a simple interaction network.
3.1 Sub-Task Structure
The system's reaction begins when some thread recognises an action such as a key-stroke. This initial thread is likely to request other threads to perform processing and, while the task starts in a single thread, it may spread to many other threads. A task, then, is performed by communicating threads. When the user action is recognised, a sub-task associated with the initial thread is created to start the task. As the task progresses, tasks are created as needed. At any instant, a sub-task is associated either with a thread performing work for the sub-task, or with a message associated with the task.
A new sub-task is created when some event occurs to cause two pieces of work for the task to proceed in parallel. Examples of such fork events are: when a thread sends a message (the thread and the message are the two pieces of work); and when a thread creates a new thread (the creating and the created thread are the two pieces of work). A sub-task terminates when the thread or message with which it is associated has completed its work for the task, or when the sub-task joins with another sub-task within the same task. A task is finished - and the system reaction completed - when the last of its sub-tasks terminates.
3.2 Interaction Network Events
Each vertex of an interaction network represents an event in the life of a sub-task. These are events that signify the beginning and end of every sub-task, and events (generally object-use events) that occur during a sub-task. An event occurs at a particular time, so vertex Vi represents an event that occurred at time(vi), Each arc in an interaction network represents the state of a sub-task between two consecutive events. Each arc is therefore directed, showing a forward progression in time. That is, for arc (i,j) from vertex Vi to vertex Vj, time(vi)
<
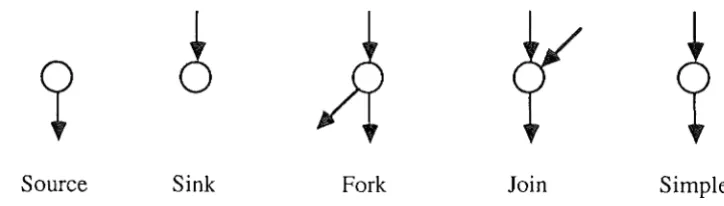
time(vj), For the period represented in each arc, a sub-task is associated either with a thread executing work as part of the task, or with a message related to the task.Five patterns of arc connections to vertices, as shown in Figure 1, are required to represent events in an interaction network. Source and fork vertices represent the creation of a new sub-task, and
sink and join vertices represent the termination of a sub-task. Each of these four vertex types corresponds to a change in the number of sub-tasks. Simple vertices are used to represent those events that do not change the number of sub-tasks.
Source Sink Fork Join
Figure 1: Interaction network constructs A sub-task can be created in one of two ways:
Simple
[image:5.598.108.470.562.665.2](ii) When a sub-task creates a new sub-task. This event is represented by a fork vertex, with the incoming arc and one of the outgoing arcs representing the existing sub-task, and the second outgoing arc representing the new sub-task. Such events most commonly occur when an existing thread creates a new thread, or when a thread sends a message. The new sub-task is associated respectively with the new thread or the new message. A "send event" may be a message send, a shared variable write, or a synchronization operation.
Analogously, a sub-task can end in one of two ways:
(i) When a thread or message has completed the work it has to perform for the task. This event is represented by a sink vertex, with the incoming arc representing the sub-task associated with the thread or message which ends its work for the task at the sink vertex.
(ii) When two sub-tasks join. This event is represented by a join vertex, with one of the incoming arcs and the outgoing arc representing the continuing sub-task, and the second incoming arc representing the terminating sub-task. Such events occur, for example, when two threads join or when one thread receives a message. In the latter case, the continuing sub-task is the one
associated with the thread, and the terminating sub-task is the one associated with the message. A "receive event" may be a message receive, a shared variable read, or a synchronization operation.
The interaction network can now be considered as a whole. Each sub-task begins at either the source vertex (the initial sub-task only), or a fork vertex (created role), and progresses through a series of fork (creating role), join (continuing role), and simple vertices until a sink vertex or join vertex (terminating role) is reached. The interaction network shows all sub-tasks and connections between them. Later, we show how an interaction network is augmented by simple vertices within sub-tasks, to represent events of interest for performance measurement.
Each interaction network is a connected acyclic digraph. An interaction network is a connected graph because all vertices in a sub-task are connected, and all sub-tasks created after the first are either created directly by the first sub-task or created by one of its descendants, with each created sub-task being connected to the sub-task that created it. An interaction network is acyclic because each arc represents a forward progression of time, and a cycle would require at least one arc that went back in time, or two or more arcs which went neither forward nor backward (sideways perhaps) in time.
3.3 Computation and Communication
Earlier, we defined distributed systems in terms of nodes, threads and communication mechanisms. The way in which nodes, threads, and communication mechanisms are used to perform a task is to be represented by the task's interaction network. We first discuss threads, and then nodes and communication mechanisms.
Between threads and the tasks for which they perform work, there is a many-to-many relationship. That is, a task is performed by one or more threads, and a thread can perform work for one or more tasks. Some threads that perform processing for a task may already exist, while others are created during the course of the task. Some threads that perform processing for a task may terminate during the task, while others (such as threads within a server) remain to perform processing for other tasks.
The association between a sub-task and a thread begins in one of three ways:
(i) When a user action is recognised, the initial thread is associated with the initial sub-task of the task.
(ii) When a thread is created by another thread, the created thread is associated with a new sub-task that is part of same task as the creating thread.
(iii) When a thread receives a message from another task, and starts performing work for the sub-task contained in the message.
The association between a sub-task and a thread ends in one of two ways:
(ii) When the thread finishes work for the current sub-task and, on receiving a message, starts work for a new sub-task that is part of a different task.
Vertices representing events of all these types can be recorded in an interaction network.
The extent to which a task uses different nodes in a distributed system is easily found because each thread executes on a node, and node usage can be deduced from the thread usage of a task. If a thread migrates from one node to another part-way through its execution, the migration can be represented as a series of two or more vertices.
Various communication mechanisms can be represented in an interaction network. While the discussion is given here in terms of message passing, communication through shared memory can be represented in a similar way. (There are some differences that are dealt with in [3], together with a number of other issues such as broadcast and multicast communication.)
The passing of a message involves at least two events: the sending of the message by the sending thread, and the reception of the message by the receiving thread. The send event is represented by a fork vertex, and the receive event by either a simple vertex or a join vertex. If the receiving thread is associated with the same task as the message, then the receive event is represented by a join vertex. The sub-task associated with the message terminates at the join vertex, and the sub-task associated with the receiving thread continues. If the receiving thread is not currently associated with the message's task, then the sub-task associated with the message becomes associated with the receiving thread, and the event is represented by a simple vertex.
Other events may occur between the send and the receive events. Often, a message is received at a node and put into a message queue before being received by the receiving thread. The event of the message being enqueued is then represented by a simple vertex. If the message passes through several nodes, as it would do in a store-and-forward network, then there would be several event vertices recording the progress of the message.
A message may arrive before the receiver tries to receive it, or the receiver may try to receive a message before the message has arrived. Thus, there are 8 combinations to consider: send (blocking or non-blocking), receive (blocking or non-blocking), and whether the message or receiver arrives first. Non-blocking receives are not considered further because typically either (i) if the message has not yet arrived, then the thread that attempted the receive continues and the non-blocking receive is represented by a simple vertex; or (ii) if the message has arrived, then the interaction network fragment to represent this is identical to that for a blocking receive.
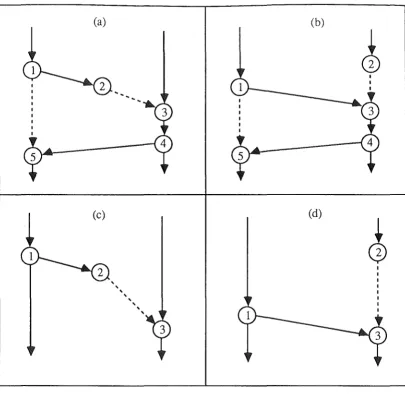
Figure 2 shows the remaining four cases, the message send being represented in each case by vertex v1. In the Figure, (a) and (b) show synchronous message passing, and (c) and (d) asynchronous message passing.
(a) Blocking send, message arrives first. The message is sent at Vt and the sending thread is
blocked. At v2 the message is received by the destination node, but the receiving thread is not ready. The time that the message spends waiting is represented by arc (v2,v3). The receiving thread performs a receive at v3, then sends an unblocking message to the sending thread (arc (v4,v5)), and the sending thread is unblocked at v5.
(b) Blocking send, receiver arrives first. All vertices except v2 represent the same events as in (a) above. The receiving thread performs a blocking receive at v2, and remains blocked (arc (v2,v3)) until the message arrives and is received immediately at v3.
(c) Non-blocking send, message arrives first. The message is sent at Vt and the sending thread
continues. The message arrives at its destination node at v2, but remains queued (arc (v2,v3)) until the receiving thread performs a receive at v3.
(d) Non-blocking send, receiver arrives first. The message is sent at Vt and the sending thread continues. The receiving thread performs a blocking receive at v2, and remains blocked (arc (v2,v3)) until the message arrives and is received at v3.
(a) (b)
(c) (d)
' ' ' ' ' '
' '
(a) Blocking send, message arrives first. (b) Blocking send, receiver arrives first. (c) Non-blocking send, message arrives first. (d) Non-blocking send, receiver arrives first. (Blocking shown by dashed lines.)
Figure 2: Combinations of message arrival and receive order
3.4 An Example
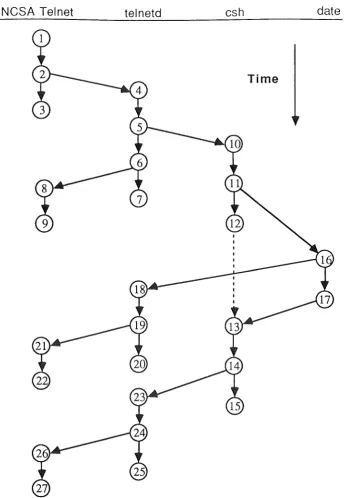
Figure 3 shows the interaction network for a simple interaction, where a user has asked for output of the date. The user is logged in to a Sun host running SunOS, through the NCSA Telnet terminal emulator on a Macintosh. NCSA Telnet communicates with a telnetd process on the Sun, and telnetd passes information between NCSA Telnet and the input and output buffers of a pseudo-terminal. A csh command interpreter process, created when the user logged in, is also associated with the pseudo-terminal, but on the "other" side from telnetd. In the example, the interaction which the network represents has resulted from the user action of inputting a newline. This interaction followed four trivial interactions, from input in succession of: 'd', 'a', 't', 'e'. The interaction network for each of these four is a graph equivalent to vertices v1 to v9 and their connecting arcs in Figure 3.
The interaction involves two nodes and four threads, one on the Macintosh executing in NCSA Telnet, and three on the Sun, each a Unix process (telnetd, csh, and date). The sub-tasks, of
[image:8.597.102.508.72.469.2]NCSA Telnet telnetd csh date
Time
Figure 3: Interaction network for input of newline (Blocking shown by dashed line.)
Sub-task vertices 1,2,3
2,4,5,6,7
6,8,9
5,10,11,12,13,14,15
Function
The newline is received, and sent to telnetd. NCSA Telnet then waits for the next event.
The newline is sent to telnetd, received, and enqueued in the pseudo-terminal input queue. telnetd then echoes the newline, and waits for the next event.
The echoed newline is sent to NCSA Telnet, which prints it in the appropriate window, and then waits for the next event.
The newline is placed in the input queue of the pseudo-terminal. The
csh process reads the command line (which is "date\n"), creates the
[image:9.595.136.481.78.577.2]11, 16, 17, 13
16, 18, 19, 20
19, 21, 22
14, 23, 24, 25
&
24, 26, 27date determines the current date and time, prints them and then terminates, causing a message to be sent to csh infom1ing it that date has terminated.
The date and time output is received by telnetd (via the pseudo-terminal), and then sent to NCSA Telnet. telnetd then waits for the next event.
The date and time is received by NCSA Telnet, which prints the output in the appropriate window, and then waits for the next event. These two sub-tasks cause the csh prompt to be printed, and
work in the same way as the two previous sub-tasks.
Each arc represents either a message-related or a thread-related activity. Vertical arcs (and arc (v11,v 16)) represent thread execution, while non-vertical arcs (except for arc (v1 1,v16)) represent communication. (To achieve consistency, we could use a node v11 a to imply a virtual message
from csh to date, but that would not accurately represent what SunOS does.) 4. THE CRITICAL PA TH
Interaction networks can be used for performance evaluation through identification and analysis of a critical path through each network. Analysis of a critical path requires the ability to measure along the path the times spent in different states, where the state of the critical path at any point is defined in terms of system objects in use, or not in use, at that point of the path.
4.1 The Program Activity Graph
In their work on performance evaluation of parallel programs, Yang and Miller defined the critical path through a program activity graph [28]. While our concept of a graph representation for an interaction network is similar to the idea of a program activity graph, there are several major differences. First, we are interested in following the processing of an interaction, rather than the execution of a program. Execution of a program can involve any number of interactions from zero upwards, while servicing an interaction can require complete or partial execution of many programs from one upwards. Second, our graph is to include processing done outside the processes created specifically to service the interaction; processing done by servers, for example, is not shown in a program activity graph. Third, we want to use interaction networks to evaluate performance for (possibly large) sets of interactions, in order to identify strategies that will give a general
improvement in interactive performance. 4.2 Existence of a Critical Path
For a program activity graph, Yang and Miller defined the critical path as the longest path through the graph, representing "the sequence of program activities that take the longest time to execute" (op
cit). We have a similar purpose in mind when considering a critical path through an interaction network, but approach its definition in the following way.
In an interaction network, the sole source vertex is v0, and time(vJ > time(v0) for i :/:- 0. The graph
has one or more sink vertices. One sink vertex Vr, such that time(vr) > time(vJ for all i :/:- f, shows the last event in the interaction. We define response time RT= time(vr) - time(v0).
Weights are assigned to arcs as follows. First, we declare as B(locked)-arcs those arcs that represent a period during which a sub-task is blocked waiting for some other sub-task in the same task. Barcs are then given weight= 0, and all other arcs (vi,vi) are weighted with time(vi) -time(vJ For an interaction network, we define a critical path to be any path from v0 to vr that contains no B-arcs.
It can be shown that there is at least one path from v0 to Vr that contains no B-arcs. Each B-arc
4.3 Performance Improvement
Clearly, response time for the interaction represented by an interaction network is equal to the sum of the weights on edges encountered when traversing a critical path; we refer to that sum as the
length of the critical path. The problem of improving performance can be presented as needing action to reduce the length of a critical path.
We should consider first whether it will be possible in practice to identify a unique critical path in each interaction network. When traversing the graph from Yr to v0, there are alternative paths only at join vertices. If every join vertex has only one of its two incident arcs not a B-arc, then the critical path is unique. A join vertex with both its incident arcs not B-arcs would represent a case where two sub-tasks became ready to join at exactly the same instant. The probability of this occurring - or at least being measured as occurring - is related to the precision with which time can be recorded. The probability of there being more than one possible path to choose from can be arbitrarily reduced by increasing the precision of the clock.
If it is not possible to identify a unique critical path, we can simply select one of the alternatives at random. Why this is a reasonable strategy can be seen by considering the effect on response times of actions taken to reduce the length of a critical path. Each interaction network will have near-critical paths, a near-critical path being some path that will become the critical path after some tuning action is taken to reduce the length of the original critical path. (Miller et al [ 18] refer to these paths as the second-longest critical path, the third-longest critical path ... ) When clock precision does not permit identification of a unique critical path, the randomly chosen path is either the critical path or a near-critical path.
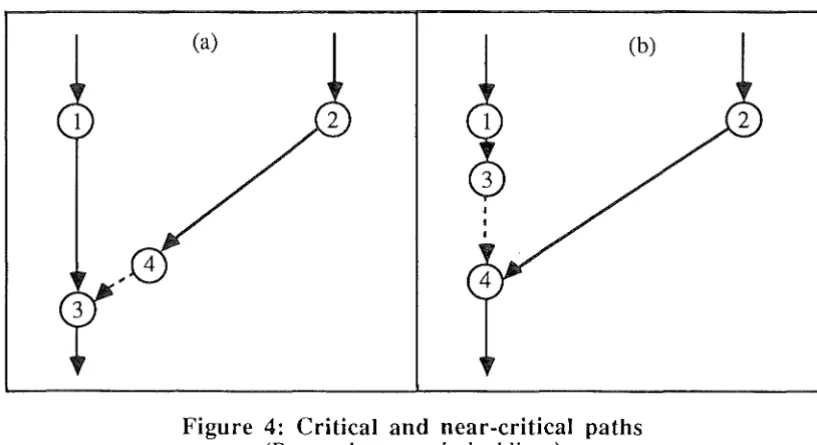
Consider .the example in Figure 4, drawn with the vertical distance being linear in time. Assume that, in (a), the critical path runs through v1 and v3 • Some tuning action is taken that will reduce the
length of arc (vi,v3), as shown in (b). The new interaction network has its critical path through v2
and v 4 • The effect in reducing the time, at least across these few nodes, is very small.
(a) (b)
Figure 4: Critical and near-critical paths (B-arcs shown as dashed lines)
[image:11.598.99.508.425.648.2]4.4 Clock Synchronization
Another assumption needed for practical use of interaction networks is that times assigned to nodes in a network be reasonably accurate and consistent with one another. No problem exists for tightly-coupled systems but a loosely-coupled distributed system, by definition, consists of nodes that do not share a common clock. Clock synchronization is of course a well-known and heavily-researched problem in monitoring of loosely-coupled systems, and several clock synchronization algorithms have been developed. The TEMPO clock synchronization system, for example, is estimated to have a maximum error of 30ms between the clocks of any two nodes for a particular distributed system configuration [12].
An ideal solution
is
available through use of hybrid performance monitors, with each node containing hardware dedicated to event recording. By connecting the clock inputs of all event recorders to a common source, excellent synchronization can be achieved. We therefore assume that, for practical application of our techniques, times can be recorded that are accurate and consistent enough for the purpose for which networks are to be analysed. The practical value of our work will increase as techniques for clock synchronization are improved.5. ANALYSIS OF A CRITICAL PATH
To know what should be done to improve performance, we must be able to measure what
contributes to the length of each critical path. To this end, we have adapted a technique used earlier for analysis of interactive performance for traditional time-sharing systems. In that work, each interaction was assumed to be executed by a single, virtual "interactive process" [21, 22]. Each interactive process was then regarded as spending its time in any of a number of disjoint states, these being determined by the set of resources in use by the interactive process. By measuring the time spent in different states, we could get a decomposition of interactive response times. The idea is adapted to define states of the critical path.
5.1
States of the Critical PathFor a distributed system, interaction Ii is some instance of a <user action, system reaction> pair with, representing the system reaction of each Ii, an interaction network that has at least one critical path CP;, whose length equals response time RTi. The
state of a critical path
is defined in terms of system objects, and events relating to use of those objects. Anobject
is any system component whose use may contribute to response time. The definition allows for (at least) hardware objects, software objects, and data objects. This common treatment of "objects", resources of any type, has a parallel in approaches to protection that are based on definition of an access matrix (see, forexample (25]).
Only two types of object-use event need be defined: begin_use (object) and end_use (object).
Begin_ use
andend _use
are generic terms chosen to describe a wide range of events that are of interest to performance analysts. When the object is a CPU, the begin_use event is the assignment by the scheduler of that CPU to the thread; the end_use event is the end of the time-slice or blocking of the thread. However, an event that would traditionally have been recorded as a page fault can instead be recorded as use in succession of two objects, a page fault queue and a paging device, with two pairs of begin_use/end_use events. If there are several paging devices, each a distinct object, the latter approach is far more informative. Event recording for a software object such as a named procedure would require generation of recording code by the compiler, the begin_use event being part of the calling code and the end_use event part of the return code.Let us assume then that simple vertices are added to each interaction network for begin_use and end_use events for any objects that could be of interest. The instantaneous state of the critical path is determined by those objects that are in use, and those objects not in use, at that point in the critical path. For a model view, we assume that for each critical path CPi there is a corresponding
stateword SWi with one bit ~ corresponding to each object k in the system. At any instant, bk= 1 if objk is in use, and ~
=
0 if objk is not in use. The recording of events is then simple:if begin_use (ob)J then SW [bJ := 1 ;
Clearly, all states Si are disjoint. The total time spent in any state along CPi (and therefore the extent to which any objects contribute to response time for the interaction) can be measured either by a monitor sampling the value of SWi, or by accumulating times between successive events that put CPi into and, later, out of some designated state.
5.2 Composite States
The full set of system objects is very large. (It must be acknowledged also that, in practice, the set of system objects will change dynamically, for example whenever a node is added to a network, a new program is written, or a relation is added to a database.) In practice, a performance analyst is likely to want to declare a set { objects of interest}, and then to be able to measure the contributions to response time made by using these objects, singly or in any combinations. The analyst might for example declare the following sets of objects of interest: { the Ingres DBMS}, {Ingres, the Ingres file server}, { Ingres, the Ingres file server, the file server page fault queue, the file server's paging device(s)} ...
We therefore introduce the notion of a composite state, defined to be the union of all states that show a particular object or objects in use. Suppose that Sc is some such composite state. The total time spent in that state is I, T Sc, with the summation being made along the length of the critical path. Whether or not the critical path is in that composite state at any instant can be determined by the values of one or more designated bits of the stateword.
5.3 Sets of Interactions
So far, we have considered analysis of the critical path solely for a single interaction. In practice, performance for any single interaction may have little significance. More often, we want to know the components of response times for some (possibly large) set of interactions. Performance evaluation is now considered for some set I
=
{Ii} of interactions where I comprises those interactions that (a) occur in some measurement session, and (b) meet some selection criterion. An obvious example of a set of interactions requiring analysis comprises those interactions that use a designated software sub-system (such as the Ingres DBMS); solution of any of the "archetypal" performance problems that we described in the Introduction will require identification of those interactions that use a particular software package. Other sets of interactions of possible interest could be: those interactions using any part of the system (such as a file server) thought to be a bottleneck; or those interactions running on nodes under the control of one systems manager. For all these examples at least, we can determine if some interaction Im is a member of I according to whether or not Im makes use of specifiable system objects.Suppose now that our objective is to search for bottlenecks. That is, for our designated set I of interactions, we want to be able to measure, for all Ii belonging to I, the contribution made to the total of response times through use of some system object or objects thought to constitute a bottleneck. To do that, we want to be able to get, for any definable composite state Sc, the sum across all interactions
Li
Tse, as a proportion of total response time Li RTi.6. DECOMPOSITION OF RESPONSE TIMES
Interaction networks may be recorded for later analysis and, in Section 7, we describe experimental work done to show that interaction networks can be identified and recorded. Consider, however, the possibility that systems might be instrumented to analyse performance on-line, using event recorders designed: to isolate interactions declared to be of interest; to identify, for those
interactions, the critical paths; and to measure, for those critical paths, the times spent in any states (or composite states) of interest.
The particular problem examined now is that of instrumenting a system to allow us to solve what was described in the Introduction as the archetypal performance problem. That is, we want to be able to find out how to get the best performance possible from a large and complex software
package that is used interactively by multiple users, and is one of possibly many software packages that run on any number of nodes within the distributed system.
interactions running on the distributed system, we want to be able first to isolate those interactions of interest, and then find out what contributes to the response times for those interactions. Suppose that set I comprises the interactions Ii that are to be analysed. For those interactions, we want to be able to measure the sum of response times, and the proportions of that total for which critical paths of the interaction networks are in any state or states that the performance analyst cares to specify.
6.1 Selecting Interactions
Whether or not some Im is a member of I will be decided by whether Im, during its execution, makes use of designated system objects. Consider, as an example, that we are interested in users on a sub-set W
=
{Wj!
of the workstations in the system who are running an application that makes use of the Ingres DBMS. Users on workstations Wk not belonging to W may (or may not) be using Ingres; we want to ignore them. Users on any of the workstations Wj may initiate interactions that do not use Ingres; we want to ignore those interactions also.6.2 Designating States
Suppose that the analyst has put forward some hypothesis about the cause of poor performance for this application, for example that there is inadequate IO bandwidth with one or more of the three file servers F1, F2, F3 across which the database is stored. To test that hypothesis, the following measurements are required: the sum of response times for interactions that use the Ingres DBMS and run from any of Wj; of that total time, how much is actually spent within Ingres; of the time within Ingres, what proportion is spent waiting for file service; and, of file service time, how much is spent using each of the separate file servers.
Solving this problem requires measurements for:
(a) The sum of the lengths of critical paths for all interactions that use system objects Ingres and any of Wj,
(b) For those critical paths, the times spent in states: S 1: Using the Ingres DBMS.
S2: Using Ingres and the file management software. S3: Using Ingres, the file management software, and F1. S4: Using Ingres, the file management software, and F2. Ss: Using Ingres, the file management software, and F3.
Each of the S1 to Ss is a composite state; a critical path is in composite state S2, for example, if it is in any state that shows both the objects Ingres and the file manager in use.
6.3 Design of Event Recorders
Traditionally, event recorders have been used in pairs to accumulate times for resource usage. One recorder detects the begin_use of the resource; the other detects the end_use and adds the time between the two events to a system meter. Selective recording of events will be important in a large distributed system; the number of events relevant to any performance study may be smaller by several orders of magnitude than the number of events that occur throughout the system during a performance measurement session. That is, the event recorders should be able to determine: (a) whether the interaction belongs to I.
(b) whether any event is on the critical path of the interaction network and, if so:
(c) whether the event puts the critical path into, or out of, a state that has been declared by the analyst to be of interest for the current measurement run.
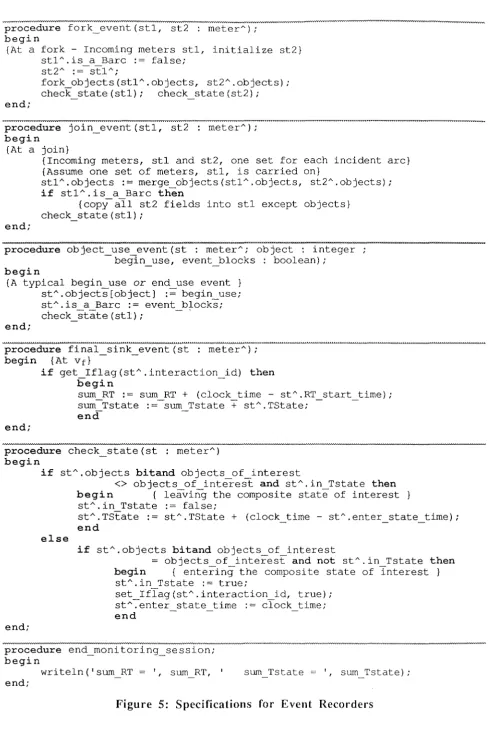
Each event recorder is a largely isolated fragment of code, and we must show that a set of such recorders can be designed to deal generally with questions (a) to (c) above. A solution to that problem is given in Figure 5, with an explanation being as follows:
To determine (a) above: Each recorder can check (in check_state in Figure 5) whether the objects currently in use include all of the objects declared as determining whether Im belongs to I; if this is true, then Im is an element of I. At vr, if simultaneous use of the objects has not occurred anywhere in Im, then Im is not a member of I, and no data is accumulated from that interaction.
To determine (b) above: At each join vertex, the only sub-task meters retained are those associated with the arc that is not a B-arc. Meters for the other sub-task are discarded as they do not belong to the critical path. The only path leading into Vf is a critical path so, unless Im is not a member of I,
times accumulated in meters local to the interaction are added to the global totals at Vf.
To determine (c) above: The recorder, because of the point at which it is written into the software, knows what system object is involved in the event, and can decide whether or not that object has been declared to be of interest.
For simplicity, the solution in Figure 5 deals with only one declared state of interest for the critical path. To allow for measurement of the time in several states, in_Tstate, TState,
enter_state_time, and the global sum_TState can be declared as arrays, with check_state
making a sequence of tests.
{Globals}
con st
nurnber_of_objects
type
var
object status= array [1 .. nurnber_of_objects] of boolean; meter -;:;; record
end;
interaction i d : integer;
in Tstate, Is a Bare : boolean; ob}ects: objec~status;
RT_start_time, TState, enter state time real;
sum RT, sum TState : real;
objects_of_Interest : object_status;
procedure begin_monitoring_run(objs : object_status); begin
{Specify interactions of interest in terms of objects used.} objects of interest := objs;
sum RT -
0;
sum TState := 0;end;
procedure source_event(st meterA);
begin
{At Vo}
stA.interaction id= next id; { call next id to get int id}
set Iflag(stA.interaction-id, false); { Int. not of interest yet }
stA~TState := O;
-end;
stA.is_a_Barc := false;
stA.RT start time := clock time;
stA.in-Tstate := false;
. )
procedure fork_event(stl, st2 : meterA);
begin
{At a fork - Incoming meters stl, initialize st2}
stlA.is a Bare := false;
end;
st2A : = stlA;
fork objects(stlA.objects, st2A.objects);
check_state(stl); check_state(st2);
procedure join_event(stl, st2 meterA);
begin
{At a join}
end;
{Incoming meters, stl and st2, one set for each incident arc} {Assume one set of meters, stl, is carried on}
stlA.objects := merge objects(stlA.objects, st2A.objects);
if stlA.is a Bare then
{copy-all st2 fields into stl except objects} check_state(stl);
procedure object use event(st : meterA; object : integer -begin_use, event_blocks : boolean);
begin
{A typical begin use or end use event}
stA.objects[object) :;;:;;- begin use; stA.is a Bare := event blocks;
check_ state ( stl) ; - .
end;
procedure final sink event(st : meterA);
begin {At vt}
end;
if get Iflag(stA.interaction id) then
begin
-sum RT := -sum RT+ (clock time - stA.RT start time);
sum-Tstate :=-sum Tstate
+
stA.TState;end
procedure check_state(st : meterA)
begin
if stA.objects bitand objects of interest
<> objects of interest and stA.in Tstate then
begin { leaving the composite state of interest
stA.in Tstate := false;
stA.TState .- stA.TState + (clock_time - stA.enter state_time);
end else
if stA.objects bitand objects of interest
= objects of interest and not stA.in Tstate then
begin { entering the composite state of interest }
stA.in Tstate := true;
set_Iflag(stA.interaction_id, true); stA.enter state time .- clock time;
end end;
procedure end_monitoring_session;
begin
writeln('sum_RT = ' , sum_RT, ' sum Tstate sum_Tstate);
end;
[image:16.598.63.554.58.801.2]6.4 Assumptions
The solution in Figure 5 has required a number of assumptions: (i) vo and vr can be identified.
(ii) There exists a unique critical path.
(iii) A set of meters is part of the context of each thread and each message. (iv) The state of all objects in the system can be recorded in a single stateword.
(v) That functions fork objects and merge objects can be written to be aware of the behaviour of each type of object wTth respect to both fork and join events.
(vi) That functions set_Iflag, get_Iflag, and next_id can be written.
Each of these assumptions may hide difficulties for an implementation, but further comment will be limited to (iv) and (v) above, which are of particular interest. Maintenance of a single stateword to encompass all objects is clearly impractical because the full set of system objects is very large and changes dynamically, for example whenever a node is added to a network, a new program is written, or a relation is added to a database. The number of objects of interest for any given evaluation is however likely to be small, so the objects of interest can be specified as a list of object ids. All objects in the system must of course be identifiable under some global naming scheme. With respect to (v) above, consider two examples: the fork event of sending a message, and the fork event of creating a new thread. After the fork event in the first case, the thread sub-task will be using the CPU object and the message sub-task will not. In the second case, a memory object used by the creating thread may be in use by'either or both threads. If many object types and behaviours are to be included, the routines fork_objects and merge_objects (though potentially
implementable) will be large. 7. EXPERIMENTAL WORK
Our principal objective has been to develop a model procedure to assist in designing instrumentation for performance measurement of distributed systems. The ideas described in the paper do however require some practical demonstration, especially to show that it is possible at least to identify
interaction networks. Adding performance tools to existing systems is much more difficult than building them in at design time, but we have instrumented SunOS 4.0, an operating system for Sun computers, to the point where we can record simple interaction networks.
Our aim has been to show that data can be collected to construct interaction networks, rather than to produce a production quality implementation with a low monitoring overhead. In practice, an ideal event recorder may use hybrid techniques. Haban and Wybranietz [13] describe a system in which events are detected and initially processed by a performance processor within each node. Data collected by these processors is transmitted via a dedicated network to a central node, where recording, analysis and display of the data are done. With this hardware, events occurring at very high rates are recorded with very low overhead, and these techniques could be used for the capture of interaction networks. The monitoring approach described in Section 6, which provides a subset of the information available from a set of interaction networks, could be implemented in software and incur acceptable monitoring overhead.
7.1 Event Recorders
(ii) Process forks and joins. Three events are in this category: when a process is created, when a process terminates, and when a process detects termination of another process.
(iii) CPU use. Three events are recorded: a process is put on the CPU run queue, the CPU starts a burst of execution, and the CPU finishes a burst of execution.
(iv) Disc use. Three events are recorded: an IO request is put onto a disc queue, the start of the I/0, and the end of the I/0.
(v) Communication. The most important communication mechanism in Sun OS 4.0, socket communication [6], has been instrumented, and most event recorders are in this group.
In socket communications, there are two communication domains: the Unix domain which provides intra-node communication only, and the internet domain which provides communication using the internet protocols [8]. Both domains have a datagram protocol and a stream protocol which, for the internet domain, are respectively UDP/IP and TCP/IP. Datagram protocols are easy to instrument because the only events to be recorded are send datagram and receive datagram.
Stream protocols are more difficult. Events relating to sub-tasks involved in stream set up and close down must be recorded in addition to data passing events. Also, sub-tasks associated with messages in a stream protocol can merge and split between the message being sent and being received. We have instrumented Unix domain stream communication. While TCP/IP
communication has not been instrumented, the same techniques are applicable. Kernel remote procedure calls, used by NFS for communication [26], are instrumented as part of UDP/IP instrumentation.
Since an .event recorder must identify t_he sub-task for each event, a sub-task number is associated with each process and each message, and is recorded by all event recorders. A sub-task number is a 32 bit integer: 8 bits identify the node on which the sub-task began, and the remaining 24 bits are a sequence number maintained for each node. A new sub-task number is generated for a sub-task when it is created. Additional sub-task numbers are recorded for fork and join events to relate the sub-tasks within a task. Sub-task numbers associated with all processes are maintained in a table, with correspondence between entries in the sub-task table and entries in the SunOS process table. (Recorders built-in to the design of an operating system should have the sub-task number of a process as part of its process table entry.)
Attaching sub-task numbers to messages is difficult because sub-task numbers must be associated with messages both when the message is buffered within a node, and when the message is
transmitted. For Unix domain sockets there is no problem with message passing, as data is moved directly by the kernel from the buffer being sent into the receiving socket's buffers.
In datagram communication, messages are atomic, so each datagram message is associated with a single sub-task. It was found that the sub-task number for a datagram in a socket's buffer could be stored in that part of the buffer reserved for the datagram address. For datagram messages in the internet domain, passed by UDP/IP, we store the sub-task number of the datagram in the IP header as a new option [23].
In stream communication, message boundaries are not preserved, so a stream can contain message data associated with a number of sub-tasks. To record sub-task boundaries for each stream socket buffer, an array of <sub task number, message length> pairs is maintained.
7 .2 Analysis Tools
The following tools for analysis have been implemented:
(i) peifdwnp which, given an event log file, produces a textual description of the data in each event record in the file.
(ii) insplit which, given one or more event log files, identifies all interaction networks recorded in these file(s), and outputs each network to a separate log file.
(iv) toxgrab, which takes a file produced by insplit and produces an "xgrab" file. Xgrab is a browser for directed acyclic graphs which runs under X windows, and displays interaction networks using the layout information in the files produced by toxgrab.
Interaction networks are displayed in a form similar to that of Figure 3. Events within one process are placed in a single column, with time increasing down the page. Toxgrab allows the y
[image:19.597.227.382.272.652.2]coordinate of an event vertex to be displayed either on a linear time scale, or with equal spacing of events with their partial order preserved. The equal spacing option was found necessary because the linear scale display is difficult to understand for those networks where a large number of events occur within a few milliseconds, with others being seconds apart.
Figure 6 shows an interaction network displayed in the equal event spacing format. The diagram was produced by toxgrab from the output of pfilter and insplit, acting on log files recorded as described in Sections 7 .1 and 7 .2. The original interaction network contained 532 vertices. Vertices representing CPU and IO events were omitted, leaving 50 events which are shown in Figure 6. The figure is taken directly from a screen dump of an xgrab window.
Figure 6: Interaction network for newline following 'I' and
's'
Recording additional nodes representing the start of B-arcs is required before a program could determine the critical path through this network. In Figure 6, the critical path is the path containing all of the vertices. Little parallelism can be seen in this example. After starting the ls process the csh process blocks until ls finishes, and on every request to an nfsd process the ls process blocks until the reply is received. Also, after an nfsd process has performed a request, it blocks until another NFS request arrives. The lack of parallelism is in itself an interesting thing to observe.
7.3 Further Work
Further experimental work is planned:
(i) Still to be instrumented in SunOS are: TCP/IP and streams, the latter being a mechanism for passing data through a protocol stack [ 4]. Streams are used in Sun OS to provide terminal line disciplines. Both TCP/IP and streams, and NCSA Telnet, would have to be instrumented before we could record the interaction network illustrated in Figure 3.
(ii) Other tools for analysis are needed. Particularly valuable would be a tool to give values of components of critical paths for both single interactions and sets of interactions. Work done so far has suggested ways in which analysis tools might compensate for poorly synchronized clocks. Some work has also been done on a browser for visual examination of interaction networks.
(iii) We would like to show that our model is applicable to a wide range of objects of interest. We have source code for the Amsterdam Compiler Kit (ACK) [27], and for academic Ingres [9]. A compiler that adds event recorders within the code generated for calls and returns would allow procedures to be objects for which periods of usage can be measured. Modifying academic Ingres to record begin_use and end_use of a relation, would allow usage of each relation to be measured.
8. CONCLUSIONS
We have introduced the concept of an interaction network, a directed acyclic graph intended to represent the processing done by a loosely-coupled distributed system in response to a user action. Behind our idea of an interaction network has been a practical objective: we want guidelines for instrumenting systems to allow measurement and analysis of interactive performance. In our experience, tools for performance evaluation have usually been directed at system performance, or at analysis of individual programs.
While our interaction network is similar to tools developed for analysis of distributed programs, there are fundamental differences. The interaction network is to show all the processing within an interaction, rather than the execution of a single program. Processing done outside the processes created specifically to service the interaction, for example processing done by servers, is shown in an interaction network. Also, we want to use interaction networks to evaluate performance for (possibly large) sets of interactions, in order to identify strategies that will give a general improvement in interactive performance.
We have shown by developing a formal model that it is possible, in principle, to instrument loosely-coupled distributed systems in a way that will give measurements for a general and very detailed decomposition of response times for arbitrarily-designated sets of interactions.
A full implementation along the lines suggested requires first the ability to record interaction networks that will, for each interaction, show the inter-relationships of the sub-tasks that carry out the system reaction for each user action. We have instrumented a version of SunOS to the point where we can record simple interaction networks.
A second requirement is that we be able to identify the critical path through each interaction network. We assume that critical paths will most commonly be found by analysis of recorded interaction networks, but we have shown that event recorders might be installed to identify the critical path during the course of an interaction.
References
1. Abrams, MD. Techniques for evaluating the effectiveness of interactive computing service. Proc 1977 Annual Conj of the Association for Computing Machinery, Seattle, Washington,
1977, pp 452-458.
2. Andrews, GR, and Schneider, F B. Concepts and Notations for Concurrent Programming. ACM Computing Surveys, 15, 1, March 1983, pp 3-43.
3. Ashton, P J and Penny, JP. The Modelling and Performance Analysis of User Interactions with a Distributed System. Tech Report TR-COSC06/90, Dept. of Computer Science, Univ. of Canterbury, 1990.
4. Bach, M J. The Design of the Unix Operating System, Prentice-Hall, Englewood Cliffs, New Jersey, 1986.
5. Bal, HE, Steiner, JG, and Tanenbaum, AS. Programming Languages for Distributed Computing Systems. ACM Computing Surveys, 21, 3, September 1989, pp 261-322. 6. A 4.2BSD Interprocess Communication Primer, in 4.2BSD Unix Software Distribution,
University of California at Berkeley, 1981.
7. Brantley, WC, Brochard, LG, Bolmarcich A, Chang, HY, McAuliffe, KP, and Ngo, TA. Initial Experiences with RP3 Performance Monitoring. International Journal of High Speed Computing, 1, 4, 1989, pp 543-561.
8. Comer, D. lnternetworking with TCP/IP, Prentice-Hall, 1988.
9. Date, CJ. A Guide to INGRES, Addison-Wesley, Reading, Mass., 1987.
10. Ferrari, D. Computer Systems Performance Evaluation, Prentice-Hall, Englewood Cliffs, NJ, 1978.
11. Ferrari, D, Serazzi, G, and Zeigner, A. Measurement and Tuning of Computer Systems, Prentice-Hall, Englewood Cliffs, NJ, 1983.
12. Gusella, R, and Zatti, S. The Accuracy of the Clock Synchronization Achieved by TEMPO in Berkeley UNIX 4.3BSD. IEEE TSE, 15, 7, July 1989, pp 847-853.
13. Haban, D, and Wybranietz, D. A Hybrid Monitor for Behaviour and Performance Analysis of Distributed Systems. IEEE TSE, 16, 2, February 1990, pp 197-211.
14. Hartson, HR, and Hix, D. Human-Computer Interface Development: Concepts and Systems for Its Management. ACM Computing Surveys, 21, 2, March 1989, pp 5-92.
15. Heidelberger, P, and Lavenberg, SS. Computer Performance Evaluation Methodology. IEEE Transactions on Computers, C-33, 12, December 1984, pp 1195-1220.
16. Leffler, SJ, McKusick, MK, Karels, M J, and Quaterman, JS. The Design and Implementation of the 4.3 BSD UNIX Operating System, Addison-Wesley, 1988. 17. Leung, CH C. Quantitative Analysis of Computer Systems, John Wiley & Sons, 1988. 18. Miller, BP, Clark, M, Hollingsworth, J, Kierstead, S, Sek-See Lim, and Torzewski, T.
IPS-2: The Second Generation of a Parallel Program Measurement System. IEEE Trans. on Parallel and Distributed Systems, 1, 2, April 1990, pp 206-217.
19. Nielsen, J. A Virtual protocol model for computer-human interaction. Int. J. Man-Machine Studies, 24, 1986, pp 301-312.
20. Penny, JP, and Ashton, P J. Measurement and description of time-sharing system response. Computer Performance, 5, 3, September 1984, pp 144-152.
21. Penny, J P, Ashton, P J and Wilkinson, A L. Data recording and monitoring for analysis of system response times. The Computer Journal, 29, 5, 1986, pp 396-403.
22. Penny, JP, Ashton, P J and Tripp, D G. Instrumenting Systems to Measure Components of Interactive Response Times. Australian Computer Journal, 20, 2, May 1988, pp 79-84. 23. Postel, J. Internet Protocol, RFC 791, SRI Network Information Centre, Menlo Park,
California, September 1981.
24. Shneiderman, B. Response Time and Display Rate in Human Performance with Computers. ACM Computing Surveys, 16, 3, September 1984, pp 265-285.
--·-~
··'
26. Sun Network File System (NFS) Reference Manual, Sun Microsystems, Mountain View, California, 1987.
27. Tanenbaum, AS, van Staveren, H, and Stevenson, J W. A practical toolkit for making portable compilers. Communications of the ACM, 26, 9, 1983, pp 654-660.
28. Yang, C-Q, and Miller, BP. Performance Measurement for Parallel and Distributed Programs: A Structured and Automatic Approach.
IEEE TSE,
15, 12, December 1989, pp1615-1629.
29. Young, MW, Tevanian, A, Rashid, R, Golub, DB, Eppinger, J, Chew, J, Bolosky, W, Black, D L, and Baron, RV. The Duality of Memory and Communication in the