Implementation of Agile-Scrum Methodologies and
Quality Measurement Procedures used for Finance
Projects in Software Industries
Sanjay P1, Sreenivasa T. N2 1, 2
Dept. of Mechanical Engineering, AMC Engineering College Bangalore- 560076
Abstract: Agile is a software development methodology based on iterative and incremental development, where the requirements and solutions evolve through collaboration between self-organizing, cross functional /self-motivated teams. It promotes adaptive planning, evolutionary development where changes are accepted and adopted. In agile development methodology, delivery is done in time-boxed iterative called sprints approach, encourages changes and adopts flexibility and response to change even later in the development where changes can be addressed easily.
Scrum is one of the methods of Agile Software Development methodologies. It is a framework for developing and sustaining complex products. It is a framework within which people can address complex adaptive problems, while productively and creatively delivering products of highest possible value. Scrum employs an iterative, incremental approach to optimize predictability and control risk. It is most popular agile framework, which concentrates particularly on how to manage tasks within a team-based development environment.
In the present investigation, an attempt was made to implement Agile/Scrum methodologies for finance projects adopted in software industries using Agile Jira tool. Once sprints are completed, various Quality Metrics were measured and compared with industry specific standards to make sure that measured metric values are within range/limits. Later Quality was improved over a period of time (sprint by sprint) to achieve high maturity in the organization.
Keywords: Agile, Scrum, Jira, Quality Metrics, Sprint, High Maturity
I. INTRODUCTION
A. Agile Development Methodology And Objectives
The main objectives of Agile Scrum framework is toallow cross-functional teams of around 4 to 10 members to regularly deliver
potentially shippable incrementsof a working product or service in increments of time called sprints and able to deliver customer value sustainably, with the required quality and in a changing environment.
The fundamental objectives of agile software development teams are
1) Adaptive planning - changes are welcome
2) Rapid and flexible response - to accommodate change in the requirements
3) Evolutionary development - adoption to changes
4) Early delivery - using sprints [1,2,3]
Agile development methodology provides opportunities to assess the direction of a project throughout product development lifecycle. This is achieved through regular cadences of work, known as sprints or iterations, at the end of which teams must present a potentially shippable product increment. By focusing on repetition of abbreviated work cycles as well as the functional product they yield, agile methodology is described as “iterative” and “incremental [4]
B. Agile Benefits And Advantages
1) Changes can be handled easily: Ability to manage changing priorities. Becoming responsive by embracing changes in every iteration
2) More customer involvement and customer centric (with Product owner and Business Analysts)
3) More customer satisfaction.
6) Simple process (not much documentation as compared to CMMI L3/L5 processes). 7) Improved project/product visibility and quality.
8) Increased productivity (as team work collaboratively)
9) Avoid significant rework by only doing just-in time detailed design.
10) Decrease project risk by always producing working software.
11) Higher quality of product – Adopt Test Driven Development (TDD) techniques
12) Raise quality by moving testing forward in the process
C. Scrum Methodology
Scrum is the most popular way of introducing Agility in the project due to its simplicity and flexibility. Scrum emphasizes empirical feedback, team self-management, and striving to build properly tested product increments within short iterations. Scrum is a framework for project management that emphasizes teamwork, accountability and iterative progress toward a well-defined goal. The framework begins with a simple premise: start with what can be seen or known. After that, track the progress and tweak as necessary. The three pillars of Scrum are transparency, inspection and adaptation [5].
Scrum is relatively simple to implement and focuses on quick and frequent deliveries. Scrum uses iterative and incremental development model, with shorter duration of iterations of 2-4 weeks of duration.
Scrum is a process framework for software development which defines certain rules, events, and roles to bring in regularity to deliver the products. Scrum relies on a self-organizing, cross-functional team. The scrum team is self-organizing in that there is no overall team leader who decides which person will do which task or how a problem will be solved. Those are issues that are decided by the team as a whole. [4]
II. OBJECTIVE, APPROACH FOLLOWED AND DATA USED FOR THE ANALYSIS
A. Objectives
1) Implement agile/scrum development methodology for finance projects used in software industries.
2) Once a sprint is completed, capture the quality metrics such as number of stories delivered v/s planned, sprint velocity, coding delivery rate, productivity and defect density (internal testing and UAT/demo findings).
3) Determine whether metrics captured are within industry standard limits.
4) If metrics captured are not within the range, take corrective actions using Casual Analysis and Resolution (CAR) technique (as per Project Management techniques)
5) By implementing agile/scrum methodology, make sure that demos are provided at the end of the sprint to the customer regularly. Deliver the planned stories within the sprint and to complete planned phases for final delivery of the application.
B. Approach followed
1) Get requirements (stories) from the customer and analyze/brain storm them.
2) Add requirements to Product Backlog based on priority set by the customer. This should be in the form of Epics. Get the sign
off from the customer for the requirements.
3) Breakdown epics in to smaller stories in such a way that each modules can be delivered at the end of the sprint. Based on complexity of the stories and available resource capacity, plan for number of sprints and phases.
4) Before sprint starts, conduct story grooming sessions to understand the requirements in detail and to determine velocity of the stories.
5) Start the sprint. During sprint planning meeting, break down stories to lower level tasks. Carry out effort estimation and plan for the number of stories/tasks that can be implemented in current sprint based on team capacity. Publish the goals for the sprint to set the expectation for the team to deliver stories within sprint,
6) Monitor progress of the sprint, conduct daily scrum meetings, retrospective meetings followed by sprint review meeting and finally providing demo to the customer at end of sprint.
7) Once a particular sprint is completed based on Definition of Done (DOD), measure the following quality metrics of the project a) Planned v/s Delivered stories (% of stories delivered at the end of the sprint)
b) Velocity of the sprint
c) Burn down chart (effort burndown)
e) Story delivery rate (number of hours taken/story point)
f) Defect density (number of weighted defects/story point) – Internal testing g) Defect density - for customer reported defects
8) Determine whether these metrics captured are within the range defined as per industry defined limits.
9) If metrics captured are not within the range, take corrective action - perform Casual Analysis and Resolution as per industry
standards.
10) Once corrective actions are taken, aim towards achieving high maturity in the organization.
III. DATA USED IN AGILE/SCRUM DEVELOPMENT PROJECT – FINANCE PROJECT
A. Data consideration for Quality Metrics
The following details need to be considered pertaining to a specific Sprint
1) Number of user stories
2) Total Story points
3) Capacity of the team (total hours available for a particular sprint for current scrum team)
4) Velocity of sprint
5) Effort considered for sprint
IV. DATA INPUT PROVIDED
A. Sprint Planning Data
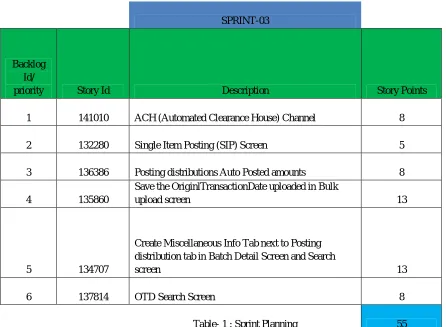
Table -1 provides input provided sprint planning for Sprint-3. Total of 6 stories were considered based on team capacity. Story point size was calculated for each of the story based on complexity to determine the velocity of the sprint.
SPRINT-03
Backlog Id/
priority Story Id Description Story Points
1 141010 ACH (Automated Clearance House) Channel 8
2 132280 Single Item Posting (SIP) Screen 5
3 136386 Posting distributions Auto Posted amounts 8
4 135860
Save the OriginlTransactionDate uploaded in Bulk
upload screen 13
5 134707
Create Miscellaneous Info Tab next to Posting distribution tab in Batch Detail Screen and Search
screen 13
[image:3.612.85.531.359.686.2]6 137814 OTD Search Screen 8
Table- 1 : Sprint Planning 55
Table 2: Sprint backlog for Sprint-03 (one story representation)
V. RESULTS
A. Determination of Metrics for the Sprint
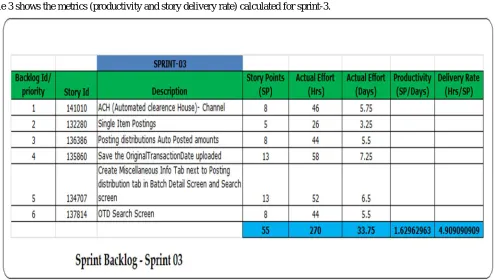
Table 3 shows the metrics (productivity and story delivery rate) calculated for sprint-3.
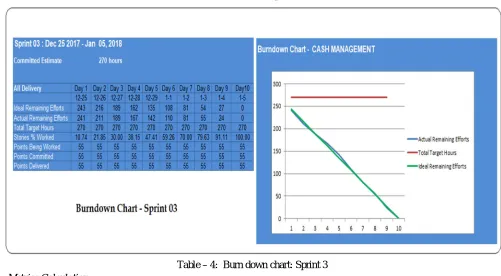
[image:4.612.58.553.430.710.2]The effort Burn Down chart was represented in the table: 4
Table – 4: Burn down chart: Sprint 3 B. Metrics Calculation
1) Story delivery rate: This is calculated based on number of stories delivered v/s number of stories planned for sprint-3. In the above example, 6 stories were planned and all were delivered.
So story delivery rate = (6/6)* 100 = 100%
2) Productivity – This is calculated based on the fact how many story points were delivered within a day = Total Story point/effort in days : 55/33.75 = 1.63
3) Coding delivery rate: It is calculated as number of person hours required to deliver a story point = 270/55 = 4.9
These metrics were represented in the table: 5
Table : 5 Metrics captured for story delivery rate, productivity and coding delivery rate
4) Defect density – Internal testing (Functional testing by Testers)
It is calculated as defect weight/story points = (number of critical defects*3 + number of major defects * 2 + number of minor defects * 1)/total story points
Defect Density = [ (0*3)+(0*2)+(1*5)]/55 = 0.0909
5) Defect density – customer reported defects during UAT
It is calculated as defect weight/story points = (number of Severe defects*3 + number of major defects * 2 + number of minor defects * 1)/total story points
Defect Density = [ (0*3)+(0*2)+(1*2)]/55 = 0.0363 The defect density table is shown in the table: 6
[image:5.612.79.538.493.570.2]Table 6: Metrics for QA and Customer reported defects (Sprint-3)
[image:6.612.55.537.235.460.2]C. Representation of Stories in Agile Jira tool
Table-7: Agile Jira tool showing story and respective story points
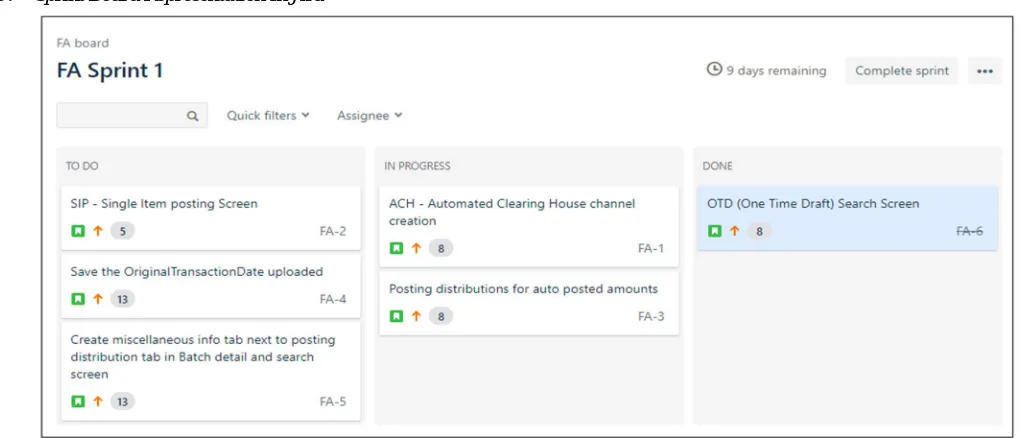
D. Sprint Board Representation In Jira
[image:6.612.44.554.498.717.2]VI. CONCLUSION
After determining metrics for sprint -3 (Story delivery rate, Productivity, coding delivery rate, QA defect density, customer reported defect density and velocity of the sprint), compare obtained values of sprint-3 with the industry defined standards as mentioned the table: 9
Sl No Quality Metrics Lower Limit
Standard (%)
Upper Limit Standard
(%)
Value Obtained (Sprint 03)
Within industry std
Limit
1 Story delivery Rate 90 100 100 YES
2 Velocity of sprint 45 55 55 YES
3 Productivity 0.55 1.21 1.63 YES
4 Code delivery rate 0.57 10.56 4.9 YES
5 QA Defect Density 0 0.89 0.09 YES
6 Customer reported Defect
Density
0 0.11 0.03 YES
Table: 9 Comparing the sprint-3 metrics with industry defined standards
As represented in table-9, metrics values obtained for sprint-3 are within the industry standard limits. So it is not required to perform any Casual Analysis and Resolution (CAR) in this case. If the metrics values are outside the industry standard set limits, then corrective actions should be taken using CAR to bring the values within range and metrics need to be improved to achieve higher level of maturity.
The final conclusion is, the metrics values obtained for sprint-3 are within the industry standards set limits and the Quality of the application is found good. So taking any corrective action (CAR) at this stage is not necessary. This shows the product (finance application) was delivered with high quality on time, within the sprint. Similar metrics captured during the total length of the phase for the entire project.
REFERENCES
[1] www.scrum.org [2] https://www.cprime.com/
[3] https://en.wikipedia.org/wiki/Agile_software_development [4] http://www.mountaingoatsoftware.com/agile/scrum