759
©IJRASET: All Rights are Reserved
Integration of Smart Grids and PV System Total
Harmonics Distortion (THD) Reduction
Pitta Sankararao1, Minukuri Ranjith2, Ravikiran Jaddu3
1, 2, 3
Mallareddy College of Engineering for Women, India
Abstract: This paper deals with renewable energy systems in modern smart grids have growth in many countries, and with that increase the quality of power becomes a major concern for power system operators, especially at the load side. Among the most important power quality challenges, the harmonics comes on top, as they affect the voltage and current quality at the point of common coupling (PCC), and negatively affects the loads. One of the most used renewable generators is the solar photovoltaic (PV) systems, where it is connected into the low voltage distribution grid using power electronics inverters, and with the increased penetration level, massive harmonic current is injected into the network. There is a need to reduced the resulting harmonics distortion and highlight its possible constraints. The simulation is performed with increasing the connected PV modules, and the results are analyzed showing high level of THD with the increased PV penetration at the PCC considering a higher loading level of the distribution transformer.
Index Terms: Inverter, Harmonic distortion, Smart distribution grid, PV systems.
I. INTRODUCTION
Electricity utilities throughout the world are responding to the increased integration of renewable energy into the national grid. The planning of the integration of renewable energy needs to be conducted and well understood by the electricity utilities. There are many challenges that are caused by the poor PQ such as overheating of the transmission lines and transformers, inaccurate metering reduction of equipment efficiency [1]. The integration of renewable energy has the negative effects on the total harmonic distortion at the point of Common Coupling (PCC) / Point of Connection (POC).
The power systems were not designed to accommodate the renewable energy; therefore, this is causing some challenges to the power systems that can no longer be ignored The methodology of the power quality used to be measured has changed and most measuring equipment can no longer be used.
It is a known challenge of the higher total harmonic distortion at the PCC for both utilities and customers [3]. It is a costly exercise for both parties as internal document needs to change to accommodate the new phenomena, training of the manpower to conduct the measurement, purchasing of new measuring equipment and adapting to the new challenges involved.
In the new era the smart grid plays an important role as the network is automated and monitored using the modern IT/communication/ control technology [4]. Those electronic automated equipment has negative effects on the power quality. The introduction of smart grids has a potential to cause excessive voltage and/or current distortion [4]. The management of electricity utilities worldwide has to be ready to invest when implementation of smart grids taking place as most of the existing technology won’t be compatible with the new system.
A. Total Harmonic Distortion
The total harmonic distortion needs to be monitored closely and compared to the applicable standard [4]. During application of new customer(s) the system planners has to conduct a harmonic study to ensure the possibility of connection at the PCC.
The total harmonic distortion (THD) is a measure of the effective value of the harmonic components of a distorted waveform. It can be calculated for either voltage or current distortion as follows [5].
The formulae to calculate the total harmonic distortion of current and voltage;
%VTHD=
Vh2 100% (1)
h 2 %ITHD=
I h2 100% (2)
760
©IJRASET: All Rights are Reserved
B. Case Studies
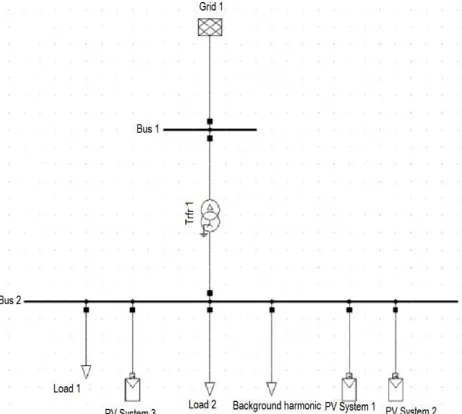
The study was conducted on the 66kV distribution network as shown in Fig. 1.
[image:2.612.187.418.107.314.2]
[image:2.612.212.401.353.450.2]
Fig. 1: Single - Line Diagram of a distribution network.
Table I: Transformer data
Element Voltage (kV) MVA Connection
Trfr 1 66/33 10 DYN11
The PV systems are non-linear load as it injects harmonics into the distribution network. The measured harmonic spectrum of the Solar PV is used. The PV system data are:
Table II: PV System data
PV System 1 5 MW
PV System 2 5 MW
PV System 3 2.5 MW
[image:2.612.208.402.585.713.2]Four case studies were conducted as summarized on Table III
Table III: Case studies conducted
Case study 1 No Solar PV
Case study 2
One 5MW solar PV
Case study 3 Two solar PV
761
©IJRASET: All Rights are Reserved
II. SIMULATION RESULTS AND ANALYSIS
[image:3.612.189.425.129.228.2]The results for the four case studies are as follows;
Table IV: comparison of the four case studies
Case studies Trfr VHD at VTHD ITHD at
Loading in PCC in at PCC Trfr in
% % in % %
Case study 1 56% 1.2% 3.9% 7.2%
Case study 2 16% 1.5% 4.4% 29.6%
Case study 3 51% 1.8% 4.9% 10.9%
Case study 4 76% 2.1% 5.5% 8.4%
The voltage harmonic distortion and voltage total harmonic distortion at the PCC is increasing with 0.3% and 0.5% respectively with the increase of integration of the solar PV systems.
No solar PV connected at the PCC, the transformer loading was 56%, with the first Solar PV installation, the transformer loading was reduced to 16% due to that the Solar PV is a renewable source of energy. The second and third solar PV systems cause the increase of transformer loading. The first solar PV system also caused higher total harmonic distortion to the transformer which can cause the heating and insulation level to deterioration.
According to the standard [6] poses the following limits on transformers operating in a harmonic environment:
1) Current total harmonic distortion should not exceed 5%.
2) Steady state rms voltage should not exceed 110% of rated at no-load and 105% of rated at rated load which means the voltage
total harmonic distortion
Should not exceed. Therefore, Trfr 1 as shown in Fig. 2 in all condition of case studies the %ITHD is exceeding the limit stated in [7]. The background harmonic is contributing to the %ITHD; thus excessive investigation need to be conducted on this transformer to have it under the limit.
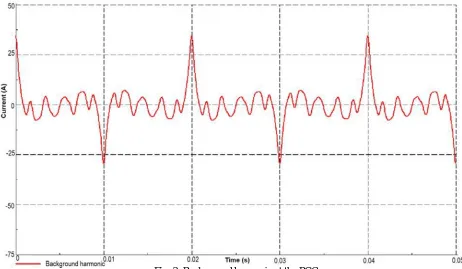
In case study 1 the harmonic distortion shown in Figures 4 - 6 is due to the background harmonic. The background harmonic is generated from the other side of the national network, this can no longer be ignored it need to be monitored and managed well.
[image:3.612.70.532.450.719.2]
762
©IJRASET: All Rights are Reserved
The background harmonic did not change for all case studies.
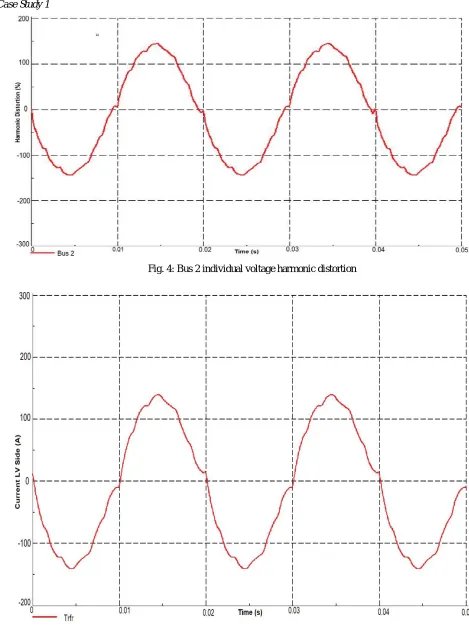
[image:4.612.54.523.92.725.2] [image:4.612.52.522.98.356.2]a)Case Study 1
Fig. 4: Bus 2 individual voltage harmonic distortion
763
[image:5.612.69.532.77.381.2]©IJRASET: All Rights are Reserved
Fig. 6: Bus 2 Voltage total harmonic distortion
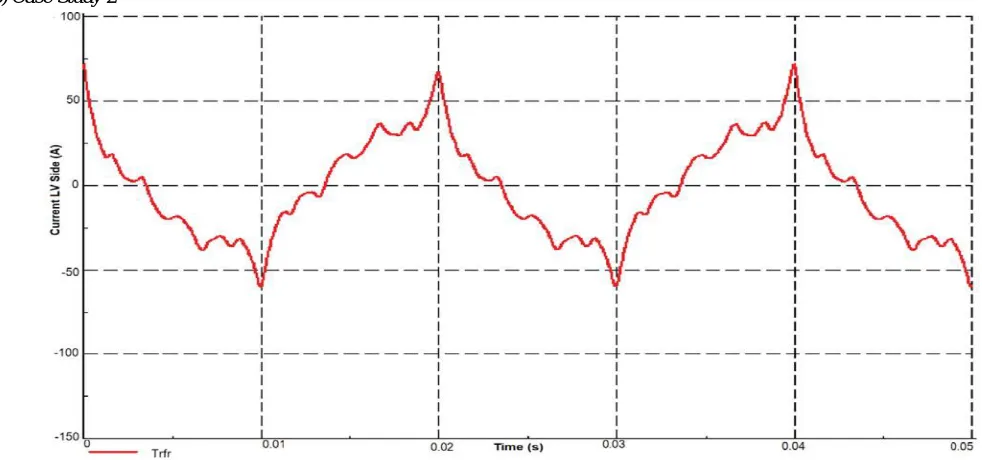
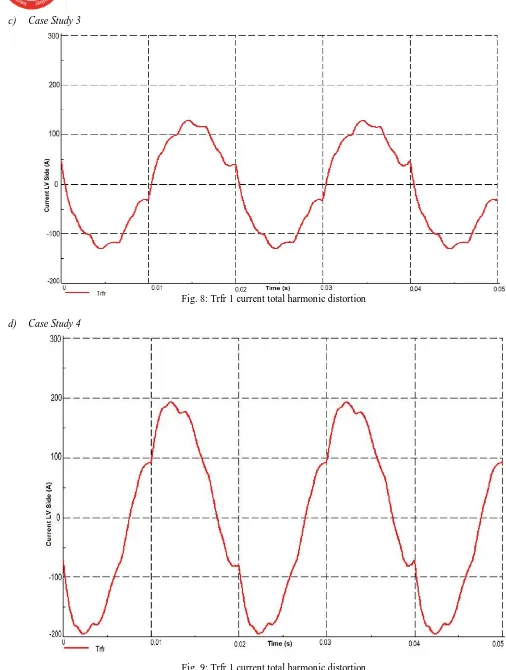
The waveform of individual voltage distortion and total voltage distortion is similar for all case studies as it only increases by 0.3 % and 0.5% respectively. Therefore, the waveform is only included for case study 1. The current total harmonic distortion for the transformers, the waveform is completely different as it increases drastically in other case studies but mainly for case study 2. Thus, the waveforms are included for all four case studies in this paper.
b)Case Study 2
[image:5.612.45.536.479.709.2]764
©IJRASET: All Rights are Reserved
[image:6.612.32.538.62.732.2]c) Case Study 3
Fig. 8: Trfr 1 current total harmonic distortion
[image:6.612.70.542.390.715.2]d) Case Study 4
765
[image:7.612.74.543.83.348.2]©IJRASET: All Rights are Reserved
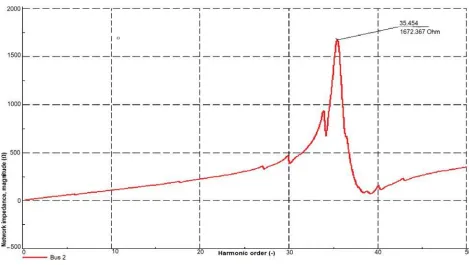
Fig. 10: Bus 2 Frequency sweep
The frequency sweep (Zs can) was done to determine the resonant point at the injection bus, Bus 2. Fig. 10 shows the Zs can at Bus 2 where the Solar PV systems are connected and resonance occurs at the 35.45 Hz frequency, having an impedance value of 1672.387 Ω. Resonance often causes the total harmonic voltage and current distortion level at the PCC to rise and may even exceed recommended limits provided by international standards [4].
Individual voltage distortion at the PCC for all the case studies is within the limit.
The voltage total harmonic distortion for case study 4 it exceeds the limit with a 0.5%. Therefore, to mitigate the VTHD in case 4 the harmonic filter needs to be designed [8].
III. ARTIFICIAL NEURAL NETWORK
ANN is nonlinear model that is easy to use and Understand compared to statistical methods. ANN is non-parametric model while most of statistical methods are parametric model that need higher background of statistic. ANN with Back propagation (BP) learning algorithm is widely used in solving various classifications and forecasting problems. Even though BP convergence is slow but it is guaranteed. However, ANN is black box
Learning approach [7], cannot interpret relationship between input and output and cannot deal with uncertainties. To overcome this several approaches have been combined with ANN such as feature selection and etc.
766
©IJRASET: All Rights are Reserved
Neural network as a black-box featuring the nonlinear relationship between the multivariate input variables and multi-varieties responses Neural networks (also referred to as connectionist systems) are a computational approach, which is based on a large collection of neural units (AKA artificial neurons), loosely modeling the way a biological brain solves problems with large clusters of biological neurons Connected by axons. Each neural unit is connected with many others, and links can be enforcing or inhibitory in their effect on the activation state of connected neural units. Each individual neural unit may have a summation function which combines the values of all its inputs together.
An artificial neural network is an interconnected Group of nodes.
The goal of the neural network is to solve problems in the same way that the human brain would, although several neural networks are more abstract. Modern neural network projects typically work with a few thousand to a few million neural units and millions of connections, which is still several orders of magnitude less complex than the human brain and closer to the computing power of a worm
A. Applications
1) Multi level inverters are applied to transmission & distribution systems.
2) Multi level inverters are applied to STATCOM to improve stability.
IV. CONCLUSIONS
The harmonic distortion challenges within the smart grids can no longer be ignored by utilities and customers. There are international standards that guide the limit of individual and total harmonic distortion of current and voltage. The background harmonic needs to be monitored and managed well by utilities as it has effect to the current total harmonic distortion of the transformers. The effects of integration of renewable energy sources such as Solar PV systems were analyzed and it was found that the more solar PV plant connected at the PCC, the more %VHD and %VTHD. To mitigate the THD the harmonic filter has to be designed in future.
REFERENCES
[1] IEEE Std C57.12.00 – 2015. IEEE Standard for General Requirements for Liquid Immersed Distribution, Power, and Regulating Transformers. IEEE. 2016.
[2] H. Farooq, C. Zhou and M. E. Farrag. (2012, Jun.). Analyzing the harmonic distortion in a distribution system caused by the non-linear residential loads. International Journal of Smart Grid and Clean Energy. pp. 46 – 51.
[3] S. A. A. Kazmi, M. K. Shahzad, A. Z. Khan and D. R. Shin. (2017) Smart distribution networks: A review of modern distribution concepts from a planning
perspective. Energies. 10. pp. 1-47.
[4] S. Sakar, M. E. Balci, S. H. E. A. Aleem and A. F. Zobaa. “Hosting capacity assessment and improvement for photovoltaic-based distributed generation in
distorted distribution networks”. IEEE 16th International Conference on Environment and Electrical Engineering (EEEIC), 2016. pp 1-6.
[5] I. Etier, M. H. Abderrazzaq, A. A. Tarabsheh, O. A. Saraereh, M.Albdour.(2016, Dec.). The impact of large scale photovoltaic systems on the harmonic increase in distribution networks. Jordan Journal of Mechanical and Industrial Engineering (JJMIE). 10(4). pp. 239 -244.
[6] G. M. S. Azevedo, M. C. Cavalcanti, F. A. S. Neves, L. R. Limongi, and K. C. Oliveira, “Grid connected photovoltaic topologies with current harmonic compensation”, IEEE Industrial Electronics (ISIE) Symposium, 2010, pp. 2394-2399.
[7] R. Pinto, S. Mariano, M. do Rosário Calado and J. F. de Souza. “Impact of rural grid-connected photovoltaic generation systems on power quality”, Energies
2016, 739; doi:10.3390/en9090739
[8] V. Barbu, G. ChiccO, F. Corona, N. Golovanov, and F.Spertino, “Impact of photovoltaic plant connected to the mv network on the harmonic distortion: an
767
©IJRASET: All Rights are Reserved
PITTA SANKARA RAO. He received M.TECH (EEE, POWER SYSTEMS) degree from JNTU KAKINADA, ANDHRA
PRADESH, India, in 2015 and currently working as an Assistant Professor at “MALLAREDDY COLLEGE OF
ENGINEERING FOR WOMEN”, Maisammaguda, gundlapocham pally, Medchal Malkajgiri district, Telangana, India. Email id: [email protected].
MINUKURI RANJITH. He Received M.TECH(EEE, POWER ELECTRONICS) degree from JNTU HYDERABAD, TELANGANA, India, in 2014 and currently working as an Assistant Professor at “MALLAREDDY COLLEGE OF ENGINEERING FOR WOMEN”, Maisammaguda, gundlapocham pally, Medchal Malkajgiri district, India. email id: