Optimization of Risk in Building Construction
Project
Manoj Sharma
1, Dr. A. S. Trivedi
2, Shivendra Singh Yadav
31Associate. Professor, Civil IPS CTM Gwalior, RGPV University Bhopal (M.P) / India 2Professor, Civil IPS CTM Gwalior, RGPV University Bhopal (M.P) / India
3Research Scholar, M. Tech Civil IPS CTM Gwalior, RGPV University Bhopal (M.P) / India
Abstract: Risks have important impact on construction comes in terms of its primary objectives. Construction comes that area unit tangled in nature, uncertainty and risks within the same will develop from totally different sources. The record of the construction industry is not acceptable in terms of coping up with risks in projects. Risk management is a process which consists of identification of risks, assessment with qualitatively and quantitatively, response with a suitable method for handling risks, and then controls the risks by monitoring. The aim of the this paper is to spot and appraise current risks and uncertainties within the industry through in depth literature survey and aims to create a basis for future studies for development of a risk management framework to be adopted by prospective investors, developers and contractors.
Keywords: Construction industry; Construction site; Risk management; Risk management techniques, Spearman rank correlation. Relative index method.
I. INTRODUCTION
A variety of unexpected events may occur in construction projects and many of them can cause losses to the parties involved. Such uncertain events or set of circumstances that have an effect on achievement of one or more of project’s objectives, are commonly called risks. The most of civil engineering work is performed under contract. A contract provides a “self-contained statement of obligations as between its own parties”. The analysis has also identified several factors responsible for time and cost overruns some within the control of the enterprises and some beyond their control. The contracts are vital to the success of a project is important difficult, costly and lengthy proceedings. The contract documents are often used as a tool to manage risk by allocating risks to the varied agencies through the varied contracts between them. It is very important for all the agencies that they are aware at all times of the extent of risk exposure or the risks that they have to manage. If this awareness is lacking then it may lead to a number of disputes, disagreements and disruptions. One of the main reasons of disagreement Associate in nursing conflict is insufficient and defective contract documentation and conjointly inappropriate contract arrangements and an unreasonable burden of risk being allotted to one of the parties by the contract.
II. BACKGROUND
Risks have important impact on construction comes in terms of its primary objectives. Construction comes that area unit knotty in nature, uncertainty and risks within the same will develop from completely different sources. The record of the construction industry is not acceptable in terms of coping up with risks in projects. Risk management is a process which consists of identification of risks, assessment with qualitatively and quantitatively, response with a suitable method for handling risks, and then controls the risks by monitoring.
The aim of the this paper is to spot and judge current risks and uncertainties within the housing industry through in depth literature survey and aims to create a basis for future studies for development of a risk management framework to be adopted by prospective investors, developers and contractors. Risks have vital impact on construction comes in terms of its primary objectives. Construction comes that square measure tortuous in nature, uncertainty and risks within the same will develop from totally different sources. The record of the construction industry is not acceptable in terms of coping up with risks in projects. Risk management is a process which consists of identification of risks, assessment with qualitatively and quantitatively, response with a suitable method for handling risks, and then controls the risks by monitoring.
Risk factors for this study are classified into eight categories namely.
A. Client risk
B. Contractor risk
C. Shared risk
D. Undecided risk
III. RESEARCH METHODOLOGY
For this research, a questionnaire survey method has been adopted to find the impact of critical factors that leads to delay on resource related in the Indian construction sector drawing from various international researchers mentioned above in particular (Sambasivan and Soon 2007). A questionnaire survey was conducted of construction professionals representing various stakeholders involved in construction projects in India.
A. Questionnaire Design
The questionnaire was designed based on critical factors were identified that contributed to the causes of delays. A questionnaire survey was developed to assess the perceptions of various construction professional of the relative importance of causes and the effects of construction delays. The questionnaire was designed into two sections: Section A; section B. Section A is to obtain the requested background information about the respondents. Section B is to obtain the information on factors that contribute to the causes of delays in construction projects from the perspective of construction professionals. A total twenty eight resource related factors were identified under three broad categories namely manpower related, material related and equipment related issues. The critical factors are listed in Table 1. A five point Likert scale (1 very low, 2 low, 3 moderate, 4 high, 5 very high) was adopted where respondents were asked to rank the importance and impact of a particular factors on delay in one of their selected projects. Descriptive statistics techniques namely Relative Importance Index (RII) has been used to highlight the relative importance of critical factors as perceived by the respondents (Assaf et. al, 1995; Faridi and El-Sayegh, 2006; Iyer and Jha, 2005; Kumaraswamy and Chan, 1998).
B. Data Analysis
The data analysis will be done by relative importance index technique used to determine the relative importance of the various cause of factors. The same method is going to be adopted in this study. The five-point scale ranged from 1(very low important) to 5 (very high important) will be adopted and will be transformed to relative importance indices (RII) for each factors as follows:
RII= ∑ W⁄ A*N
Where, W is the weighting given to each factor by the respondents (ranging from 1 to 5), A is the highest weight (i.e. 5 in this case), and N is the total number of respondents. The RII value had a range from 0 to 4 (0 not inclusive), higher the value of the RII, more important was the causes of delays. The RII was used to rank the different uncertainty factors that cause delay. These ranking made it possible to cross-compare the relative importance of the uncertainty factors as perceived by the respondents.
Tables 1: Numerical conversion for the rating attributes
α , β
Ratting Attributes Numerical Conversion
0 0.0
1 0.2
2 0.4
3 0.6
4 0.8
5 1.0
IV. RESULT AND DISCUSSION
A. Analysis of Data
Total twenty respondents have filled up the questionnaire. Subsequently for analysis of responses following steps are followed:
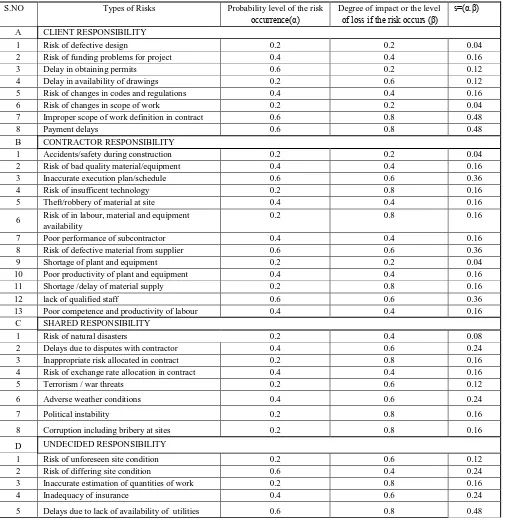
1) Responses were converted into numerical values based on their rating attributes. A sample is shown in Table
2) After that mean of numerical values of all twenty eight responses is determined
3) Then, Standard deviation and coefficient of variation for each risk factor is determined
[image:3.595.48.554.224.745.2]4) Afterwards, Index Score for each risk is calculated by using RI Method.
Table 2: Conversion of response into numerical values (Questionnaire 1)
S.NO Types of Risks Probability level of the risk
occurrence(α)
Degree of impact or the level
of loss if the risk occurs (β)
s=(α.β)
A CLIENT RESPONSIBILITY
1 Risk of defective design 0.2 0.2 0.04
2 Risk of funding problems for project 0.4 0.4 0.16
3 Delay in obtaining permits 0.6 0.2 0.12
4 Delay in availability of drawings 0.2 0.6 0.12 5 Risk of changes in codes and regulations 0.4 0.4 0.16 6 Risk of changes in scope of work 0.2 0.2 0.04 7 Improper scope of work definition in contract 0.6 0.8 0.48
8 Payment delays 0.6 0.8 0.48
B CONTRACTOR RESPONSIBILITY
1 Accidents/safety during construction 0.2 0.2 0.04 2 Risk of bad quality material/equipment 0.4 0.4 0.16 3 Inaccurate execution plan/schedule 0.6 0.6 0.36 4 Risk of insufficent technology 0.2 0.8 0.16 5 Theft/robbery of material at site 0.4 0.4 0.16
6 Risk of in labour, material and equipment availability
0.2 0.8 0.16
7 Poor performance of subcontractor 0.4 0.4 0.16 8 Risk of defective material from supplier 0.6 0.6 0.36 9 Shortage of plant and equipment 0.2 0.2 0.04 10 Poor productivity of plant and equipment 0.4 0.4 0.16 11 Shortage /delay of material supply 0.2 0.8 0.16
12 lack of qualified staff 0.6 0.6 0.36
13 Poor competence and productivity of labour 0.4 0.4 0.16 C SHARED RESPONSIBILITY
1 Risk of natural disasters 0.2 0.4 0.08
2 Delays due to disputes with contractor 0.4 0.6 0.24 3 Inappropriate risk allocated in contract 0.2 0.8 0.16 4 Risk of exchange rate allocation in contract 0.4 0.4 0.16
5 Terrorism / war threats 0.2 0.6 0.12
6 Adverse weather conditions 0.4 0.6 0.24
7 Political instability 0.2 0.8 0.16
8 Corruption including bribery at sites 0.2 0.8 0.16
D UNDECIDED RESPONSIBILITY
1 Risk of unforeseen site condition 0.2 0.6 0.12 2 Risk of differing site condition 0.6 0.4 0.24 3 Inaccurate estimation of quantities of work 0.2 0.8 0.16
4 Inadequacy of insurance 0.4 0.6 0.24
INTERVIEW NO.
1 2 3 4 5 6 7 8 9 10 11 12 13 14 15 16 17 18 19 20 21
To tal M ea n( m) S D( s) C.O. V=( s/m)
Risk of defective design
0.04 0.16 0.24 0.48 0.16 0.12 0.08 0.36 0.36 0.24 0.
08 0. 32
0.24 0.24 0.36 0.16 0.24 0.24 0.08 0.24 0.
16 4.
6 0. 00 7
0.
08 11.1
Risk of funding problems for project
0.16 0.36 0.24 0.24 0.24 0.24 0.12 0.16 0.16 0.48 0.
16 0. 36
0.24 0.48 0.24 0.12 0.36 0.24 0.24 0.48 0.
36 5.
68 0. 01 7
0.
14 8.24
Delay in obtaining permits
0.12 0.16 0.16 0.36 0.32 0.08 0.16 0.48 0.48 0.24 0.
08 0. 16
0.48 0.48 0.48 0.48 0.48 0.48 0.24 0.48 0.
32 6.
72 0. 01 5
0.
14 9.28
Delay in availability of drawings
0.12 0.48 0.24 0.32 0.32 0.36 0.24 0.48 0.48 0.24 0.
24 0. 36
0.48 0.24 0.32 0.24 0.24 0.48 0.64 0.48 0.
24 7.
24 0. 01 1
0.
08 7.42
Risk of changes in codes and regulations
0.16 0.36 0.12 0.36 0.24 0.16 0.48 0.24 0.24 0.48 0.
24 0. 32
0.16 0.24 0.16 0.32 0.48 0.36 0.48 0.32 0.
24 6.
16 0. 01 1
0.
05 4.94
Risk of changes in scope of work
0.04 0.32 0.24 0.32 0.36 0.12 0.12 0.24 0.24 0.36 0.
24 0. 48
0.48 0.48 0.48 0.12 0.64 0.24 0.24 0.48 0.
48 6.
72 0. 02 2
0.
31 13.6
Improper scope of work definition in contract
0.48 0.36 0.36 0.64 0.32 0.24 0.32 0.48 0.48 0.32 0.
12 0. 16
0.48 0.36 0.48 0.24 0.36 0.36 0.48 0.36 0.
32 7.
72 0. 01 5
0.
11 7.42
Payment delays
0.48 0.16 0.32 0.6 0.12 0.24 0.36 0.32 0.32 0.36 0.
24 0. 48
0.48 0.32 0.48 0.48 0.32 0.48 0.48 0.24 0.
36 7.
64 0. 01 7
0.
08 4.94
Accidents/safety during construction
0.04 0.36 0.48 0.6 0.48 0.48 0.24 0.24 0.24 0.48 0.
24 0. 24
0.16 0.36 0.36 0.32 0.36 0.32 0.36 0.24 0.
24 6.
84 0. 01 1
04
1 12.3
Risk of bad quality material/equipment
0.16 0.32 0.48 0.48 0.32 0.32 0.32 0.24 0.24 0.48 0.
36 0. 24
0.36 0.48 0.32 0.24 0.48 0.36 0.32 0.16 0.
64 7.
32 0. 03 0
0.
39 11.1
Inaccurate execution plan/schedule
0.36 0.32 0.36 0.4 0.48 0.36 0.36 0.8 0.8 0.48 0.
16 0. 12
0.64 0.16 0.16 0.36 0.16 0.64 0.48 0.24 0.
24 8.
08 0. 01 1
0.
08 7.42
Risk of insufficent technology
0.16 0.36 0.32 0.6 0.48 0.48 0.16 0.48 0.48 0.48 0.
36 0. 64
0.12 0.48 0.12 0.48 0.64 0.36 0.48 0.16 0.
48 8.
32 0. 02 2
0.
22 9.89
Theft/robbery of material at site
0.16 0.24 0.24 0.36 0.16 0.24 0.12 0.12 0.12 0.16 0.
16 0. 36
0.36 0.48 0.24 0.36 0.36 0.48 0.24 0.36 0.
32 5.
64 0. 01 5
0.
11 7.42
Risk of in labour, material and equipment availability
0.16 0.48 0.36 0.36 0.24 0.32 0.32 0.32 0.32 0.48 0.
48 0. 32
0.48 0.48 0.32 0.32 0.32 0.24 0.48 0.24 0.
24 7. 28 0. 01 1 0.
05 4.94
Poor performance of subcontractor
0.16 0.48 0.32 0.48 0.36 0.36 0.48 0.6 0.6 0.36 0.
36 0. 24
0.24 0.48 0.36 0.24 0.48 0.48 0.24 0.36 0.
36 8.
04 0. 01 7
0.
14 8.24
Risk of defective material from supplier
0.36 0.48 0.36 0.48 0.24 0.32 0.36 0.36 0.36 0.32 0.
32 0. 48
0.08 0.32 0.8 0.16 0.24 0.64 0.24 0.16 0.
64 7.
72 0. 03 0
0.
19 6.49
Shortage of plant and equipment
0.04 0.16 0.32 0.8 0.24 0.32 0.24 0.32 0.32 0.36 0.
24 0. 24
0.12 0.24 0.32 0.24 0.24 0.36 0.24 0.24 0.
24 5.
84 0. 01 1
0.
14 12.3
Poor productivity of plant and equipment
0.16 0.36 0.16 0.32 0.48 0.24 0.08 0.48 0.48 0.32 0.
32 0. 08
0.12 0.48 0.48 0.48 0.48 0.48 0.36 0.36 0.
24 6.
96 0. 01 1
0.
05 4.94
Shortage /delay of material supply
0.16 0.36 0.24 0.36 0.16 0.36 0.24 0.24 0.24 0.24 0.
08 0. 48
0.16 0.32 0.4 0.24 0.24 0.4 0.48 0.48 0.
08 5.
96 0. 00 3
0.
05 14.8
lack of qualified staff
0.36 0.48 0.48 0.48 0.48 0.48 0.36 0.64 0.64 0.16 0.
24 2. 4
0.24 0.32 0.48 0.36 0.48 0.8 0.36 0.48 0.
48 11
.2 0. 02 2
0.
08 3.71
Poor competence and productivity of labour
0.16 0.16 0.48 0.8 0.48 0.16 0.36 0.24 0.24 0.48 0.
08 0. 36
0.04 0.32 0.48 0.36 0.24 0.36 0.24 0.48 0.
24 6.
76 0. 01 1
0.
05 4.94
Risk of natural
disasters 0.08 0.36 0.16 0.24 0.8 0.36 0.24 0.36
0.36
0.48 0.
36 0.
48
0.36 0.24
0.24 0.24
0.24 0.16 0.24 0.24 0.
36 6.
6 0. 01 7
0.
19 11.5
Delays due to disputes with
contractor 0.24 0.48 0.36 0.48 0.24 0.48 0.16 0.32
0.32
0.24 0.
16 0.
48
0.32 0.48
0.64 0.24
0.16 0.32 0.36 0.36 0.
32 7.
16 0. 01 5
0.
05 3.71
Inappropriate risk
allocated in contract 0.16 0.32 0.36 0.36 0.24 0.16 0.36 0.32
0.32
0.48 0.
12 0.
24
0.32 0.32
0.36 0.48
0.36 0.36 0.48 0.24 0.
48 6.
84 0. 02 2
0.
22 9.89
Risk of exchange rate
allocation in contract 0.16 0.48 0.36 0.36 0.48 0.36 0.24 0.24
0.24
0.24 0.
24 0.
24
0.24 0.32
0.16 0.32
0.32 0.32 0.48 0.48 0.
24 6.
52 0. 01 1
0.
Terrorism / war
threats 0.12 0.36 0.12 0.16 0.48 0.48 0.64 0.36
0.36
0.48 0.
08 0.
36
0.12 0.32
0.6 0.24
0.36 0.8 0.24 0.16 0.
36 7.
2 0. 01 7
0.
16 9.89
Adverse weather
conditions 0.24 0.48 0.16 0.24 0.16 0.24 0.24 0.64
0.64
0.48 0.
12 0.
24
0.36 0.36
0.48 0.48
0.48 0.24 0.36 0.24 0.
32 7.
2 0. 01 5
0.
05 3.71
Political instability 0.16 0.24 0.48 0.24 0.36 0.48 0.36 0.32
0.32
0.36 0.
16 0.
16
0.48 0.24
0.48 0.32
0.36 0.64 0.64 0.24 0.
32 7.
36 0. 01 5
0.
11 7.42
Corruption including
bribery at sites 0.16 0.16 0.24 0.48 0.36 0.36 0.48 0.48
0.48
0.16 0.
36 0.
12
0.24 0.24
0.24 0.36
0.24 0.6 0.36 0.24 0.
24 6.
6 0. 01 1
0.
05 4.94
Risk of unforeseen
site condition 0.12 0.36 0.36 0.36 0.36 0.24 0.36 0.48
0.48
0.24 0.
36 0.
08
0.48 0.12
0.16 0.32
0.32 0.32 0.24 0.36 0.
16 6.
28 0. 00 7
0.
02 3.71
Risk of differing site
condition 0.24 0.36 0.32 0.48 0.32 0.24 0.32 0.24
0.24
0.48 0.
16 0.
48
0.24 0.16
0.36 0.36
0.48 0.36 0.16 0.24 0.
48 6.
72 0. 02 2
0.
16 7.42
Inaccurate estimation
of quantities of work 0.16 0.48 0.48 0.36 0.24 0.36 0.36 0.32
0.32
0.32 0.
24 0.
24
0.36 0.16
0.32 0.16
0.48 0.64 0.24 0.16 0.
32 6.
72 0. 01 5
0.
11 7.42
Inadequacy of
insurance 0.24 0.48 0.36 0.64 0.48 0.36 0.24 0.36
0.36
0.24 0.
08 0.
32
0.32 0.24
0.48 0.12
0.24 0.6 0.32 0.64 0.
36 7.
48 0. 01 7
0.
08 4.94
Delays due to lack of availability of
utilities 0.48 0.32 0.32 0.24 0.48 0.48 0.48 0.32
0.32
0.24 0.
32 0.
36 0.24
0.12
0.24 0.48
0.32 0.24 0.48 0.24 0.
36 7.
08 0. 01 7
0.
08 4.94
S.N0. Risks Index Score( ) S.D.( C.O.V.(
1 Risk of defective design 0.007 0.084 11.136
2 Risk of funding problems for project 0.017 0.141 8.249
3 Delay in obtaining permits 0.015 0.141 9.28
4 Delay in availability of drawings 0.011 0.084 7.424
5 Risk of changes in codes and regulations 0.011 0.056 4.949
6 Risk of changes in scope of work 0.022 0.311 13.611
7 Improper scope of work definition in contract 0.015 0.113 7.424
8 Payment delays 0.017 0.084 4.949
9 Accidents/safety during construction 0.011 0.141 12.374
10 Risk of bad quality material/equipment 0.03 0.339 11.136
11 Inaccurate execution plan/schedule 0.011 0.084 7.424
12 Risk of insufficent technology 0.022 0.226 9.899
13 Theft/robbery of material at site 0.015 0.113 7.424
14 Risk of in labour, material and equipment availability 0.011 0.056 4.949
15 Poor performance of subcontractor 0.017 0.141 8.249
16 Risk of defective material from supplier 0.03 0.198 6.496
17 Shortage of plant and equipment 0.011 0.141 12.374
18 Poor productivity of plant and equipment 0.011 0.056 4.949
19 Shortage /delay of material supply 0.003 0.056 14.849
20 lack of qualified staff 0.022 0.084 3.712
21 Poor competence and productivity of labour 0.011 0.056 4.949
22 Risk of natural disasters 0.017 0.198 11.549
23 Delays due to disputes with contractor 0.015 0.056 3.712
24 Inappropriate risk allocated in contract 0.022 0.226 9.899
25 Risk of exchange rate allocation in contract 0.011 0.056 4.949
26 Terrorism / war threats 0.017 0.169 9.899
27 Adverse weather conditions 0.015 0.056 3.712
28 Political instability 0.015 0.113 7.424
29 Corruption including bribery at sites 0.011 0.056 4.949
30 Risk of unforeseen site condition 0.007 0.028 3.712
31 Risk of difering site condition 0.022 0.169 7.424
32 Inaccurate estimation of quantities of work 0.015 0.113 7.424
33 Inadequacy of insurance 0.017 0.084 4.949
Table 6.3 Ranking of Risk
S.No Risks Index Score Rank order
1 Risk of bad quality material/equipment 0.03 1
2 Risk of defective material from supplier 0.03 1
3 Risk of changes in scope of work 0.022 2
4 Risk of insufficient technology 0.022 2
5 lack of qualified staff 0.022 2
6 Inappropriate risk allocated in contract 0.022 2
7 Risk of differing site condition 0.022 2
8 Risk of funding problems for project 0.017 3
9 Payment delays 0.017 3
10 Poor performance of subcontractor 0.017 3
11 Risk of natural disasters 0.017 3
12 Terrorism / war threats 0.017 3
13 Inadequacy of insurance 0.017 3
14 Delays due to lack of availability of utilities 0.017 3
15 Delay in obtaining permits 0.015 4
16 Improper scope of work definition in contract 0.015 4
17 Theft/robbery of material at site 0.015 4
18 Delays due to disputes with contractor 0.015 4
19 Adverse weather conditions 0.015 4
20 Political instability 0.015 4
21 Inaccurate estimation of quantities of work 0.015 4
22 Delay in availability of drawings 0.011 5
23 Risk of changes in codes and regulations 0.011 5
24 Accidents/safety during construction 0.011 5
25 Inaccurate execution plan/schedule 0.011 5
26 Risk of in labour, material and equipment availability 0.011 5
27 Shortage of plant and equipment 0.011 5
28 Poor productivity of plant and equipment 0.011 5
29 Poor competence and productivity of labour 0.011 5
30 Risk of exchange rate allocation in contract 0.011 5
31 Corruption including bribery at sites 0.011 5
32 Risk of unforeseen site condition 0.007 6
33 Risk of defective design 0.007 6
A. Applicability of Test Results to Building Construction Projects
The following statistical techniques were used to analyze the data:
1) Sample population mean and ranking: In this research, ranking is based on sample population m e a n .
2) Kruskal-Wallis Test: This is a nonparametric measure and is used for the comparison of means of variables to test the perceptions of each group (client, consultant, and contractor) about the importance of a specific risk, the management technique to address the risk, and barriers to risk management. The null hypothesis (Ho) for the test is that the means of variables are equal and is rejected if the result is significant. The results are tested against the threshold of statistical significance (0.05) and highly statistically significant (0.01).
3) Spearman Rank Correlation: This test provides a nonparametric measure of the strength and direction of the association that exists between two variables measured on at least an ordinal scale and is denoted by the symbol (r-Rho). It tests the consensus among the various groups (client, consultant, and contractor) on the ranking of the importance of project risks, the management techniques employed, and barriers to implementation of effective risk management. The null hypothesis (Ho) for this test is that there is no correlation among the variables and is rejected if the result is statistically significant at the level of 0.05 and highly statistically significant at 0.01
V. CONCLUSION
The survey reveals many aspects of risk management practices besides providing guidelines to stakeholders about the importance of risks and their generic sources in the construction industry. Risk Management, therefore, requires first an identification of the particular risks and secondly an examination of the engineering and legal responses to allow the risk to be redirected or avoided or transferred to a particular project participant. It is essential to carry out review at the end of each phase of work or project, which identifies those risk events which have occurred. The construction corporations ought to embrace risk as associate degree integral a part of their project management. Decision making like risk assessment in construction comes is incredibly vital within the construction management. The identification and assessment of project risk area unit the essential procedures for protruding success. This study determines the key factors of risk in industry. A total of 34 factors influencing risks in construction are analyzed through pilot survey which include experts of academic (Professors), governmental sectors and construction industry were interviewed and evaluation criteria were obtained because the key issue by interviewed specialists. This approach provides a more practical, correct and arranged call support tool.
REFERENCES
[1] AjibadeAyodejiAibinu and AgboolaOdeyinka (2006) “Construction Delays and their causative factors in Nigeria”, Journal of Construction Engineering and Management, Vol.132, No.8, Page No.667-677.
[2] Jyh-Bin Yang and Pel-RelWel (2010) “ Causes of delay in the Planning and Design phases for Construction Projects” Journal of Architectural Engineering , Vol.16, No.2, Page No.80-83.
[3] K.C.Iyer and K.N.Jha (2006) “Critical Factors Affecting Schedule Performance: Evidence from Indian Construction Projects”, Journal of Construction Engineering and Management, Vol.132, No.8, Page No. 871- 881.
[4] Andrew S.Chang and Fang-Ying Shen (2014) “Effectiveness of Coordination Methods in Construction Project”, Journal of Management in Engineering. [5] Pablo Gonzalez, Vicente Gonzalez,KeithMolenaarph.D. M ASCE and Francisco Orozco ph.D. (2013) “Analysis of causes of delay and times performance in
construction projects”, Journal of Construction Engineering and Management.
[6] N.Hamzah,M.A.Khoiry ,I.Arshad ,N.M.tawil, and A.I.CheAni (2011)“Causes Of Construction Delay- Theoretical Frame work”,Procedia Engineering 20 (2011) 490-495.
[7] M.E.Abd EI-Razek ,H.A.Bassioni, And A.M.Mobarak (2008) “Causes of Delay in Building Construction Projects in Egypt ” Journal of Construction Engineering and Management, Vol.134,No.11, Page No. 831-841.
[8] Murat Gunduz, Ph.d, A.M.ASCE, YaseminNielsen,Ph.d and Mustafa Ozdemir (2013) “Quantification of Delay Factors Using the Relative Importance Index Method for Construction Projects in Turkey ” Journal of Management in Engineering, Vol.29, No.2, Page No. 133-139.
[9] Peter E.D.Love , Raymond Y.C.Tse, and David J.Edwards (2005) “Time-Cost Relationships in Australian Building Construction Projects ” Journal of Construction Engineering and Management, Vol.131, No.2, Page No.187-194.
[10] H. Abdul-Rahaman, M.A.Berawi, A.R.Berawi, O. Mohamed, M.Othman, and I.A.Yahya (2006) “Delay Mitigation in the Malaysian Construction Industry” Journal of Construction Engineering and Management, Vol.132, No.2, Page No. 125-133.
[11] Youngiane Kim, A.M.ASCE, Kyungrai Kim, A.M.ASCE, and Dongwoo Shin (2005) “Delay Analysis Method Using Delay Section” Journal of Construction Engineering and Management, Vol.131, No.11, Page No. 1155-1164.
[12] Cecilia Gravina da Racha and Sergio LuizKemmer (2013) “Method of Implement Delayed product Differentiation in Construction of High-Rise Apartment Building Projects” Journal of Construction Engineering and Management.
[13] ThillaiA.Rajan, GovindGopinath and MonalisaBehera (2013) “PPPs and Project Overruns: Evidence from Road Projects in India” Journal of Construction Engineering and Management.
[14] A.A. Aibinu, G.O. Jagboro,” The effects of construction delays on project delivery in Nigerian construction industry”, International Journal of Project Management 20 (2002) 593– 599.
[15] Desai madhura .c, Prof. s.v.desale, “Study factors affecting of delay in residential construction projects for Nasik city”, International Journal of Latest Trends in Engineering and Technology (IJLTET).
[16] MuraliSambasivan, Yau Wen Soon,” Causes and effects of delays in Malaysian construction industry”, International Journal of Project Management 25 (2007) 517–526.
[17] PrakashRao, B. And Joseph CamronCulas Causes of delays in construction projects International Journal of Current Research.
[18] Jaafari, A. (2001). “Management of risks, uncertainties and opportunities on projects: Time for a fundamental shift.” Int. J. Project Manage., 19(2), 89–101.
[19] Rahman, M. M., and Kumaraswamy, M. M. (2002b). “Risk management trends in the construction industry: Moving towards joint risk manage- ment.” Eng. Constr. Archit. Manage., 9(2), 131–151.