Abstract—Resulting from the trend of increasingly stringent
environmental legislation, the drive to secure environmentally friendly absorption solvents has gained much impetus in recent times. In order to design and operate separation processes units, it is essential that the engineer has accurate and reliable knowledge of the phase equilibrium behaviour of the system in question. Since obtaining experimental data on the system can be time-consuming, the use of thermodynamic models is often useful in obtaining preliminary design and feasibility study information. This work examines the suitability of biodiesel (particularly the constituents methyl palmitate and methyl linolenate) as an absorbent solvent for the recovery of volatile organic compounds (VOCs) from waste process gas streams. In particular, activity coefficients were measured in the dilute region in an attempt to predict the effects of molecular structure and temperature on the solubility of the VOCs in the methyl esters under study. The group contribution methods UNIFAC and Modified UNIFAC Dortmund, set up on Microsoft Excel spreadsheets, were used to predict the required phase equilibrium at infinite dilution. The results obtained in this work compared reasonably well with published literature.
Index Terms—Absorption, Activity coefficients, Group contribution method, Phase equilibrium, Solubility, Volatile organic compounds
I. INTRODUCTION
OLATILE organic compounds (VOCs) and hazardous air pollutants (HAPs) have a profoundly negative impact on the wellbeing of the global village as they affect the health of humans and animals and are major contributors to global air pollution. Faced with increasingly stringent environmental legislation on an international scale, industrial manufacturers and consumers of VOCs and HAPs are therefore being pressurized into eliminating (preferably) or limiting the release of these compounds into the atmosphere.
A. Technology Selection
Chemical industries employ various technologies to either
Manuscript received March 27, 2012; revised March 26, 2012. This work was sponsored by the University of Johannesburg, South Africa.
J.J Scheepers is with the Department of Chemical Engineering and the Built Environment, University of Johannesburg, Doornfontein, Johannesburg 2028; e-mail: [email protected]
E. Muzenda is with the Department of Chemical Engineering, Faculty of Engineering and the Built Environment, University of Johannesburg, Doornfontein, Johannesburg 2028; phone: 11-5596817; Fax: 0027-11-5596430; e-mail: [email protected]
M. Belaid is with the Department of Chemical Engineering, Faculty of Engineering and the Built Environment, University of Johannesburg, Doornfontein, Johannesburg 2028; e-mail: [email protected].
recover or abate VOCs and HAPs from process emissions and waste gas streams. The technologies used for VOC recovery are mostly separation processes of the phase contacting type such as physical and chemical absorption [1]. Absorption processes are considered as an attractive end-of-pipe VOC treatment technology because the absorbent solvent can be regenerated for reuse in a stripping column whilst simultaneously recovering the various VOCs from the solvent for further processing.
B. Solvent Selection
The selection of a suitable solvent is a major factor in ensuring the high operating efficiency of a particular scrubbing system, thus ultimately having a profound impact on the profitability of a chemical process. This work in particular focuses on the use of the biodiesel Fatty Acid Methyl Esters (FAMEs) methyl linolenate and methyl palmitate as suitable ‘green’ absorbent solvents for the control of VOC concentrations in gaseous waste streams. Biodiesel has particular promise as a future absorbent solvent because, apart from it possessing all of the properties of a good solvent biodiesel is also environmentally friendly. The findings of Bay et al [2], [3] have confirmed that FAMEs are well-suited as solvents for VOC absorption. Unfortunately biodiesel is susceptible to oxidative stresses brought about by prolonged exposure to elevated temperatures, atmospheric oxygen, UV radiation or contact with non-ferrous metals [2]. The impact of oxidative stresses on the performance of biodiesel in absorption and stripping processes is yet to be determined.
C. Thermodynamic Model Selection
Optimisation and efficiency are paramount in separation system design since operation of these systems can often account for between 60 – 80% of total costs [4]. A well-designed scrubber system will therefore ensure maximum removal of VOCs from process streams with minimal energy and process material input. Of particular importance in absorber design, synthesis and operation is the thermophysical properties of the various process streams involved in the separation process, as well as the phase equilibrium data of the system [4].
Activity coefficients, which in thermodynamic computations account for the deviations from ideal behaviour (i.e. from Raoult’s Law) of a system, are often used in the development of phase-equilibrium ratios (K -values). Although thermodynamic data can be ascertained via experimental techniques, this is time consuming and measurement of the required parameters is often complex.
Influence of Temperature and Molecular
Structure on Organics-Biodiesel Interactions
using Group Contribution Methods
Jacques J. Scheepers, Edison Muzenda, Member, IAENG and Mohamed Belaid
This problem can be overcome by the use of appropriate thermodynamic models to compute estimated values for the required thermodynamic data. For the purposes of this work the Modified UNIFAC (Dortmund) excess Gibbs energy group contribution model, developed by Weidlich and Gmehling in 1987 [5], was used to predict infinite dilution activity coefficients for the various VOC-solvent mixtures under scrutiny. In order to effect comparison with previous works [2] and [3], the Original UNIFAC model developed in 1975 by Fredenslund, Jones and Prausnitz [6] was also used. Both of these models were set up on a Microsoft Excel spreadsheet in order to perform the required computations.
II. THERMODYNAMIC FUNDAMENTALS
A. Phase Equilibrium
Prausnitz et al [7] have shown that for a closed heterogenous system at equilibrium, consisting of N phases and m components, the following principles apply for the system pressure (P), temperature (T) and chemical potential (µ):
) ( ) 3 ( ) 2 ( ) 1
(
T
T
T
NT
(1)) ( ) 3 ( ) 2 ( ) 1
(
P
P
P
NP
(2)) ( ) 3 ( ) 2 ( ) 1 ( N m m m
m
(3)Furthermore, the change in chemical potential for an ideal gas changing from a standard (reference) state pressure P0 to P under isothermal conditions can be represented as (4) [7]:
0 0 ln P P RT i i
, (4)where μi is the chemical potential (i.e. partial molar Gibbs free energy) of component i. In order to account for non-ideal gas behavior, the pressure terms can be replaced by fugacity (f) terms [7]:
0 0 ln i i i i f f RT
, (5)where the ratio 0 i i f
f is referred to as the activity (ai) of component i in the system. If a system is in vapour-liquid equilibrium (VLE) consisting of a liquid phase (L) and vapour phase (V) then (5), based on (3), can be written as (6)
0 , , 0 , 0 , , 0
, ln ln
L i L i L i V i V i V i f f RT f f
RT
. (6)If the standard states for the two phases are the same, (i.e. 0
, 0
,V iL
i
) then it follows that
0 , 0
,V iL
i
f
f
, (7)thus
L i V i
f
f
,
, . (8)Equations (1), (2) and (8) are regarded as the three fundamental equations of phase equilibrium [7].
B. Phase Equilibrium Ratios for Separation Systems
Phase equilibrium ratios, also known as K-factors (values), are often used in separation technology design. The
K-factor is mathematically defined as the ratio of mole fractions of component i present in the vapour and liquid phases at equilibrium as in (9) [8].
i i i x
y
K , (9)
where yi represents the mole fraction in the vapour phase and xi represents the mole fraction in the liquid phase. Partial fugacities (fˆ ) are usually replaced by expressions i
which incorporate mole fractions in order to determine the required equilibrium ratios. Liquid phase non-ideality is often accounted for by activity coefficients (γ) as presented in (10) [8].
i L i L i x a, ,
. (10)By substituting the activity (ai) with the fugacity ratio described previously, and upon rearranging (10), the following mole fraction expression is obtained for the partial fugacity in the liquid phase (11) [8].
0 , , , ˆ L i i L i L
i x f
f
. (11)A mole fraction form for expressing partial fugacity in the liquid phase can also be obtained by using partial fugacity coefficients (
ˆ
i), as in (12) [8].P x
fˆi,L
ˆi,L i . (12)Furthermore, the mole fraction expression for vapour phase non-ideality is usually expressed using partial fugacity coefficients as (13) [8].
P y
fˆi,V
ˆi,V i . (13)Using (8) and equating (13) to (12) one obtains the
equation-of-state (EoS) form of the K-value as (14) [8].
V i L i i K , , ˆ ˆ
, (14)
which, in combination with appropriate mixing rules, allows one to determine required VLE data using EoS models (e.g. Peng-Robinson and Soave-Redlich-Kwong). By following the same approach as for (14), but equating (13) to (11) instead, one obtains the activity coefficient form of the K-value (15) [8].
V i L i L i V i L i L i i P f K , , , , , , ˆ ˆ
, (15)
III. GROUP CONTRIBUTION METHODS
When little or no experimental data are available, a class of excess Gibbs energy models, group contribution methods (GCMs), is traditionally employed to predict activity coefficients under specified conditions of temperature and composition [9]. A useful GCM for activity coefficient predictions is the UNIFAC method – it is generally regarded as the most successful of the gE-models [10]. The UNIFAC GCM consists of a combinatorial (C) term, which describes the excess Gibbs energy arising due to differences in molecular size and shape and a residual (R) term which describes the excess Gibbs energy differences due to molecular interactions [1] presented as in (16)
R i C i
i
ln lnln . (16)
A. Original UNIFAC Combinatorial term
The combinatorial term is derived from statistical-mathematical arguments and is computed using the Stavermann-Guggenheim correction to the original Flory-Huggins expression (17)
i i i i i i i i i C i q z x
x
ln 1
2 1
ln
ln . (17)
Parameter z, the lattice co-ordination number, is usually set to a value of 5. Parameter qi is the van der Waals molecular surface area for component i. The surface area fraction (θi) is determined by the expression (18).
j j j i i i x q x q
, (18)
where j represents the summation over all components, including component i. Parameter
i, the volume (segment) fraction, is determined as in (19)j j j i i i x r x r
, (19)
where ri is the van der Waals volume parameter. Residual term
The residual term is based on the solution-of-groups concept, which is based on the assumption that a fluid’s physical properties are the sum of contributions made by the molecule's functional groups [6]. The residual term is expressed as in (20).
k i k k i k R i v ) ( )( ln ln
ln , (20)
where
v
k(i) is the number of groups of kind k in a molecule of component (i). The residual activity coefficients (Γk) are both computed using (21), the superscript indicating the residual activity coefficient of k in a reference solution containing only molecules of type i.
m n nm n km m m mk m kk Q
ln 1
ln (21)
Parameter Θm, the surface area fraction for group m, is described as (22).
n n n m m m x Q xQ , (22)
where Q represents the group area parameter and X
represents the group mole fraction for group m, calculated as (23).
n j j j n j j m m x v x vX ( )
) (
. (23)
The group interaction parameter (ψmn) is determined as in (24).
T
a
mn mnexp
(24)B. Modified UNIFAC (Dortmund)
The original UNIFAC model had several shortcomings which led to various modifications to the model being proposed. Modified UNIFAC Dortmund is regarded as the more superior of these modifications in most instances [10]. In the Modified UNIFAC Dortmund one of the major changes to the original expressions include a correction to the segment fraction (
i) used for the Flory-Huggins part of the combinatorial expression, i.e. (18) becomes (26). i i i i i i i i i C i q z x
x
ln 1
2 1
ln
ln . (26)
where the corrected segment fraction is defined as (27).
j j i i i i x r x r
3434 , (27)
Furthermore, the temperature dependence of the group interaction parameter (ψmn), described in (26), was modified as (28).
T
T
c
T
b
a
mn mn mn mn2
exp
. (28)IV. PREVIOUS WORKS OF INTEREST
Bay et al [3] published activity coefficient data in the dilute region of various VOCs using Gas-Liquid Chromatography (GLC). The results, obtained at temperatures of 30°C, 40°C and 50°C, were compared to estimations obtained from an unspecified UNIFAC type model at 30°C. The results showed low activity coefficients for all the families except for the alcohols, formic acid and acetonitrile.
detailed analysis of VLE data on three of the VOCs studied in the previous report, namely benzene, toluene and 1,2-dichloroethane (1,2-DCE). Head Space Gas Chromatography was employed to calculate the activity coefficients of these compounds in European biodiesel, approximating the properties to that of the major constituent methyl oleate. Measurements were carried out for pure biodiesel and varying mole fractions of the three VOCs in biodiesel at temperatures of 30, 35 and 40°C. During the analyses, the mole fraction of the VOCs was kept below 0.008, corresponding to VOC partial pressures of between 20 and 200 Pa in all cases for the purposes of extrapolation to infinite dilution. The experimentally determined activity coefficient values of the three VOCs in biodiesel were compared to results calculated with Original UNIFAC, and the Modified UNIFAC Dortmund and Lyngby models.
The authors concluded that the activity coefficients calculated during this trial compared well with the data from the previous work, and showed good agreement with the Original and Modified UNIFAC (Dortmund) predictions.
V. METHODOLOGY
In order to accomplish the objectives of this work, Microsoft Excel spreadsheets were set up to perform the required computations. Two spreadsheets were set up for the task – one for each of the UNIFAC models. Model-specific group interaction parameter (GIP) tables, and ‘Rk’- and ‘Qk’ parameter tables, were established within each spreadsheet in order to facilitate ease of computation.
The UNIFAC models in essence encompass the following methodology:
- The suitable reduction of previously obtained experimental activity coefficient data to develop interaction parameters which characterise the interactions between pairs of structural groups, and - the use of these parameters in predicting activity
coefficients for other systems for which no experimentally obtained data is available, but which contain the same functional groups.
The interaction parameters which comprise the UNIFAC models are the energy-interaction parameters Rk (group volume parameter) and Qk (group area parameter), as well as the group interaction parameters amn, bmnand cmn.
VI. RESULTS &DISCUSSION
Activity coefficients were predicted for 39 volatile organic compounds in methyl linolenate, methyl palmitate and methyl oleate at temperatures of 30, 35 and 40°C respectively. The above temperature range was selected as an area of interest for most scientific investigations, and is a practical temperature range for most absorption operations [2]. A mole fraction of 0.0005 was selected as standard for the purpose of effective temperature comparisons. Furthermore, activity coefficient computations were also conducted at a mole fraction of 0.005 and a temperature of 40°C in order to compare results with previously published material [2], [3].
A. Previously Published Material
As is evident from Table 1, the results computed at 40°C with the Excel spreadsheets were generally found to be
slightly different, but nevertheless comparable, to those obtained by Bay et al in 2006 [2]. The most notable exception is the value computed for formic acid in methyl oleate – the likely cause for this discrepancy could not be established and warrants further investigation.
TABLE I
COMPARISON OF COMPUTED RESULTS (METHYL OLEATE) WITH PREVIOUS
PUBLICATIONS,MOLE FRACTION =0.005 FOR THIS WORK
! Unifac group interaction parameters unavailable for computation.
The values published by the same authors in 2004 [3] at a temperature of 30°C (using an unspecified UNIFAC model) appear to differ markedly from the results obtained in this work. A possible source of the slight discrepancies obtained with the Excel spreadsheet computations could emanate from rounding off ‘errors’. The biodiesel used by Bay et al
is a mixture of methyl esters of differing chain lengths and properties, which could have contributed to the above discrepancies. The results computed in this work highlight the considerable variation in activity coefficients between the three methyl esters studied.
B. Influence of Molecular Structure
Table II presents results computed in this work for the various organic compounds in the solvents methyl linolenate and methyl palmitate. It is evident when examining trends within organic families such as the straight chain alkanes, ketones and straight chain ethers that activity coefficient values increase with an increase in non-polar hydrocarbon chain length. This observation does not hold true for highly polar molecules such as the alcohols (especially the diols) and the organic acids, where activity coefficients decrease with increasing hydrocarbon chain length. This can be attributed to the increased shielding effect (resulting from the increase in hydrocarbon tail length) over the polar head.
It is also evident that the slightly overall polar charged organic families such as the halogenated hydrocarbons and the amines generally possess lower activity coefficient values than the non-polar alkanes. Also of note is that cyclic compounds possess generally lower activity coefficients than their straight chain counterparts. Furthermore, aromatic
UNIFAC UNI-DMD
UNIFAC (Unsp.)
[3] UNI-DMD
[2]
T(°C) 40 40 30 40 30 40
1,2-Dichloroethane 0.812 1.081 0.615 0.647 0.939 1.073
2-Chlorobutane 0.593 0.770 0.805 0.833 0.900
Dichloromethane 0.423 0.710 0.440 0.475 0.788
T richloromethane 0.487 0.485 0.324 0.334 0.537
Cyclohexane 0.682 0.926 0.927 1.020 0.888
Hexane 0.675 0.988 1.355 1.159 1.109
Heptane 0.831 1.045 1.469 1.260 1.150
T oluene 0.687 0.654 0.645 0.671 0.798 0.649
Diethyl Ether 0.589 0.637 0.792 0.790 0.524
Methyl-tert-butyl Ether 2.822 0.577 0.777 0.779 0.662
Formic Acid 10.045 ! 6.028 5.913 4.186
Acetone 2.221 1.414 1.407 1.348 1.557
Ethylmethylketone 1.491 1.330 1.514 1.450 1.621
Methanol 3.843 5.170 4.466 3.045 6.418
tert-Butyl Alcohol 3.578 2.445 4.095 2.862 5.259
Bay et al
Experimental [3]
compounds and halogenated compounds generally possess the lowest activity coefficient values.
TABLE II
RESULTS FOR ORGANIC COMPOUNDS IN SOLVENTS METHYL
LINOLENATE AND METHYL PALMITATE AT DIFFERENT
TEMPERATURES (MOLE FRACTION =0.0005)
! Unifac group interaction parameters unavailable for computation.
The low activity coefficient values obtained for the aromatic compounds is most likely due to the polarizing effect caused by the delocalised electron cloud around the benzene ring. This effect allows for the distortion of the electron cloud around the solvent molecule which induces temporary dipoles between the solute and the solvent molecules. This type of van der Waals force is known as
London dispersion forces, and is extremely strong for the benzene molecule. It seems to be strong enough to partially neutralise the strong hydroxyl group which defines alcohols, hence the fact that phenol was the only alcohol to possess an activity coefficient value of less than 1.
The reason for the low activity coefficient values obtained for halogenated hydrocarbons seems to be the effect of the high electronegativity of the halogen group. It was noted that 1,2-dibromoethane (which contains the less electronegative bromine atoms) had a higher activity coefficient than 1,2-dichloroethane, which is the more polar of the two molecules. The major van der Waals forces governing interactions between the slightly polar solvent molecules and the halogenated hydrocarbons are permanent dipole-dipole interaction forces.
It can be seen from the above observations that the lower activity coefficient values translate into increased affinity of the organic solute for the absorbent solvent, and this in turn means higher solubility of the solute in the methyl esters With the notable exception of aromatic compounds, permanent dipole-dipole interactions are the dominant van der Waals forces which determine the low activity coefficient values between organic solutes and the solvents.
The permanent dipole-dipole forces which dominate between the methyl ester solvents and the solutes are much weaker than the hydrogen bonding which predominantly occurs between molecules containing the hydroxyl group. This ensures that solutes such as alcohols and ethanolamines have low affinity for the methyl ester absorbent solvents, hence the high activity coefficient values experienced between the solvent and these solutes.
Trends were inconclusive regarding the suitability of the methyl esters studied. It was evident that methyl linolenate was best suited as a solvent (i.e. yielded lower activity coefficient values) with the organic acids, ketones and aromatics. Methyl palmitate was more suited to absorbing the alkanes, ethers and amines. No clear winner was identified for the alcohols and halogenated hydrocarbons.
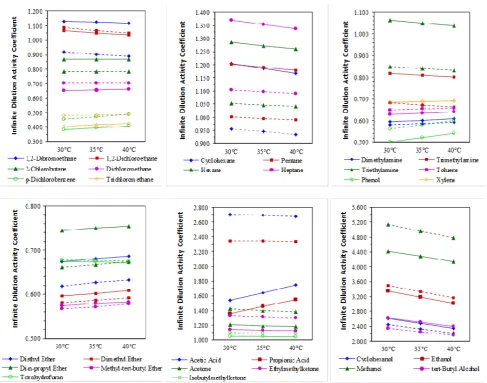
C. Effect of Temperature
From the results displayed in Figure 1, it is evident that there were no clear overall trends in activity coefficient behavior with an increase in temperature. It is expected that an increase in activity coefficient value would signify a decrease in gas solubility, since physical absorption processes (which rely on high solubility between solute and solvent) favour lower activity coefficient values. Naturally the converse is also true.
An increase in activity coefficient was noted for ethers (with the exception of tetrahydrofuran and 2-ethoxyethanol), aromatic compounds and halogenated hydrocarbons (with the exception of the dihalogenated compounds). A decrease in activity coefficient with increasing temperature was however noted for the amines (barring dimethylamine), alcohols, ketones and the alkanes.
Surprisingly, the activity coefficients of the organic acids in the methyl ester solvents were affected by the solvent itself – activity coefficients decreased in methyl palmitate, but increased in methyl linolenate, with increasing temperature.
Modifie d UNIFAC Do C ompone nt
T (°C) 30 35 40 30 35 40
Halogenated Hydrocarbons
1,2-Dibromoethane 1.129 1.124 1.118 0.920 0.904 0.888
1,2-Dichloroethane 1.066 1.052 1.037 1.087 1.068 1.050
2-Chlorobutane 0.869 0.868 0.868 0.782 0.782 0.783
Dichloromethane 0.655 0.658 0.660 0.703 0.704 0.704
p-Dichlorobenzene 0.382 0.396 0.408 0.454 0.472 0.489
T richloromethane 0.406 0.415 0.424 0.480 0.485 0.490
Alkanes
Cyclohexane 1.205 1.186 1.168 0.956 0.945 0.935
Pentane 1.202 1.191 1.180 1.001 0.996 0.991
Hexane 1.286 1.273 1.260 1.053 1.047 1.042
Heptane 1.371 1.354 1.338 1.104 1.097 1.090
Amines
Dimethylethanolamine 7.453 6.845 6.292 7.350 6.749 6.198
T riethanolamine 2503.5 2042.1 1666.3 3405.9 2783.5 2271.7
Dimethylamine 0.596 0.602 0.609 0.581 0.587 0.592
T rimethylamine 0.817 0.809 0.800 0.682 0.672 0.663
T riethylamine 1.062 1.050 1.039 0.849 0.840 0.832
Aromatics
T oluene 0.630 0.635 0.639 0.650 0.654 0.657
Phenol 0.503 0.522 0.540 0.561 0.581 0.600
Xylene 0.682 0.687 0.691 0.685 0.689 0.692
Ethers
2-Ethoxyethanol 3.050 2.942 2.836 3.342 3.230 3.118
Diethyl Ether 0.674 0.680 0.686 0.619 0.626 0.632
Dimethyl Ether 0.596 0.602 0.609 0.581 0.587 0.592
Di-n-propyl Ether 0.744 0.750 0.754 0.661 0.667 0.674
Methyl-tert-butyl Ether 0.574 0.579 0.583 0.567 0.572 0.578
T etrahydrofuran 0.674 0.673 0.671 0.678 0.677 0.675
Acetates
Butyl Acetate 1.025 1.023 1.021 1.127 1.118 1.109
Organic Acids
Acetic Acid 1.536 1.642 1.745 2.704 2.690 2.676
Propionic Acid 1.358 1.454 1.549 2.349 2.343 2.336
Acrylic Acid 1.984 2.008 2.028 3.698 3.480 3.284
Formic Acid ! ! ! 15.701 16.158 16.533
Ketones
Acetone 1.205 1.192 1.179 1.426 1.402 1.378
Ethylmethylketone 1.142 1.134 1.125 1.328 1.312 1.295
Isobutylmethylketone 1.049 1.047 1.045 1.098 1.093 1.087
Alcohols
Cyclohexanol 2.608 2.473 2.349 2.437 2.321 2.213
Ethanol 3.339 3.176 3.024 3.490 3.328 3.174
Methanol 4.422 4.278 4.136 5.136 4.954 4.776
tert-Butyl Alcohol 2.620 2.502 2.393 2.343 2.247 2.155
Ethylene Glycol ! ! ! 22.048 21.854 21.637
Propylene Glycol ! ! ! 11.283 11.212 11.130
1,2-Butanediol ! ! ! 8.034 7.994 7.946
Fig. 1. Activity coefficients for the various organic families in (a) methyl linoleate ( ― ) and (b) methyl palmitate ( - - - ). From left to right, halogenated alkanes; alkanes; amines & aromatic compounds; ethers; organic acids & ketones; alcohols.
Whilst the solubility of most gases is expected to decrease with an increase in temperature, this should not be necessarily regarded as rule-of-thumb. It should be noted that the temperature effect on the solubility of gases is directly related to either the partial molar enthalpy or partial molar entropy of the gaseous solute in the respective liquid phase [7]. The effect of changes in the enthalpy and entropy of solution for the above systems still requires some investigation.
ACKNOWLEDGMENT
The authors wish to acknowledge fellow group members L Ntaka and NP Nkosi for constructive discussions during this work in particular manuscript preparation. The authors are also very grateful to the University of Johannesburg’s Research Committee and First National Battery, SA for financial support.
REFERENCES
[1] A. Fredenslund, J. Gmehling, M. L. Michelson, P. Rasmussen, and J. M. Prausnitz, "Computerised Design of Multicomponent Distillation Columns using the UNIFAC Group Contribution Method," Ind. Eng. Chem., Process Des. Dev., vol. 16, no. 4, pp. 450–462 , Apr. 1977. [2] K. Bay, H. Wanko, and J. Ulrich, "Absorption of Volatile Organic
Compounds in Biodiesel: Determination of Infinite Dilution Activity Coefficients by Headspace Gas Chromatography," Chem. Eng. Res. Des., vol. 84, no. A1, pp. 22–27, Jan. 2006.
[3] K. Bay, H. Wanko, and J. Ulrich, "Biodiesel - Hoch Siedendes Absorbens für die Gasrienigung," Chemie Ingenieur Technik, vol. 76, no. 3, pp. 328–333, Mar. 2004.
[4] J. Gmehling, "Present Status and Potential of Group Contribution Methods for Process Development," J. Chem. Thermodynamics., vol. 41, no. 6, pp. 731–747, Jun. 2009.
[5] U. Weidlich and J. Gmehling, "A Modified UNIFAC Model. 1. Prediction of VLE, hE, and γ∞," Ind. Eng. Chem. Res., vol. 26, no. 7, pp. 1372–1381, Jul. 1987.
[6] A. Fredenslund, R. L. Jones, and J. M. Prausnitz, "Group-Contribution Estimation of Activity Coefficients in Nonideal Liquid Mixtures," AlChE Journal, vol. 21, no. 6, pp. 1086–1099, Nov. 1975. [7] J. M. Prausnitz, R. N. Lichtenthaler, and E. G. de Azevedo,
"Molecular Thermodynamics of Fluid Phase Equilibria", 3rd ed. New Jersey, USA: Prentice Hall, 1999, pp.17, 21–23, 596.
[8] J. D. Seader and E. J. Henley, "Separation Process Principles", 2nd ed. New York: John Wiley & Sons, Inc., 2005, pp.31–33.
[9] S-T. Lin and S. I. Sandler, "A Priori Phase Equilibrium Prediction from a Segment Contribution Solvation Model," Ind. Eng. Chem. Res., vol. 41, no. 5, pp. 899–913, Mar. 2002.
[image:6.595.57.545.54.437.2]