Abstract - The Indian life insurance industry is the least profitable market for its shareholders among all Asian countries due to fall in new business premium in 2010-11 in spite of the fact that it has reported net profit of Rs. 26.57 billion in 2010-11 as against net loss of Rs. 9.89 billion in 2009-10. However, the life insures’ characteristics that are related to profitability have not been studied in the Indian conditions. In this context, the present study tried to model the factors determining the profitability of life insurers operating in India taking return on asset as dependent variable. This is an empirical study. The sample for this study include all the 23 Indian life insurers (including 1 public and 22 private) and it used the data pertaining to 3 financial years, viz., 2008-09, 2009-10 and 2010-11. For this purpose, firm specific characteristics such as leverage, size, premium growth, liquidity, underwriting risk and equity capital are regressed against Return on Assets. This study led to the conclusion that profitability of life insurers is positively and significantly influenced by the size (as explained by logarithm of net premium) and liquidity. The leverage, premium growth and logarithm of equity capital have negatively and significantly influenced the profitability of Indian life insurers. This study does not find any evidence for the relationship between underwriting risk and profitability.
Index Terms— Profitability, Indian Life Insurers, Financial Performance.
I. INTRODUCTION
A well-developed and evolved insurance sector is a boon for economic development as it provides long- term funds for infrastructure development at the same time strengthening the risk taking ability of the country. Life insurers are custodians and managers of substantial investments of individuals; and policyholders need to be confident that their insurer will be able to meet its promised liabilities in the event that claims are made under a policy. Regulatory authorities therefore seek to ensure that the financial performance of life insurance companies is in sound condition. Insurance is a big opportunity in a country like India with a large population and untapped potential. In this current scenario of growing customer base, one of the principal concerns underlying the regulation of the insurance companies is the need to protect the interest of and secure fair treatment to policyholders.
II. INSURANCE MARKET – GLOBAL AND INDIAN SCENARIO
Insurance industry, the world over forms an integral part of the financial services sector and plays a pivotal role in
Manuscript received March 23, 2012. This work was supported by the grant from All India Council for Technical Education, New Delhi, India. The Author is with the Department of Management Studies, School of Management, Pondicherry University (A Central University of Government of India), Kalapet, Pondicherry 605 014, India (Mobile:+91 94432 31337; Fax: +91 413 2655253; email:[email protected])
the economic growth of an economy. A well-developed insurance market paves way for efficient resource allocation through transfer of risk and mobilization of savings. Insurance industry is well developed in economies such as the US, Europe, Japan, and South Korea. Emerging markets are found throughout Asia, specifically in India and China, and are also in Latin America. In 2012, the global insurance market is forecast to have a value of $4,608.5 billion, an increase of 24.9% since 2007. Life insurance dominates the global insurance market, accounting for 59.7% of the market′s value.
The insurance market in India has witnessed dynamic changes including entry of a number of global insurers in both life and general segment. Life Insurance industry in India is ranked 9th among the 156 countries, during 2010-11 and the Indian non-life insurance industry improved in its global ranking to 19th in comparison to 26th in last year. The Indian insurance sector was dominated by the state owned Life Insurance Corporation of India and the General Insurance Corporation of India (earlier general insurer, now reinsurer) along with its four subsidiaries. The process of re-opening the sector had begun in the early 1990s and following the recommendations of the Malhotra Committee report, in 1999, the Insurance Regulatory and Development Authority (IRDA) was constituted as an autonomous body to regulate and develop the insurance industry. The key objectives of the IRDA include promotion of competition so as to enhance customer satisfaction through increased consumer choice and lower premiums, while ensuring the financial security of the insurance market. At present, the Indian insurance sector is a colossal one and is growing at a speedy rate of 15-20%. In exercise of the powers laid down in Section 14 (2) of the IRDA Act 1999, IRDA regulates, promotes and ensures an orderly growth of the insurance business for the benefit of all the stakeholders and to provide long term funds for accelerating the growth of the economy. Insurance density of life insurance sector had gone up from USD 9.1 in 2001 to USD 55.7 in 2010. Insurance penetration had gone up from 2.15% in 2001 to 4.40% in 2010. Market share of LIC declined from 70.10% in 2009-10 to 69.78% in 2010-11. The market share of private insurers has gone up from 29.90% in 2009-10 to 30.22% in 2010-11 (http://www.irda.gov.in). The number of insurance companies stood at 48 at the end of 2010-11, consisting of 23 life insurers, 24 non-life insurers and a reinsurer. Edelweiss Tokio Life Insurance Company was granted registration in the year 2011-12, leading to total number of insurance companies increasing to 49 as at end-September 2011.
III. REVIEW OF LITERATURE
Relevant earlier studies relating to the determinants of profitability/financial performance of insurance firms are as follows. Adams., M and Buckle., M (2003) found that highly levered, low liquid Bermuda insurers have comparatively
On the Determinants of Profitability of Indian
better operational performance and performance was positively related to underwriting risk but size and scope of activities were not. After accounting for differences across insurers, taking market and economic factors, Mark J. Browne, et.al (2003) found that portfolio returns on bond and disposable personal income per capita were positively related and unanticipated inflation was negatively related to performance of US life insurers.
In the fragmented regulatory US life insurance industry, Michael K. Mc Shane et.al (2010) found that the profitability measure, viz., operating return on equity is positively related to regulatory competition. Employing survey method, Paul J.M. Klumpes (2005) found that the senior management of UK life insurance companies used embedded value for strategic management planning and control purposes. Taking both stock and mutual life insurers in New York State during 1952-1966, Richard Spiller (1972) found that there is a difference in size and product mix due to ownership structure.
Mike Adams (1996) found that the organisational characteristics such as size, leverage and underwriting risk were significantly and positively related to the investment earnings of New Zealand stock life insurers. Taking board characteristics of Thailand life insurers, Thomas Connelly, J., and Piman Limpaphayom (2004) found that the board composition was positively related to profitability; but negatively related to underwriting risk; and board size was not related to firm performance. Ho-Li Yang, (2007) measured the financial performance using Financial Rate Analysis and measured the non-financial performance of Taiwan life insurers, using Data Envelopment Analysis. Dragana Ikonić, et.al (2011) analysed the performance of insurance companies in Serbia by applying the CARMEL method and found that the level of capital is the determinant of profitability. Born H. P., (2001) found that the insurance company performance is significantly related to size and effective number of competitors and weakly related to insurers’ legal and regulatory environments in Nigeria. Naveed Ahmed et al. (2011) found that performance of Pakistan life insurance companies is determined by size, risk and leverage. Hifza Malik (2011) found that the profitability of Pakistan insurance companies is significantly and positively influenced by volume of capital; significantly and negatively influenced by loss ratio and leverage; and not related to age of the insurer.
There have been numerous studies focusing on the determinants of insolvency of insurance companies operating in the developed and developing economies of the world. However, the insurer characteristics that are related to profitability have not received much attention sparing a few studies. Profitability in general is defined as the ability of the business to utilise its assets in order to generate revenues in an efficient manner. Berger et al. (1997) contend that the factors underpinning the financial performance of financial services firms are often difficult to discern because of the intangible nature of outputs and the lack of transparency over resource allocation decisions.
The Indian life insurance industry, which has been reeling under a slowdown due to a fall in new business
premium collection during 2010-11, is the least profitable market for its shareholders among all Asian countries, according to a McKinsey report (2011). However, the life insurance industry reported net profit of Rs 26.57 billion in 2010-11 as against net loss of Rs 9.89 billion in 2009-10, according to IRDA data. (www.irda.gov.in). Further, there is dearth of empirical studies on the factors determining the profitability of Indian life insurers. In this context, the present study tried to close this gap and analysed empirically the determinants of profitability of life insurers operating in India.
IV. OBJECTIVEOFTHESTUDY
This study aims to model the factors that determine the profitability of Indian life insurers taking the Return on Assets (ROA) as the dependent variable.
V. RESEARCHMETHODOLOGY
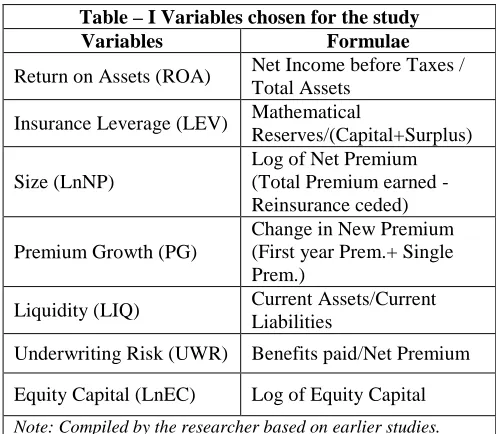
This is an empirical study. It has taken all the 23 India life insurers (1 public and 22 private) as sample (Refer Appendix). The study period includes 3 financial years, viz., 2008-09, 2009-10 and 2010-11. The data required were drawn from IRDA data base and the public disclosures and annual reports of the respective companies. This study uses linear multiple regression model. For this purpose, the firm specific characteristics such as leverage, size, premium growth, liquidity, underwriting risk and equity capital are regressed against Return on Assets. Table I shows the variables used and the formulae.
The linear multiple regression model developed for this study is as follows:
[image:2.595.306.554.396.613.2]In this study, the dependent variable is Return on Assets (ROA), which is proxy for profitability. ROA is a ratio of Net income before tax to Total Assets. Six Independent variables considered, for this study, include LEV, LnNP, PG, LIQ, UWR and LnEC. This study also tested the assumptions of the linear multiple regression model, viz., multicollinearity and homoscedasticity.
Table – I Variables chosen for the study
Variables Formulae
Return on Assets (ROA) Net Income before Taxes / Total Assets
Insurance Leverage (LEV) Mathematical
Reserves/(Capital+Surplus) Size (LnNP)
Log of Net Premium (Total Premium earned - Reinsurance ceded) Premium Growth (PG)
Change in New Premium (First year Prem.+ Single Prem.)
Liquidity (LIQ) Current Assets/Current Liabilities
Underwriting Risk (UWR) Benefits paid/Net Premium Equity Capital (LnEC) Log of Equity Capital Note: Compiled by the researcher based on earlier studies.
ROA = β0 + β1 LEV + β2 LnNP + β3 PG +
VI. HYPOTHESES
To achieve the objectives, the study tested the following null hypotheses:
H01: There is no significant relationship between leverage
and return on assets.
H02: There is no significant relationship between size (Log
of Net Premium) and return on assets.
H03: There is no significant relationship between premium
growth and return on assets.
H04: There is no significant relationship between liquidity
and return on assets.
H05: There is no significant relationship between
underwriting risk and return on assets.
H06: There is no significant relationship between equity
capital and return on assets.
VII. RESULTSANDDISCUSSION
Table II portrays the descriptive statistics for the variables used in this study. The Return on Assets averaged – 8.4 and ranged from -85.9% (BHARTI - Private Life Insurer) to 4.25% (SAHARA – Private Life Insurer). The ratio of leverage had an average of 48.18 and ranged from 0 (IDBI - Private Life Insurer) to 974.49 (LICI - Life Insurance Corporation of India - Public Life Insurer). The ratio of underwriting risk averaged 0.14 and ranged between -0.006 (DLF - Private Life Insurers) and 0.59 (ICICI - Private Life Insurer). The premium growth averaged 177% and ranged from -33.49% (METLIFE - Private Life Insurer) to 5923% (FUTURE - Private Life Insurer). The ratio of liquidity had an average of 0.93 and ranges from 0.217 (INDFIR - Private Life Insurer) to 3.72 (LICI – Public Life Insurer). The natural log of equity capital averaged to 10.92 with a minimum of 6.21 (LICI) and a maximum of 12.21 (AVIVA – Private Life Insurer). The size of the insurer (as explained by log of net premium) averaged 12.03 with a minium of 5.82 (DLF) and a maximum of 16.83 (LICI).
Table III shows the model summary of the regression for the sample life insurance firms. The value of R is equal to 63.5% and R-Square of the model equal to 40.3%. This means that 40% of the change in the dependent variable, viz., Return on Assets (ROA) is due to the variations in the independent variables used in this model.
Table IV shows the result of ANOVA. By using the analysis of variance, it is found that F test of the model is equal to 6.875 and is significant.
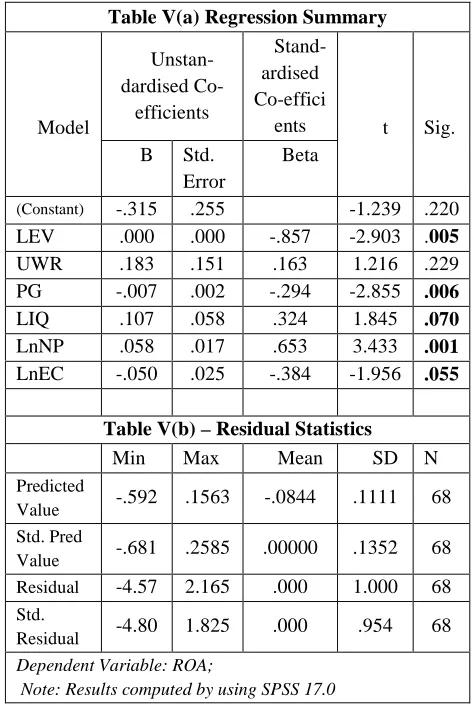
[image:3.595.313.555.132.237.2]Insurance Leverage: The degree of financial leverage reflects insurance companies' ability to manage their economic exposure to unexpected losses. This ratio represents the potential impact on capital and surplus of deficiencies in reserves due to financial claims. (Adams and Buckle 2003). This study used the ratio of Mathematical Reserves to Capital and Surplus as a measure of insurance leverage. The regression result in Table V (a) clearly shows that there is a negative relationship between the return on assets and the insurance leverage (Mathematical Reserves/Capital and Surplus). The Beta coefficient for this Table – II Descriptive Statistics – Variables of Analysis
Variables N Min Max Mean SD
ROA 68 -.859 .04255 -.084 .1750
LEV 68 .000 974.486 48.186 188.740
UWR 68 -.006 .59444 .1400 .1552
PG 68 -.334 59.2367 1.776 7.8922
LIQ 68 .217 3.72289 .9343 .5286
LnEC 68 6.214 12.2085 10.927 1.3559 LnNP 68 5.820 16.8278 12.030 1.9717 Valid N 68
[image:3.595.319.556.296.649.2]Note: Results obtained using SPSS 17.0.
Table III – Model Summary b
Model R R
Square
Adjusted R Square
Std. Error of the Estimate
1 .635a .403 .345 .14169
a. Predictors:(Constant), LnEC, PG, UWR, LIQ, LnNP, LEV b. Dependent Variable: ROA
Results obtained by using SPSS 17.0.
Table IV – Analysis of Variance
Model Sum of Squares df
Mean
Square F Sig. 1 Regression .828 6 .138 6.875 .000a Residual 1.225 61 .020
Total 2.053 67
a. Predictors:(Constant), LnEC, PG, UWR, LIQ, LnNP, LEV b. Dependent Variable: ROA
Results obtained by using SPSS 17.0.
Table V(a) Regression Summary
Unstan- dardised Co-
efficients
Stand-ardised Co-effici ents Model
B Std. Error
Beta
t Sig.
(Constant) -.315 .255 -1.239 .220
LEV .000 .000 -.857 -2.903 .005
UWR .183 .151 .163 1.216 .229
PG -.007 .002 -.294 -2.855 .006
LIQ .107 .058 .324 1.845 .070
LnNP .058 .017 .653 3.433 .001
LnEC -.050 .025 -.384 -1.956 .055 Table V(b) – Residual Statistics
Min Max Mean SD N
Predicted
Value -.592 .1563 -.0844 .1111 68 Std. Pred
Value -.681 .2585 .00000 .1352 68 Residual -4.57 2.165 .000 1.000 68 Std.
Residual -4.80 1.825 .000 .954 68 Dependent Variable: ROA;
[image:3.595.43.290.299.442.2] [image:3.595.39.289.682.764.2]variable is negative and significant at 1% with a P-Value of 0.005. Its t-test value is – 2.903, which is greater than the critical value and the null hypothesis H01 is rejected. Hence, there is a significant negative relationship between return on assets and insurance leverage. The standardised coefficient Beta value is -0.857. Using the standardised coefficient and keeping all the other variables constant, if the insurance leverage increases by 100, return on assets will decrease by 85.7. Thus, it can be concluded that insurers with high leverage (using leverage beyond a level) will have adverse impact on the profitability.
Net Premium: It is the premium earned by a life insurance company after deducting the reinsurance ceded. The premium base of life insurers decides the quantum of policy liabilities to be borne by them. The formula used is Net Premium = Total Premium earned - Reinsurance ceded. The regression result in Table V(a) clearly shows that there is a positive relationship between the return on assets and the net premium. The Beta coefficient for this variable is positive and significant at 1% with a P-Value of 0.001. Its t-test value is 3.433, which is greater than the critical value and the null hypothesis H02 is rejected. Hence, there is a significant positive relationship between return on assets and the net premium. The standardised coefficient Beta value is 0.653. Using the standardised coefficient and keeping all the other variables constant, if the net premium increases by 100, return on assets will increase by 65.3. A subdued equity market and declining policy sales will affect small insurers more than the large private players who have a bigger share in renewal premium income in the Indian context. Thus, it can be concluded that large insurers have comparative advantage over small insurers in being more profitable and having more return on assets.
Premium Growth: The Premium growth of life insurers is measured as a year to year change in the new premium of life insurance companies. The new premium comprises of first year premium and single premium policies procured in a particular year in comparison with new premium of previous year. From the Table V(a), it is clear that there is a negative relationship between the return on assets and premium growth. The Beta coefficient for premium growth is negative and significant at 1% level with a P-Value of 0.006. Its t-test value is -2.855 which is greater than the table value. Hence, the null hypothesis H03 is rejected. Thus, there is a significant negative relationship between the premium growth and return on assets. The unstandardised coefficient of premium growth equals to -0.007 and its standardised coefficient Beta value is -0.294. Using the standardised coefficient and keeping all the other variables constant, if the premium grows by 100, return on assets will decrease by 29.4. Thus, it can be concluded that the insurers with more premium growth will have low profitability due to increased underwriting risk and related provisioning for solvency margin.
Liquidity: Liquidity is the ability of the insurers to fulfil their immediate commitments to policyholders without having to increase profits on underwriting and investment activities and/or liquidate financial assets. The cash and bank balances are to be kept sufficient to meet the immediate liabilities towards "claims due for payment but not paid". This comfortably covers the incurred but not reported portion of claims liability. This study used the ratio of current assets to
current liabilities. (Adams and Buckle 2003). The regression result in Table V(a) clearly shows that there is a positive relationship between the return on assets and liquidity. The Beta coefficient for this variable is positive and significant at 10% level with a P-Value of 0.070. Its t-test value is 1.845, which is greater than the critical value and the null hypothesis H04 is rejected. Hence, there is a significant positive relationship between return on assets and liquidity. The unstandardised coefficient of liquidity equals to 0.107 and its standardised coefficient Beta value is 0.324. Using the standardised coefficient and keeping all the other variables constant, if the liquidity increases by 100, the return on assets will increase by 32.4. Thus, it can be concluded that the more liquid firms will have more return on assets compared to less liquid firms.
Underwriting Risk: Underwriting Risk reflects the adequacy, or otherwise, of insurers' underwriting performance (Adams and Buckle 2003). Sound underwriting guidelines are pivotal to an insurer's financial performance. The underwriting risk depends on the risk appetite of the life insurers. This study has taken the ratio of Benefits Paid to Net Premium as a measure of underwriting risk. The regression result in Table V(a) clearly shows that there is positive relationship between the return on assets and the underwriting risk. The Beta coefficient for this variable is positive but not significant. Its t-test value is 1.216 which is less than the critical value and the null hypothesis H05 is accepted. Hence, there is no significant relationship between return on assets and underwriting risk.
Equity Capital: After the opening up of the Indian insurance industry, following the Malhotra Committee recommendations in the year 1999, many private players have entered the Indian insurance arena either as fully owned domestic insurers or in collaboration with foreign partners. This has made the Indian insurance industry to be rich in terms of the quantum of equity capital infusion made by these firms. From the Table V(a), it is clear that there is a negative relationship between the return on assets and equity capital. The coefficient for the natural logarithm of equity capital is negative and significant at 10% level. Its t-test value is -1.956 which is greater than the table value. Hence, the null hypothesis H06 is rejected. Thus, there is a significant negative relationship between the equity capital and return on assets. The unstandardised coefficient of equity capital equals to - 0.050 and its standardised coefficient Beta value is -0.384. Using the standardised coefficient and keeping all the other variables constant, if the value of equity increases by 100, return on assets will decrease by 38.4. The regulatory requirement demands a minimum level of capital to be maintained by every insurer and during 2010-11, 50% of the total capital invested was used for funding accumulated losses by many insurers. Further, more capital influx will enable the players to expand and open new branches, which in turn will incur more operating expenses. Thus, it can be concluded that the insurers with more capital adequacy will not have any comparative advantage to improve their return on assets.
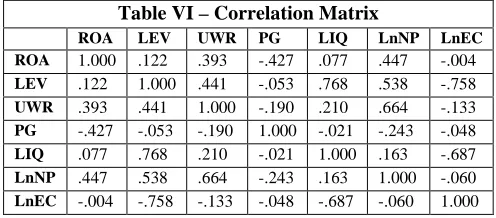
Multicollinearity Test: From the table VI, it is clear that no two independent variables are highly correlated and there is no multicollinearity problem.
VIII. LIMITATIONS OF THE STUDY Following are the limitations of this study:
1. Variables such as industry dynamics, regulatory environment, company's franchise and competitive market position could not be included.
2. Macro economic variables such as interest rate change, number of insurers, inflation could not be included.
IX. SCOPE FOR FUTURE RESEARCH
This study has considered only six independent variables relating to profitability of the life insurers in India. Future research studies may consider more variables, both industry specific, regulatory and macro-economic variables.
XI. CONCLUSION
This study led to the conclusion that profitability of life insurers is positively and significantly influenced by the size (as explained by logarithm of net premium) and liquidity. The leverage, premium growth and logarithm of equity capital negatively and significantly influence the profitability of Indian life insurers. This study does not find any evidence for the relationship between underwriting risk and profitability. In view of the untapped huge insurance market; unique regulatory environment comprising a hybrid model of regulation with competition; proposed approval to allow the players to tap the capital market for public issues; proposal to tie up with banks; and the proposal to increase the foreign direct investment, life insurers would shift their focus towards designing products providing long term savings and protection for the economy, through sustainable business models. This will help them to improve their profitability substantially in the core life insurance business than ever before.
___________
REFERENCES
[1] Adams, M., and Buckle, M., (2003), The determinants of corporate financial performance in the Bermuda insurance market, Applied Financial Economics, Routledge, 13, 133-143.
[2] Annual Report of Insurance Regulatory and Development Authority of India (IRDA), Available: www.irdaindia.org.
[3] Annual Reports of various life insurers for various years, Available: www.irda.gov.in/ADMINCMS/cms/NormalData_Layout.aspx?page =PageNo764&mid=31.1.
[4] Berger. AN, Cummins, JD, and Weiss, MA, (1997), The Coexistence of Multiple Distribution Systems for Financial Services: The Case of Property-Casualty Insurance, Journal of Business, 70, 515-46.
[5] Born H. P., (2001), “Insurer Profitability in Different Regulatory and Legal Environments”, Journal of Regulatory Economics, Vol. 19, Issue. 3, 211-237.
[6] Dragana Ikonić, Nina Arsić and Snežana Milošević, (2011), Growth Potential and Profitability Analysis of Insurance Companies in the Republic of Serbia, Chinese Business Review, 10 (11), 998-1008.
[7] Hifza Malik, (2011), Determinants Of Insurance Companies Profitability: An Analysis Of Insurance Sector Of Pakistan, Academic Research International, 1(3),315-321. Available: http://www.savap.org.pk/ journals/ARInt./Vol.1(3)/2011(1.3-32).pdf.
[8] Ho-Li Yang, (2007), The Effect of Financial Independence on the Performances of Life Companies: An Empirical Study, International Journal of Management, 24 (3), 522-540.
[9] Mark J. Browne, James M. Carson, and Robert E. Hoyt, (2003), Dynamic Financial Models of Life Insurers, North American Actuarial Journal, 5 (2), 11-26.
[10] McKinsey Report (2011), Available: http://www.Thehindu businessline.com/industry-and-economy/banking/article2692453.ece.
[11] Michael K. McShane, Larry A. Cox and Richard J. Butler, (2010), Regulatory competition and forbearance: Evidence from the life insurance industry, Journal of Banking & Finance, 34, 522-532.
[12] Mike Adams, (1996), Investment Earnings and the Characteristics of Life Insurance Firms: New Zealand Evidence, Australian Journal of Management, 21 (1).
[13] Naveed Ahmed, Zulfqar Ahmed,Ahmad Usman, (2011), Determinants of Performance: A Case of Life Insurance Sector of Pakistan, International Research Journal of Finance and Economics, Issue 61, 123-128.
[14] Paul J. M. Klumpes, (2005), Managerial Use of Discounted Cash- Flow or Accounting Performance Measures: Evidence from the U.K. Life Insurance Industry, The Geneva Papers, 30, 171-186.
[15] Public Disclosures of Indian Life Insurers, Available: http://www.irda.gov.in/ADMINCMS/cms/frmGeneral_NoYearList.a spx?DF=AR&mid=11.1.
[16] Richard Spiller, (1972), Ownership and Performance: Stock and Mutual Life Insurance Companies, The Journal of Risk and Insurance, 39 (1), 17-25.
[17] Thomas Connelly, J., and Piman Limpaphayom, (2004), Board Characteristics and Firm Performance: Evidence from the Life Insurance Industry in Thailand, Chulalongkorn Journal of Economics, 16(2), 101-124.
[image:5.595.45.293.69.178.2]__________ Table VI – Correlation Matrix
ROA LEV UWR PG LIQ LnNP LnEC
ROA 1.000 .122 .393 -.427 .077 .447 -.004 LEV .122 1.000 .441 -.053 .768 .538 -.758 UWR .393 .441 1.000 -.190 .210 .664 -.133 PG -.427 -.053 -.190 1.000 -.021 -.243 -.048 LIQ .077 .768 .210 -.021 1.000 .163 -.687
LnNP .447 .538 .664 -.243 .163 1.000 -.060
Appendix – List of Indian Life Insurance Companies S.No. Abbreviation Name of the Company
Public Sector 1 LICI Life Insurance Corporation of India
Private Sector 2 AVIVA Aviva Life Insurance Company 3 BAJAJ Bajaj Allianz Life Insurance Company 4 BHARTI Bharti Axa Life Insurance Company 5 BSLI Birla Sun Life Insurance Company
6 CANARA Canara HSBC OBC Life Insurance Company 7 DLF DLF Pramerica Life Insurance Company 8
EDEL Edelweiss Tokio Life Insurance Company
(started in 2011-2012 only and not taken for this study) 9 FUTURE Future Generali Life Insurance Company
10 HDFC HDFC Life Insurance Company
11 ICICI ICICI Prudential Life Insurance Company 12 IDBI IDBI Fortis Life Insurance Company 13 INDFIR India First Life Insurance Company 14 ING ING Vysya Life Insurance Company 15 KOTAK Kotak Mahindra Life Insurance Company 16 METLIFE Met Life Insurance Company
17 MNYL Max New York Life Insurance Company 18 RELIANCE Reliance Life Insurance Company 19 RELIGARE Aegon Religare Life Insurance Company 20 SAHARA Sahara Life Insurance Company
21 SBI SBI Life Insurance Company 22 SHRIRAM Sriram Life Insurance Company