Application of VIKOR Approach for Multi
Response optimization of MIG Welding Process
Parameters
Rishikant Tiwari1, R.P. Kori2 1,2
Department of Mechanical Engineering, Madhav Institute of Technology & Science,Gwalior, 474005, Madhya Pradesh, India
Abstract: The Low Carbon steel is widely used material in various industries like automobile industry, construction Industry as well as in shipping Industry. This study focuses on the optimisation process parameters of Metal Inert Gas (MIG) welding on low carbon steel by using VIKOR approach. For this study input parameters considered are welding current, voltage, gas flow rate and wire feed rate and analysing their effect on three quality characteristics tensile strength, bending strength and hardness of the weldments. Taguchi L9 Orthogonal array has been used for design of experiments (DOE). Three specimens
are fabricated (for tensile, bending, and hardness) for each experimental run are fabricated for the measurement of respective strength and hardness. All the reponses are normalized according to higher-is-better. The experiment investigation is done and VIKOR index is found. Finally, the analysis of VIKOR index using S/N ratio is carried out to find out the most significant factors and predicted the optimal parametric combination for higher tensile, bending strength and hardness. Confirmation test is done to verify the improvement in quality characteristics. It is found that determined optimal parametric combination gives lowest VIKOR INDEX, which indicates the multi response of MIG welding is improved greatly through this study.
Keywords: Metal Inert Gas (MIG) Welding, Low carbon steel, VIKOR method, S-N ratio.
I. INTRODUCTION
strength, bending strength and hardness of the weldments in MIG welding of AISI1008 low Carbon steels and estimate the optimal combination of the welding parameters for the maximisation of the tensile, bending strength and hardness of the weldments by application of the VIKOR approach coupled with signal to noise ratio methodology.
II. METHODOLOGY
A. VIKOR Method
The MCDM method is very popular technique widely applied for determining the best solution among several alternatives having multiple attributes or alternatives. A MCDM problem can be represented by a decision matrix as follows [9]:
1 2
1 1 1 1 2 1
2 2 1 2 2 2
1 2 . . . . . . . . . . . . . . . . . . . . . . . . . . . . . . . . n n n
m m m m n
C x C x C x
A x x x
A x x x
D
A x x x
(1)
Here,
A
i representsith
alternative,i
1, 2,...,
m
;Cx
jrepresents thejth
criterion,j
1, 2,...,
n
; andx
ijis the individual performance of an alternative. The procedures for evaluating the best solution to an MCDM problem include computing the utilities of alternatives and ranking these alternatives. The alternative solution with the highest utility is considered to be the optimal solution.The following steps are involved in VIKOR method:
1) Step 1: Representation of normalized decision matrix The normalized decision matrix can be expressed as follows:
ij m n
F
f
(2)Here, 2 1 ij ij m ij i x f x
, i1, 2,..., ;m and
x
ijis the performance of alternativeA
i with respect to thejth
criterion.2) Step 2: Determination of ideal and negative-ideal solutions
The ideal solution
A
*and the negative ideal solutionA
are determined as follows:
* ' * * * *
1 2
( m a x i j ) ( m i n i j ) , 1, 2 , ..., , , .... j, ... n
A f j J o r f j J i m f f f f
(3)
'
1 2
( m in ij ) ( m a x i j ) , 1, 2 , ..., , , .... j , ... n
A f j J o r f j J i m f f f f
(4)
where, = = 1,2, … . . , ,
= = 1,2, … . . , ,
3) Step 3: Calculation of utility measure and regret measure
The utility measure and the regret measure for each alternative are given as
* * 1 n j ij i jj j j
f
f
S
w
f
f
(5)
* * j ij i j j j j f fR Max w
f f
(6)
where,
S
i andR
i, represent the utility measure and the regret measure, respectively, andw
jis the weight of thejth
criterion.
* *
*
1
*i i
i
S
S
R
R
Q
S
S
R
R
(7)
where,
Q
i, represents theith
alternative VIKOR value,i
1, 2,...,
m
; *( )
ii
S
Min S
;( )
i iS
Max S
; *( )
ii
R
Min R
;( )
ii
R
Max R
and
is the weight of the maximum group utility (usually it is to be setto 0.5). The alternative having smallest VIKOR value is determined to be the best solution.
B. Procedure Adopted For Optimization 1) Step 1: Estimation of quality loss
Taguchi defined quality loss estimates for responses using Lower-the-better (LB) and Higher-the-better (HB) criterion are given bellow.
(a) For a lower-the-better (LB) response
2 1 1
1
r ij ijk kL
k
y
r
(8)(b) For a higher-the-better (LB) response
2 2
1
1
r1
ij
k ijk
L
k
r
y
(9)Here,
L
ij is the quality loss associated with thejth
response in theith
experimental run;y
ijkis the observedkth
repetitiondatum for the
jth
response in theith
experimental run;r
is the number of repetitions for each experimental run.k
1,k
2 arequality loss coefficients,
i
1, 2,...,
m
;j
1, 2,...,
n
;k
1, 2,...,
r
.Step 2: Calculation of normalized quality loss (NQL) for individual responses in each experimental run. The NQL can be obtained as follows:2 1
, 1, 2, ..., ; 1, 2, ..., .
ij ij m ij i L
f i m j n
L
(10)
Here
f
ijrepresents the NQL of thejth
response in theith
experimental run.2) Step 3: Evaluation of ideal and negative-ideal solutions.
A smaller NQL is preferred, so the ideal and negative-ideal solutions which represent the minimum and maximum NQL of all experimental runs are as follows:
* * * * *
1 2
min
ij1,2,...,
, ,..., ,...,
j nA
f i
m
f f
f
f
(11)
max
ij1,2,...,
1, ,..., ,...,
2 j n
A
f i
m
f f
f
f
(12)3) Step 4: Calculation of the utility and regret measures for each response in each experimental run using equation (5) and (6) respectively.
4) Step 5: Calculation of VIKOR index of the
ith
experimental run. SubstitutingS
iandR
iinto equation (7) yields theVIKOR index of the
ith
experimental run as follows. A smaller VIKOR index produces better multi-response performance. 5) Step 6: Determination of optimal parametric combinationThe multi-response quality scores for each experimental run can be determined from the VIKOR index obtained in step 5, and the effects of the factors can be estimated from the calculated VIKOR values. The optimal combination of factor-level called optimal parametric combination is finally determined, in view of the fact that a smaller VIKOR value indicates a better quality. Signal to method is to be applied finally to evaluate this optimal setting by minimizing the VIKOR index. Optimal result is to be verified through confirmatory tests.
C. Signal To Noise Ratio Calculation
S/N = −10 log (1 ∑ ) (13)
_where y2 is average of observed data y, and n is the number of observation
III. EXPERIMENTAL SETUP AND DATA COLLECTION
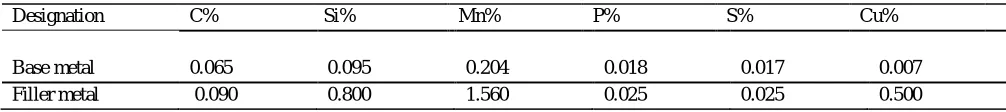
[image:4.612.53.556.295.351.2]The experiment were conducted using a MIG welding setup (manufactured by “TECHNOLOGY Promoters (I) Pvt. Ltd. MIG 400”) shown in figure. 1. Consumable electrode wire of 1.2 mm copper coated Mn-Si double deoxidized is used for depositing the weld beads on the AISI 1008 low carbon steel . Chemical composition of base and filler metal is shown in table 1. Co2 gas used as a shielding gas during the experiment. Test pieces of size 150mm x 30mm x 6mm were cut from low carbon steel plates. Double V-shaped grove butt weld joint is prepared. To evaluate the quality of the MIG welds four control factors welding current, voltage, gas flow rate and wire feed rate with three levels are considered for study their effect on three responses tensile strength, bending Strength and Hardness. The value of control factors with their level is shown in table 2. The experimental run is carried out as per Taguchi L9 Orthogonal array Universal testing machine(UTM) of capacity 60,000kgf and Rockwell hardness tester (manufactured by Fuel instrument & engineers PVT. LTD.) used for tensile test and hardness test respectively. Bending strength is also recorded by UTM. Table 3 shows the value of values of measured responses. The specimens after testing is shown in figure 2
Table 1 Chemical composition
Designation C% Si% Mn% P% S% Cu%
Base metal 0.065 0.095 0.204 0.018 0.017 0.007
Filler metal 0.090 0.800 1.560 0.025 0.025 0.500
Table 2 Control factors with their level
Parameters Unit Notation Level 1 Level 2 Level 3
Current Amp. A 80 100 120
Voltage Volt. V 22 26 30
Gas flow rate Lit./min Gf 10 13 16
[image:4.612.73.511.365.702.2]Wire feed m/min Wf 8 10 12
Table 3: Response data as per Taguchi L9 Orthogonal array design
L9 OA Response value related to weld quality
S. No.
A V Gf Wf Ultimate Tensile Strength
(MPa)
Bending Strength (KN)
Hardness (HRB)
Test 1 Test 2 Test 3 Average
1 1 1 1 1 428 5.821 72.1 75.4 78.3 75.2
2 1 2 2 2 370 4.220 73.9 70.4 76.8 73.7
3 1 3 3 3 375 5.810 74.5 70.3 80.1 74.9
4 2 1 2 3 330 5.420 75.6 69.4 74.3 73.1
5 2 2 3 1 320 5.810 70.2 74.5 71.7 72.1
6 2 3 1 2 350 5.771 75.3 78.6 64.5 72.8
7 3 1 3 2 390 4.680 80.5 70.3 75.2 75.3
8 3 2 1 3 405 4.321 70.8 72.5 70.6 71.3
9 3 3 2 1 425 5.310 79.6 75.4 70.8 75.2
IV. OBSERVED DATA COLLECTIONS AND RESULTS
A. Multi-Criteria Decision Making In MIG Welding Using VIKOR Approach
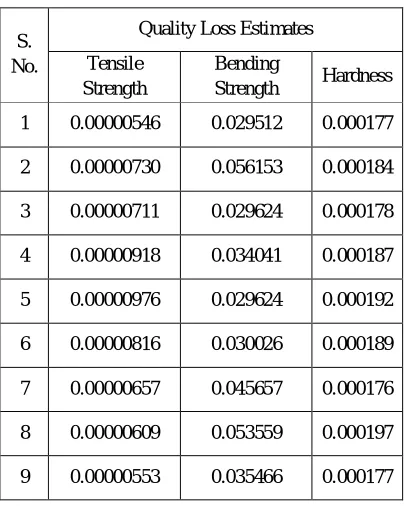
Quality loss estimates for the responses have been calculated using eq (8) and furnished in table 4. For all the responses higher the better criteria is selected. Normalized quality loss estimates have been calculated using eq (10) and furnished in table 5. Utility measure of individual response is shown in table 6. It has been assumed that all responses are equally important. Therefore, 33.33% weightage has been assigned to each response. Utility and regret measure for each alternative have been shown in Table 7. VIKOR index of each alternative have been presented in Table 8. Analysis of VIKOR index has been done using signal to noise ratio (S/N ratio) and predicted optimal parameter setting found.
Table 4: Calculated Quality loss estimates
S. No.
Quality Loss Estimates
Tensile Strength
Bending
Strength Hardness
1 0.00000546 0.029512 0.000177
2 0.00000730 0.056153 0.000184
3 0.00000711 0.029624 0.000178
4 0.00000918 0.034041 0.000187
5 0.00000976 0.029624 0.000192
6 0.00000816 0.030026 0.000189
7 0.00000657 0.045657 0.000176
8 0.00000609 0.053559 0.000197
[image:5.612.205.407.466.719.2]Table 5: Normalised Quality loss estimates
The ideal and negative ideal solution which represents the minimum and maximum NQL of all experimental runs are calculated by using Eq. (3) and Eq. (4) are as follows:
∗= min = 1,2, } = { ∗, ∗} = {0.24636, 0.248975, 0.319013}
= max = 1,2, } = { , } = {0.440672, 0.473725,0.355811}
Table 6: Utility measure of individual response Table 7: Utility measure and regret measure of individual alternatives S.
No.
Normalised Quality Loss Estimates
Tensile Strength
Bending
Strength Hardness
1 0.246336 0.248975 0.319862
2 0.329618 0.473725 0.333015
3 0.320887 0.249919 0.32243
4 0.414369 0.287179 0.338504
5 0.440672 0.249919 0.347959
6 0.368365 0.253308 0.3413
7 0.296678 0.385177 0.319013
8 0.275109 0.451838 0.355811
9 0.249826 0.299201 0.319862
S. No.
Utility measure of each criteria (w=0.33)
Tensile Strength
Bending
Strength Hardness
1 0 0 0.007613
2 0.141397 0.333333 0.125568
3 0.126569 0.001386 0.030643
4 0.285329 0.056094 0.174792
5 0.333333 0.001386 0.259584
6 0.207201 0.006362 0.199867
7 0.085455 0.199985 0
8 0.048824 0.297863 0.333333
9 0.005886 0.073746 0.007613
S. No .
Utility measure(Si ) and regret measure (Ri) of individual
alternatives
Si Ri
1 0.007613 0.007613
2 0.600298 0.333333
3 0.158598 0.126569
4 0.516215 0.285329
5 0.594303 0.333333
6 0.41343 0.207201
7 0.28544 0.199985
8 0.68002 0.333333
[image:6.612.296.477.415.666.2]Table 8: VIKOR index of individual alternatives and S/N ratio for different VIKOR index
V. INTERPRETATION OF RESULTS
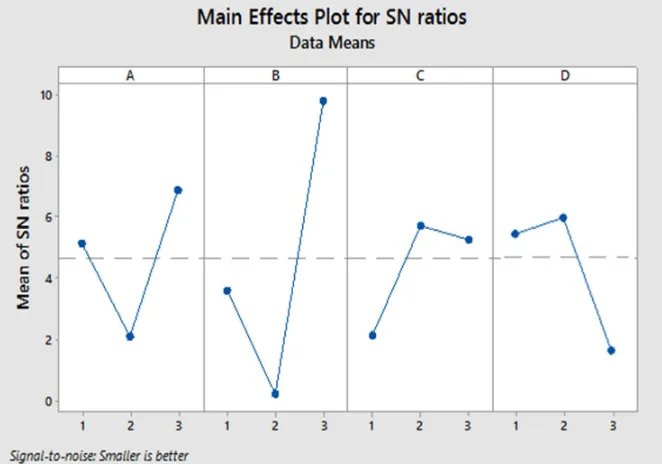
The optimum condition represents the combination of control factor levels that is expected to produce the best quality performance. The average S/N for each factor level indicate the relative effects of the various factors of MIG welding on quality characteristics tensile strength, bending strength and hardness of the weldments of low carbon steel. Taguchi analysis observes the higher value of mean S/N ratio is better quality characteristics. Therefore, based on the average S/N ratio for each factor level as illustrated in based on Fig.3 the optimum performance for combined tensile, bending strength and hardness was obtained at level 3 current (0.178 mm), level 3 for voltage (15 ̊ ), level 2 for gas flow rate (60 ̊ ), level 2 for wire feed (0.004mm). The optimum parametric combination for both tensile and flexural strength is A3V3Gf2Wf2. Table 9 is the response table for S/N ratio, which shows the most significant factor for tensile, bending strength and hardness. Voltage having rank 1, which is the most significant factor and gas flow rate having rank 4, which is the less significant factor.
Figure 3: Average S/N ratio by control factor for VIKOR index S.
No.
VIKOR Index
S/N Ratio
1 0 -
2 0.9608
0.3473
3 0.3187
9.9323
4 0.8208
1.7152
5 0.9579
0.3735
6 0.6097
4.2976
7 0.5320
5.4817
8 1
0.0000
9 0.1751
[image:7.612.144.475.482.714.2]Table 9: Average S/N ratio by control factor for VIKOR index
Level A V Gf Wf
1 5.1398 3.5985 2.1488 5.3756
2 2.1288 0.2403 5.7323 6.0783
3 6.8720 9.7881 5.2626 1.9825
Delta 4.7432 9.5478 3.5835 4.0958
Rank 2 1 4 3
VI. CONCLUSION
In this study, the effects of process parameters setting of Metal Inert Gas (MIG) welding for AISI 1008 low carbon steel material have been investigated. Four process parameters welding current, voltage, gas flow rate and wire feed rate at three levels are selected for experimental runs, and experiment is carried out according to L9 orthogonal array. Tensile, Bending strength and hardness are selected as a quality target, using VIKOR method the responses have been normalized and VIKOR index found. Signal to noise ratio is calculated by MINITAB-17 software and predicted optimal parameter setting found to be A3B3C2D2 and factor V (Voltage) is found most significant parameter. According to the predicted optimal parameter settings conformation test has been done and VIKOR INDEX 0.0001 is found as per methodology. VIKOR INDEX should be minimum so the successful implementation of VIKOR approach has been done.
REFRENCES
[1] N. Murugan and R.S. Parmar (1994). Effects of MIG process parameters on the geometry of the bead in the automatic surfacing of stainless steel. Journal of Materials Processing Technology, vol.41 381-398.
[2] K.M. Tay and C.Butler (1997). Modelling and optimizing of a MIG welding process- A case study using experimental designs and neural network. Quality and reliability Engineering international , vol.13, 61-70.
[3] I.S Kim and A. Basu (1999). A mathematical model of heat transfer and fluid flow in the gas metal arc welding process. Journal of material processing technology, vol.77, 17-24.
[4] M. Suban and J. Tusek. (2001). Dependence of melting rate in MIG/MAG welding on the type of shielding gas used. Journal of Material Processing Technology, 185-192.
[5] J.P Ganjigatti, Dilip Kumar Pratihar and A. Roy Choudhury (2007). Global versus cluster-wise regression analyses for prediction of bead geometry in MIG welding process. Journal of Materials Processing Technology, 352-366.
[6] Erdal Karadeniz, Ugur Ozsarac and Ceyhan Yildiz (2007). The effect of process parameters on penetration in gas metal arc welding processes. Materials and desighn, ELSEVIER , 649-656.
[7] A.S. Shahi and Sunil Pandey (2008). Modelling of the effects of welding condition on dilution of stainless steel claddings produced by gas metal arc welding procedures. Journal of Material Processing Technology , 339-344
[8] Rakesh Malviya and Dilip Kumar Pratihar (2011). Tuning of neural networks using particle swarm optimization to model MIG welding process. Swarm and Evolutionary Computation, ELSEVIER , 223-235.