CFD Simulation of Heat Transfer of Liquid
Nitrogen in Heat Exchanger
Rahul Patel1, Rahul Paliwal2
1
PG Student, 2Associate Professor, L. D. College Of Engg ., Ahmedabad Gujarat, India.
Abstract: In the present work computational fluid dynamics (CFD) was used to investigate the two phase cross flow of liquid nitrogen and gaseous nitrogen in tub-in-tube heat exchanger. The behaviour of the flow was investigated in heat exchanger along the entire tube length. The study has further been expanded to see pressure drop and heat transfer phenomena in two phase flow of liquid nitrogen. ANSYS CFX and FLUENT modules are used to get the required simulation results. Simulation results are in good agreement with the data.
Keywords:CFD simulation, Heat transfer, Two-phase Flow, Flow boiling, Liquid nitrogen, Heat exchanger
I. INTRODUCTION
Applications of cryogenic can be found in variety of fields such as physics, biology, medicine, engineering and industry [1]. Liquid nitrogen, liquid hydrogen, liquid oxygen is cryogenic fluid. Liquid nitrogen is available easily so it has wide use in industries and also for conducting different experiments. When liquid nitrogen flows through tube gets heated and under goes a phase change from liquid to vapour. It is called flow boiling which has two phase flow. In case of cryogenic fluid, flow boiling has a high heat transfer rates which makes it widely applicable for such as to cool devices like rocket motors and nuclear reactors. There are many studies on the refrigerants and also some on liquid nitrogen. But most of them are done mainly for micro channels. Kandlikar [2] and thome [3] has reviewed that the flow boiling heat transfer is divided into nucleate boiling dominated region and convective boiling dominated region. Some studies [4], [5] of heat transfer, pressure drop and critical heat flux in a small tube with refrigerant as a working fluid show the heat transfer is influenced by the nucleate boiling. S. L. Qi et al. [6], [7] investigated the flow boiling of liquid nitrogen about heat transfer and pressure drop and found that ONB can be marked by the phenomena that mass flux drops suddenly while pressure drop increases. They also reported that for low mass quality region, heat transfer is governed by nucleate boiling and heat transfer coefficient is dependent on heat flux and pressure, but independent to mass flux. Whereas for high mass quality region, heat transfer coefficient is dominated by mass flux, insensitive to heat flux. Most of the researches about CFD simulation of two phase flow are related to water [8], [9], refrigerants [10], [11],[12] and other liquids. There are not much reported researches about CFD simulation for two phase flow of cryogenic fluids.
II. CFDSIMULATION
A. Operating Conditions and Physical Properties
[image:1.612.63.549.591.742.2]CFD simulations have been carried out to observe the heat transfer phenomena of flow boiling liquid nitrogen through tube-in-tube heat exchanger. Experimental data has been taken from the thesis [13]. Simulation has been conducted in the following conditions. The tube-in-tube heat exchanger has a length of 32.23 m. Both the tubes are made of copper. Liquid nitrogen flows through inner tube while gaseous nitrogen flows in annular space. Diameter and thickness of inner tube is 54.8mm and 2.77mm respectively. Diameter of outer tube is 108mm and thickness is 3.05mm respectively.
Table 1 shows other physical properties and operating conditions, which have been applied for the simulations. TABLE I Physical Property and Operating Conditions Used for Simulations
Parameter Value
LN2 Density
LN2 Viscosity
LN2 Specific heat capacity
LN2 Thermal Conductivity
GN2 Density
GN2 Viscosity
GN2 Specific Heat
GN2 Thermal Conductivity
Wall Density Wall Specific heat capacity Wall Thermal conductivity
777.72 Kg/m3
1.57 10-4 Pa-Sec
2.10 103 J/kg-K 0.02535 W/m K
8.748 Kg/m3
5.80 10-6 Pa-Sec
1.120 103 J/kg K
7.821 10-3 W/m K
7920 kg/m3
B. 3D Modelling and Meshing
[image:2.612.129.486.120.275.2]Here the profile has been generated for the length of the tube. The part file for each separate domain has been created in CREO. After that step file of assembly have been created and called for investigation in ANSYS CFX and FLUENT module.
Fig. 1 Copper Tube in Model Assembly
[image:2.612.126.487.334.505.2]Fig. 1 shows the outer tube which of coper material with its specified dimention. One another pipe is going to be assembled with this pipe. The fluids which in this case are liquid nitrogen and gasseous nitrogen are going to be poured inside the assembly of these parallel tubes.
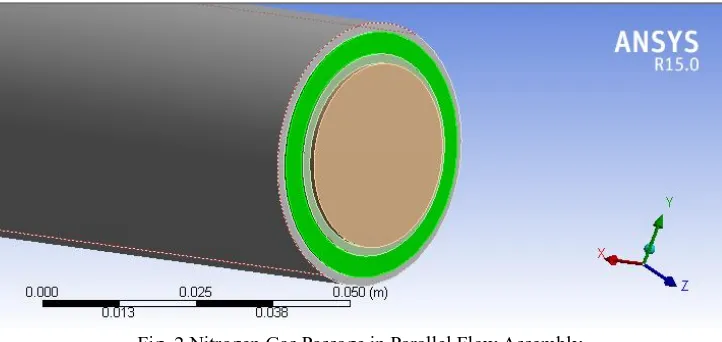
[image:2.612.129.484.552.720.2]Fig. 2 Nitrogen Gas Passage in Parallel Flow Assembly
Fig. 2 covers gaseous domain containing nitrogen gas. The nitrogen gas flows in between annular space between tubes. Here also the gas is flown with specific flow criteria of nitrogen gas shown in TABLE I.
Fig. 3 covers internal copper tube containing liquid nitrogen. The tubing walls are considered to be adiabatic and conductive by nature. Here temperature of gaseous nitrogen is greater than that of liquid. So heat will tend to flow from gaseous nitrogen towards liquid nitrogen through the inner tube. Therefore conductive nature of tube material is taken into account for the simulation.
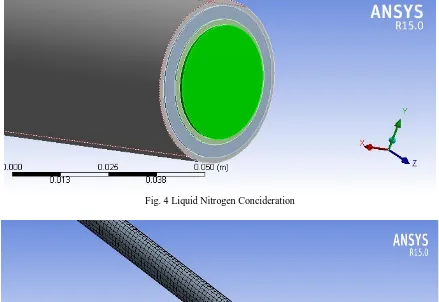
[image:3.612.87.534.107.710.2]Fig. 4 Covers liquid nitrogen within it which helps in transferring the heat between surfaces. Fig. 5 represents meshing of tube assembly. The elements used are finite shell elements for copper tubes. Hexahedral and tetrahedral elements are used to present fluid domains. TABLE II shows total number of nodes and elements generated by meshing.
[image:3.612.86.525.169.471.2]Fig. 4 Liquid Nitrogen Concideration
Fig. 5 Meshed Profile of Assembly of Fluid and Solid Interface Profile in Tube
TABLE II
Data Regarding Node and Elements
Nodes 777383
Elements 137202
III. RESULTSANDDISCUSSION
The pipe is too much large to observe so after defining all the four domains the constrained assembly has been cut in different small sections so that it can be more effective to observe central zone.
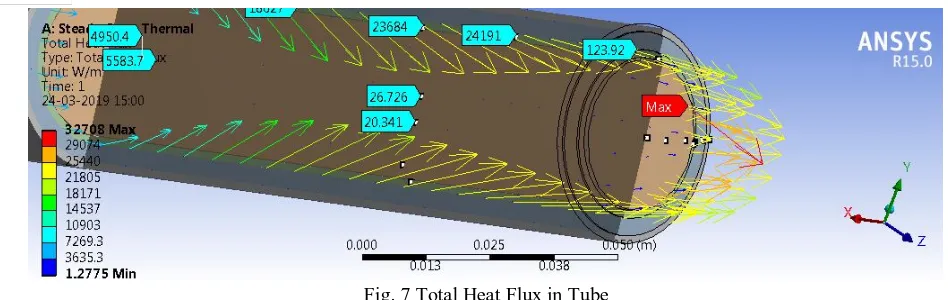
[image:3.612.88.528.278.564.2]Fig. 7 Total Heat Flux in Tube
[image:4.612.80.534.265.433.2]The fig. 8 represents tube heating with directional heat exchange. The minimum heat flux been found at the opening of tube, inside the flow region the heat flux varies between maximum to minimum value depending on contact interface.
Fig. 8 Directional Heat Flux
[image:4.612.80.532.476.625.2]Fig. 9 represents the heat flux inside the copper tube which clearly shows a conductive behaviour of heat transfer, from outside to inside. It also helps in supplying fluidic heat from out to inside direction of tube.
Fig. 9 Heat Flux Distribution in Tube
Fig. 10 Heat Distribution in Plane Central Cross Section
[image:5.612.132.481.313.477.2]Fig. 11 shows that Flow pressure profile is presented here in internal fluid domain and outer fluid domain. The flow velocity variation is not major in internal domain as the region pr cross section of flow is consistent. The outer flow profile shows major variation as the pressure profile changes more as the hollow profiles for observation is available.
Fig. 11 Flow Pressure Profile in Liquid and Gaseous Nitrogen
Fig. 12 shows temperature gradient vector plot for fluid domains inside inner tube and in-between inner and outer tube. The more dense vectors shows more interactive changes and the less dense regions represents even distribution of temperature at various zones of flow.
Fig. 12 Temperature Gradient Vector Observations
Fig. 13 Thesis vs CFD Result for Heat Tansfer Coefficient
IV. CONCLUSIONS
In this paper two-phase flow heat transfer of liquid nitrogen is investigated using ANSYS CXF module. The plotted results shows temperature variation representing the calculative result profiles. The mass density gradient plot also represents density variation in terms of vector density change. Simulation results differing from the data but shows same trend with it which can be improved with more physics considerations.
REFERENCES
[1] J. C. Erdmann, “Application of cryogenic techniques to materials research,” Washington, USA: Elsevier, vol. 9, pp. 411-421, December 1969.
[2] S.G. Kandlikar, “Fundamental issues related to flow boiling in mini-channels and micro-channels,” Experimental Thermal and Fluid science, vol. 26, pp. 389-407, 2002.
[3] J. R. Thome, “Boiling in micro-channel: a review of experiment and theory,” International Journal of Heat Fluid Flow, vol. 25, pp. 128-139, 2004.
[4] G. M. Lazarek, S. H. Black, “Evaporative heat transfer, pressure drop and critical heat flux in a small vertical tube with R-113,” International Journal of Heat Mass Transfer, vol. 25, pp. 945-960, 1982.
[5] T. N. Tran, M. W. Wambsganss, D. M. France, “Small circular and rectangular channel boiling with two refrigerants,” International. Journal Multiphase Flow, vol. 22, pp. 485-498, 1996.
[6] S. L. Qi, P. Zhang, R. Z. Wang, L. X. Xu, “Flow boiling of liquid nitrogen in micro-tubes: Part I – The onset of nucleate boiling, two-phase flow instability and two-phase flow pressure drop,” International journal of Heat and Mass Transfer, vol. 50, pp. 4999-5016, October 2007.
[7] S. L. Qi, P. Zhang, R. Z. Wang, L. X. Xu, “Flow boiling of liquid nitrogen in micro-tubes: Part II –Heat transfer characteristics and critical heat flux,” International journal of Heat and Mass Transfer, vol. 50, pp. 5017-5030, October 2007.
[8] C. K. Sandra, De Schepper, J. H. Geraldine, B. M. Guy, “CFD modeling of all gas-liquid and vapor-liquid flow regimes predicted by the Baker chart,” Chemical Engineering Journal, vol. 138, pp.349-357, 2008.
[9] Q. H. Mazumder, S. A. Siddique, “CFD Analysis of Two-Phase Flow Characteristics in a 90 Degree Elbow,” Mechanical Engineering University of Michigan-Flint 303 East Kearsley Street, Flint, MI 48502, USA, vol.3. pp. 165-175, 2011.
[10] P. Bhramara, V. D. Rao, K. V. Sharma and T. K. K. Reddy, “CFD Analysis of Two Phase Flow in a Horizontal Pipe – Prediction of Pressure Drop” International Journal of Mechanical and Mechatronics Engineering, vol.2, pp. 476-482, 2008.
[11] Bostjan Koncar, Eckhard Krepper, “CFD simulation of convective flow boiling of refrigerant in a vertical annulus,” Nuclear Engineering and Design, vol.238, pp. 693-706, 2008.
[12] Pramod Kumar, M. R. Nagraj, “CFD Analysis of Fluid Flow and Heat Transfer in Two Phase Flow Micro-channels,” International Journal of Engineering Research & Technology, vol. 2, pp. 2132-2143 August 2013.