ABSTRACT--This paper targets heterogeneous low power
communication circuits and Systems that will be used in the future generations’ hand-held devices (PDA’s, mobile phones). Those platforms will probably contain a few studies have emerged and considerable amount of on-chip memories. An optimized communication architecture will be required to interconnect them efficiently. Many communication architectures have been proposed in the literature: shared buses, bridged buses, segmented buses and more recently, Networks-on-Chip. Being battery-powered devices, the energy consumption of the platform is a critical issue. However, with the exception of buses, power consumption has been mostly neglected in interconnection networks. Only very recently have a few studies emerged in that domain.
The Power Aware Wireless Sensors (PAWiS) simulation framework becomes an essential tool to evaluate design and simulation of Wireless Sensor Networks (WSNs) models including Soft-Ware (SW) and Hard-Ware (HW) platforms. PAWiS is an OMNeT++ based discrete event simulator written in C++. It captures the node internals (modules) as well as the node surroundings (network, environment) and provides specific features critical to WSNs like capturing power consumption at various levels of granularity, support for mobility, and environmental dynamics as well as the simulation of timing effects. The design of integrated low-power wireless sensor nodes involves the convergence of many technologies and disciplines. Submicron complementary metal oxide semiconductor (CMOS) devices, micro-electro-mechanical system filters, on and off chip electromagnetic elements, sensors and dc-dc converters are some of the technologies that will enable pervasive systems such as wireless sensor networks. High system complexity requires the use of many simulation environments during design: algorithm simulators, behavioural and transistor-level circuit simulators, electromagnetic (EM) simulators and network simulators. It is shown that highly integrated, self-contained systems require multiple-domain simulations to uncover complex interactions between domains. In this paper we present a flexible and extensible simulation framework to estimate power consumption of sensor network applications for arbitrary HW platforms. Specific examples of block and system level design methodologies used in low-power wireless systems are presented here.
Index Terms— Power Aware Wireless Sensors, Wireless Sensor Networks, Soft-Ware, Hard-Ware, power consumption, low-power wireless systems.
1Faculty Polydisciplinary of Ouarzazate Ibn Zohr University- Agadir BP/638 Morocco
2Faculty of Sciences Department of Informatics Laboratory informatics and Applications Ibn Tofayl Kenetra Morocco
3Faculty of Sciences Department of Mathematic and Informatics Laboratory of Mathematic informatics and Applications Mohamed V University-Agdal Rabat BP/1014 Morocco
Krit_salah@yahoo.fr, jalal.doct@gmail.com, elhajji@fsr.ac.ma
1. INTRODUCTION
The advances in distributed computing and micro-electronic systems have fueled the development of smart environments powered by wireless sensor networks (WSNs). WSNs face challenges like limited energy, memory, and processing power and require detailed study before deploying them in the real world. Analytical techniques, simulations, and test beds can be used to study WSNs.
The proposed PAWiS simulation framework [1, 2] assists in developing, modeling, simulating, and optimizing WSN nodes and networking protocols. It particularly supports detailed power reporting and modeling of wireless environments. A typical WSN node may comprise various types of sensors (e.g., power consumption, humidity, strain gage, pressure), a central processing unit (CPU) with peripherals, and a radio transceiver. The simulation covers the internal structure of these nodes as well as communication among them. Sensor nodes forming a network communicate with each other via an ad hoc multi hop network. The range of applications that can be simulated covers many domains such as building automation, car-interior devices, car-to-car communication systems, container monitoring and tracking, and environmental surveillance.
In previous research performed at the Vienna University of Technology [3], several weaknesses of current WSN nodes were identified. These include the wakeup problem (i.e., how to wakeup a sleeping node), the voltage matching and power supply problem, the fairly long oscillator startup time, and other hardware related problems. However, overall efficiency also strongly depends upon the application and its interaction with other nodes and the environment.
Here, communication protocols play an important role, but considering the different layers of protocols independently and not taking into account adjacent layers as well as the hardware and environment, improvements can only be suboptimal [4]. PAWiS explicitly supports cross-layer design to exploit the synergy between layers. Several aspects regarding power aware wireless sensors are emphasized and directly supported by the PAWiS framework. The PAWiS framework hence helps to capture the whole system in one simulation and extracts power consumption figures from software and hardware modules uncovering leakages in early design stages. The main contributions of this work are as follows.
Salah-ddine Krit1, Jalal Laassiri2, Said El Hajji3
Modeling and Simulation Methodology
Techniques for Advanced Low Power
(i) One of the main contributions is to equip the user to program models of a wide variety of abstraction,
(ii) Another contribution is to model the internals of WSN nodes as well as the communication between them.
(iii) one of the main contributions also is an elaborate power simulation with any level of accuracy which can still be balanced with complexity. The simulated power consumption can depend on the supply voltage, for example, for a nearly empty battery when supplying a microcontroller that operates at very low voltages. In WSN nodes, components with different supply voltages are combined resulting in the need for low dropout regulators (LDOs) and DC/DC converters. The PAWiS framework allows modeling this hierarchical supply structure as well as the efficiency factor of the converters.
(iv) Powerful analysis and visualization techniques are provided to evaluate the simulation results and derive a path to optimization.
(v) The RF communication is modelled according to real world wave propagation phenomena while still maintaining an efficient
simulation. It includes interferers, noise, and attenuation due to distance to influence the bit error ratio of communication links.
2. STRUCTUREOFPAWIS
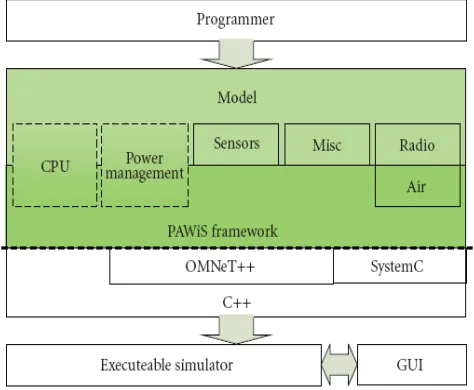
[image:2.595.48.285.428.623.2]The PAWiS framework is based on the OMNeT++ [5] discrete event simulator and the C++ programming language. Figure 1 depicts the structure of the framework from the users view. The model programmer mostly interacts with the framework and C++. Additionally basic knowledge of concepts of OMNeT is required to comprehend the simulation process.
Figure 1. Structure of the PAWiS simulationframework.
The node compositions as well as the network layout are specified in configuration files. Completed models can be compiled (optionally with a GUI based on Tcl/Tk) to an executable simulator. With the optional GUI the workflow and communication of the model can be observed during the simulation. Additionally a log file with power and timing profile is generated for post-simulation analysis.
2. RELATEDWORK
There exist numerous possibilities for reduction of the low power communication circuits and systems in wireless networks.
To have credible results through simulation, the choice of models and the simulation environment is very important. Key properties for WSN simulators must include a way to capture energy consumption at any level of abstraction, powerful scripting language, graphical user interface (GUI) support to animate, trace, and debug, and the ease to integrate new modules. Some of these key properties are discussed in [6].
3. DESIGNTOOLS
NS-2 simulator: NS-2 [3], [8], [11], perhaps, is the most popular general purpose network simulator. NS-2 supports simulation for widely used IP network protocols. These include TCP, routing and multicasting protocols for conventional wired and wireless networks. NS-2 has a highly extensible object-oriented architecture with discrete-event engine. Its object-oriented model allows extension of simulation functionality by adding customers components and libraries. The simulation in NS-2 environment is based on a combination of C++ and OTcl [7] languages where protocols are implemented in C++. OTcl is used as a scripting language to describe and control the simulation process. The complexity of NS-2 object-oriented model creates substantial dependencies and execution overheads. It makes impossible to scale simulation for a large number of network units, which is inherent to WSNs. While object-oriented model is advantageous in terms of extensibility, it is a restriction for scalability and performance.
Besides, NS-2 does not provide representation for the HW network components.
OMNet++ simulator: Like NS-2, OMNet++ [6] provides deep analysis of network activities at the packet layer. Besides, OMNet++ provides a GUI front-end for simulation and debugging processes. It has component based architecture with a discrete-event simulation kernel. It exploits modules and channels to implement and connect simulation components, where components are connected in a hierarchical fashion via generic interfaces (gates). OMNet++ has extension for sensor network simulation, called SenSim [8]. It represents sensor node as modular hierarchical structure of simple OMNet++ components. This simulator provides more scalability and runs faster than NS-2. However, despite the apparent benefits of OMNet++ and SenSim, there is no precise and accurate HW model of sensor node. It, in turn, does not allow to study sensor networks from an energy perspective.
command-event mechanism. By changing a small number of TinyOS components, TOSSIM simulate test the behavior of the low-level hardware. It includes models for CPUs, analog-to-digital converters (ADCs), clocks, timers, flash memories and radio components. The network communication over the wireless channel is abstracted as a directed graph, where vertexes and edges represent nodes and links between them, respectively.
TOSSIM simulation architecture provides high level of scalability and execution speed for the networks with large number of sensor nodes. However, the abstract HW model of TOSSIM does not capture low-level details of timings and interrupts, which can be important for precise power analysis. In addition, simulation is supported only for the single HW platform (Micaz [2]). Obviously, it largely restricts the applying scope.
VIPTOS and Visual Sense: VIPTOS (Visual Ptolemy and TinyOS) is a graphical development and simulation environment for TinyOS based WSN applications [10]. VIPTOS bridges together the Visual Sense [11] simulator and the TinyOS framework. Visual Sense is a Ptolemy II [9] based graphical simulation environment designed for WSNs. It exploits the actor-oriented computational model of Ptolemy II, a general modeling framework for heterogeneous embedded systems. Visual Sense defines actor-oriented models for sensor node subsystems and communication channels. However, VIPTOS does not provide accurate HW representation of sensor node. Substantially, it focuses more on algorithmic and application domains. Additionally, VIPTOS has been integrated only with the first version of TinyOS, which is not currently supported.
AVRORA: AVRORA [12], like TOSSIM, is one of the widely used WSN simulation tool. It exploits cycle accurate instruction-by-instruction manner to run code.
AVRORA runs actual applications without the need to specially adapt it for simulation. AVRORA represents each HW component as corresponding object classes thus as classes of CPUs, Timers, flash memories, ADCs and off-chip components such as sensors. The HW model of a single sensor node is the combination of such objects in a hierarchical manner. The CPU object contains the simulation engine with the event queue for the entire node. This architecture allows node replication for network simulation, where each node is run as independent computational entity. However, AVRORA supports solely AVR MCU [1] cores and does not provide any extensions for others CPU architectures.
4. POWERCOMSUMPTION
Simulation of the power consumption and therefore the requirement for the energy storage is mandatory due to the battery driven nature. Especially when aspects such as energy harvesting are considered, which have the possibility of extracting only small amounts of energy from environmental sources, a good understanding of the energy requirements is needed.
Energy consumption is a critical issue for hand-held devices as battery life is very limited. Moreover, heat removal becomes a critical problem in the technology as heat dissipation systems are already reaching their limits today. The power consumption of a CMOS circuit has two components: dynamic and static.
Ptot = Pdyn + Pstat (1.1)
4.1 Dynamic power consumption
Dynamic power consumption occurs when a gate is switching from one state to another. The switching energy corresponds to the amount of energy required to charge the equivalent capacitance of the wiring and the gates connected to its output. Also, a reduced amount of energy is spent when the complementary transistors are simultaneously conducting during the switching transient. This energy is referred to as short-circuit energy and can be neglected compared to the switching energy.
Pdyn = Pshort circuit + Pswitching (1.2) 4.2 Static power consumption
Static power consumption is due to the existence of small leakage currents Ioff that flow through transistors in cut-off mode. [14].
Pstat=VDDIoff (1.3) Precisely, CMOS technology has been initially chosen mainly because its static power consumption was very low compared to other technologies.
However, as the industry is moving to Deep Sub Micron technologies, leakage power consumption of CMOS circuits cannot be neglected anymore [15].
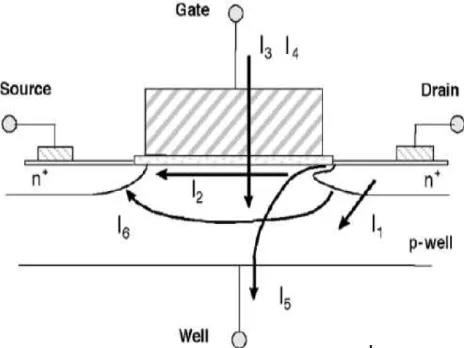
[image:3.595.310.542.521.695.2]Leakage current appears by complex mechanisms. It can be basically viewed as a sum of several current contributions [16], [15] (see figure 2 and figure 3). Not all leakage currents correspond to pure static energy consumption: currents I1 and I3 occurs both in the on and off transistor states.
Figure 2: Leakage current contributions: junction leakage current (I1), subthreshold leakage current (I2), gate- oxide tunneling current (I3),
Figure 3: Leakage power consumption contribution is increasing rapidly relatively dynamic power consumption [17]
5. DESIGNMETHOLOGY
To design a WSN and its nodes, the functional specification is defined. For a full optimization, the work flow is a cyclic application of the following steps.
(a) Every node typically consists of multiple sub modules. In this step, the node structure is defined and for every module type a certain implementation is chosen (composition). Initially, the modules only need to meet minimum functional requirements. For instance, for the aforementioned TPMS node, the user chooses a CPU, a pressure sensor, an AD converter, a timer, an RF transmitter, and memory. Additionally, software modules like the network stack and sensor handling are required. (b) The modules chosen in the previous step are integrated. Their interfaces have to be adopted and their functions must be coordinated. For example, the chosen pressure sensor might require special treatment for its power-on sequence, which must be implemented accordingly in the module which operates it.
(c) The modules are configured, that include setting values for the clock frequency of the CPU, the resolution of analog-to-digital converters (ADCs), and so forth.
(d) In the previous steps, a fully functional model of a node and of the network was set up and is simulated in the current step.
(e) The simulation results are evaluated. This includes the verification of the function, analysis of the power consumption and timing, and detection of potential for further optimization.
(f) The issues identified in the previous step are considered for a refinement of the models as well as the design. Examples are increasing the detailedness and accuracy of power consumption and timing, dividing the functionality into more elaborate modules, configuration changes, and even a modification of the node composition by exchanging module implementations. The chosen pressure sensor might consume too much energy in every measure cycle due to its long-lasting power-up sequence, and hence should be exchanged by a sensor with faster startup. Another example is the physical layer model (including the RF transceiver) which might need a refinement of the power consumption reporting during intermediate states (e.g., when switching from transmit to receive mode). With the refined node implementation, the procedure is started over again, until the optimization goal is achieved.
These refinement cycles are the main track to enhance the development and design [3]. After completing the optimization process, the final outcome comprises the
verified function, the architecture of the node, the implementation details, and the power specification of every module.
The module library is particularly intended for the composition and integration of modules to a node. It provides a collection of multiple module implementations for every module type which can be combined in numerous ways. The integration effort is minimized because these modules conform to the interface specification.
6. CASE STUDY
In this section we describe the case study simulation of an abstract WSN application mapped to a mobile phone platform. In particular, we have studied the influence of parameters of the real device and application behavior on the power consumption.
6.1 The Application
A typical application for WSN can be divided into several standard functional stages in which it first gathers some controlled quantity while sensing the environment, processes this data and forms the packets that are then sent to a base station. The case study presented in this paper follows this standard scenario. It performs a periodical sensing of the environmental temperature, with the period equal to one second. An on-board ADC is used to convert the analog value into its digital representation. When the converted data are ready, the application turns on the transceiver (radio), composes the network packet, waits till the radio is in the transmission mode and sends the data to an abstract base station. After the data transmission is over, the radio is switched to the Power Down state where it stays until it is reawaken in the following period triggered by means of a timer. The interrupt handler of the timer used to trigger the ADC conversion is as follows:
void _interrupt Timer_ICR(void* ptr){ SysTop* pSys = (SysTop*)ptr; pSys->Adc.RunConvertion(); }
Here, “pSys” represents a particular HW platform that includes the “ADC” component providing the “RunConvertion()” service.
The communication algorithm (a network protocol) is abstracted from the real MAC and routing protocol implementation by annotating the functionality of a network stack with time needed to perform abstract operations with data packets. Basically we focus on the HW state transitions during the execution process. The current consumption waveform we obtained is presented as a sequence of pulses. An example of a zoomed in single pulse is depicted in Figure 4.
7. THEPROPOSEDSPICECOMPATIBLEBATTERY MODEL
In our work we have implemented the electrical battery model proposed by Chen [18] using PSpice [19].
The charging device can be either a charger with a low– output impedance regulated or non-regulated voltage source of 20V absolute maximum or a device plugged in the USB wall outlet (figure 5). The device plugged in the USB wall outlet can be either a USB driver with a low-output impedance dc voltage source from 4.4V to 5.25V or a carkit with a low-output impedance dc voltage source from 4.75V to 5.25V. Two external PMOS power transistors, driven by ICTLAC2 and ICTLUSB2 of the TWL3029 device, control the choice between the charger input and the USB input. Their role is also to prevent reverse leakage current from the main battery in case of one of the two charging devices is connected to the mobile phone without delivering any voltage at its output. Two external PMOS power transistors driven by ICTLAC1 and ICTLUSB1 of the TWL3029 device, control the current flowing from the charging device to the main battery.
The main function of the battery charger interface is the charging control of both 1–cell Li–Ion battery or 3–series Ni–MH/Ni–Cd cell battery with the support of an external μC. The external μC enables the charge by forcing the programming bit CHEN to 1. The external μC select the charging device either by forcing the programming bit ACPATHEN to 1 for a charge with a charger or by forcing the programming bit USBPATHEN to 1 for a charge with the USB. The hardware forbidden having ACPATHEN and USBPATHEN forced to 1 in the same time. The charging scheme for the Li–Ion battery is constant current first (typical current is 1xC) followed by constant voltage charging once a certain voltage threshold is reached (4.2 V typical). Charging is stopped when the charging current at constant voltage has decreased down to C/20 (typical). Because the BCI works in the linear mode, the power dissipation around the external components must be taken into account.
The charging scheme for the Ni–MH/Ni–Cd is constant current only. Charging is stopped when ΔV across battery terminals versus time inverts from positive to slightly negative (typically, a few mV per cell) or by any other criteria involving battery voltage or battery temperature. Ni– MH/Ni–Cd 3–cell battery voltage can reach 5.5 V at the end of a charge cycle.
In case of power dissipation problems around the external components, pulsed charge with a charger is also supported. The external μC enables the pulsed charge by forcing the programming bit PWMEN to 1. The hardware forbidden having the pulsed charge and the linear charge enable in the same time.
A Pulsed Width-Modulated signal controls the externals PMOS transistors driven by ICTLAC1 and ICTLAC2 of the TWL3029 device. The frequency of the PWM signal is 1Hz typical. In addition to the above charging schemes, the pre-charge is systematically applied when a battery pre-charger or a carkit is connected to a switched–off mobile phone: a constant charging current (typically C/20) is applied automatically to the battery from PCHGAC or PCHGUSB of the TWL3029 device when the battery voltage is lower
[image:5.595.352.507.280.549.2]than 3.6 V. A specific pre-charge mode enables a full charge with the charger when the battery voltage is higher than 2.0V. The BCI can also supply active portable accessory devices without any own supply by forcing the programming bit ACCSUPEN to 1. In this mode, the two external PMOS transistors driven by ICTLAC1 and ICTLAC2 works like two closed switches that connect the battery voltage to the device plugged into the charger wall outlet. The hardware forbidden having the accessory supply mode and the charge or pre-charge mode enable in the same time. When a charger is plug, the hardware disables automatically the accessory supply mode. A watch-dog timer, using the CK32K clock, allows to automatically stop the battery charge after a programmable delay, see register BCIWDOG. The watch-dog protection is automatically enabled when CHEN is forced to 1. In this case, the delay is set to 4.0s. The software can disable this protection by forcing WEN to 0.
Figure 4: Battery Charger Block Diagram
8. BATTERY MODEL VERIFICATION
current, where C is a nominal battery capacity. The last two cases refer to battery discharging with 0.1C and 0.2C current pulses (see Figure 4 and 5 respectively). 0.1C current pulses have a 1000 s pulse width for a 1200 s pulse period. 0.2C current pulses, in turn,
[image:6.595.50.289.144.581.2]have a 2000 s pulse width for a 2500 s pulse period. The pulses were generated by an HP 33220A programmable pulse generator which handled the Schrack RA 200006 relay to close and break the loop.
Figure 5. Battery discharging with continuous 23 mA current
Figure 6. Continuous battery charging (0.1C)
Figure 5: Battery Charger Block Diagram
9. CONCLUSION
In this paper, we have presented a power aware discrete event simulation framework for wireless sensor networks and nodes.
The realization of true Ambient Intelligence is achievable only if advances are made in the hardware implementation of self contained wireless sensing. The modelling and simulation of the batteries, MEMS components, RF transceivers, network algorithms and low energy analog circuitry have been described.
Based on OMNeT++, it provides additional features to capture energy consumption (at any desired level), introducing a model for the RF communication (enabling complex topologies) and environmental effects with scripting capabilities. It provides a visualization tool to analyze and visualize energy usage. The framework focuses on extensibility and reusability by outlining a protocol
architecture and provides module library. The results show that the performance (execution time) of the PAWiS simulation framework is comparable with other frameworks and appropriate for the targeted field of application. The case studies showed that the modularization of OMNeT++ models combined with the abstract component concept of the PAWiS framework generally results in a reduced design-debug cycle.
The framework in its current version handles already much of the functionality and effects that are important for simulating wireless sensor networks. However, there are still some extensions and features that need to be enhanced or included. Performance of the simulation framework needs to be further enhanced, as the current results show scalability issues for larger networks.
REFERENCES
[1] Weber, W., Rabaey, J.M., and Aarts, A.: ‘Ambient intelligence’ (Springer, New York, NY, 2005)
[2] Rabaey, J., Ammer, J., Karalar, T., Li, S., Otis, B., Sheets, M., and Tuan, T.: ‘PicoRadios for wireless sensor networks: the next challenge in ultra-low-power design’. Proc. The Int. Solid-State Circuits Conf. (ISSCC), San Francisco, CA, 2002
[3] Roundy, S., Steingart, D., Frechette, L., Wright, P., and Rabaey, J.: ‘Power sources for wireless sensor networks’, Lecture Notes Comput. Sci., 2004, 2940, pp. 1–17
[4] Shah, R.C., Wietholter, S., Wolisz, A., and Rabaey, J.: ‘Modeling and analysis of opportunistic routing in low traffic scenarios’. IEEE Third Int. Symp. on Modeling and Optimization in Mobile, Ad Hoc, and Wireless Networks, (WIOPT), 2005
[5] Shah, R.C., Wietholter, S., Wolisz, A., and Rabaey, J.: ‘When does opportunistic routing make sense?’. IEEE Third Int. Conf. on Pervasive Computing and Communications Workshops (PerCom), 2005
[6] Varga, A.: ‘The OMNeTþþ discrete event simulation system’. European Simulation Multiconf., June 2001
[7] Kopke, A., Willig, A., and Karl, H.: ‘Chaotic maps as parsimonious bit error models of wireless channel’. IEEE Twenty-Second Annual Joint Conf. IEEE Computer and Communications Societies. (IEEE InfoCom), March 2003
[8] Boser, B.E., and Wooley, B.: ‘The design of sigma-delta analog to digital converters’, IEEE J. Solid-State Circuits, 1988, 23, (6), pp. 1298–1308
[9] Ruby, R., Bradley, P., Larson III, J., Oshmyansky, Y., and Figueredo, D.: ‘Ultra-miniature high-Q filters and duplexers using FBAR technology’. IEEE ISSCC, 2001, pp. 120–121
[10] Kwok, K., and Luong, H.: ‘Ultra-low-voltage high-performance CMOS VCOs using transformer feedback’, IEEE J. Solid State Circuits, 2005, 40, pp. 652–660
[11] Li, S.-S., Lin, Y.-W., Xie, Y., Ren, Z., and Nguyen, C.T.-C.: ‘Micromechanical “hollow-disk” ring resonators’. Technical Digest, IEEE MEMS Conf., 2004, Maastricht, The Netherlands, pp. 821–824 [12] Lakin, K.M.: ‘Thin film resonators and filters’. Proc. IEEE
Ultrasonics Symp., October 1999, pp. 895–906
[13] Que´vy, E.P., Bhave, S.A., Takeuchi, H., King, T.-J., and Howe, R.T.: ‘Poly-SiGe high frequency resonators based on lithographic definition of nano-gap lateral transducers’. 2004 Solid State Sensor, Actuator and Microsystems Workshop (Hilton Head 2004), Hilton Head Island, South Carolina, June 2004, pp. 360–363
[14] J. Adam Butts and Gurindar S. Sohi. A static power model for architects. In MICRO, pages 191–201. 2000.
[15] Ali Keshavarzi, Kaushik Roy, and Charles F. Hawkins. Intrinsic Leakage in Low-Power Deep Submicron CMOS ICs. In ITC, pages 146–155. IEEE Computer Society, 1997. ISBN 0-7803-4209-7. [16] S. Mukhopadhyay K. Roy and H. Mahmoodi-Meimand. Leakage
current mechanisms and leakage reduction techniques in deep-submicron CMOS circuits. In Proceedings of the IEEE. 2003. [17] T. Sakurai. Perspectives on Power-Aware Electronics, Plenary Talk
1.2,. In Proc. ISSCC. 2003, San- Francisco, CA, pp. 26-29. 2003. [18] M. Chen and G. A. Rincon-Mora. Accurate electrical battery model
![Figure 3: Leakage power consumption contribution is increasing rapidly relatively dynamic power consumption [17]](https://thumb-us.123doks.com/thumbv2/123dok_us/1292228.658397/4.595.59.279.55.190/figure-leakage-consumption-contribution-increasing-rapidly-relatively-consumption.webp)


