Munich Personal RePEc Archive
The Greenspan conundrum of 2005-7 and
the acceleration in US ABCP supply: a
single ‘reach for yield’ story
Lysandrou, Photis and Shabani, Mimoza
City University, University of East London
2017
Online at
https://mpra.ub.uni-muenchen.de/79917/
1
The Greenspan conundrum of 2005-7 and the acceleration in US ABCP supply: a single
‘reach for yield’ story.
Photis Lysandrou and Mimoza Shabani Abstract
The period 2005 through to mid-2007 saw a sharp acceleration in the rate of supply of US asset backed commercial paper (ABCP). This same period also saw the yield on 10-year US treasury bonds remain stubbornly below the federal funds rate, an event so unusual as to cause the then Chairman of the Federal reserve, Alan Greenspan, to talk of a bond yield ‘conundrum’. The central hypothesis of this paper is that these parallel developments were causally linked, with the reach for yield on the part of institutional investors being the key linking factor. To support this hypothesis, we use a dynamic system Generalized Method of Moments (GMM) model to estimate the relationship between US ABCP issuance in the pre-crisis period and such determining factors as short term interest rates, the strength of demand for US ABCP from US institutional money market mutual funds (MMMFs), the geographical breakdown of the bank-sponsored conduits that were the principal suppliers of ABCP and conduit characteristics.
JEL Classification: G20; G21
Keywords: Greenspan conundrum; asset backed commercial paper; reach for yield
1. Introduction
2
sheet vehicles and their activities to maximise profits through regulatory arbitrage (see e.g. Acharya and Schnabl,2010; Acharya et.al., 2013; Arteta et. al.,2013)1
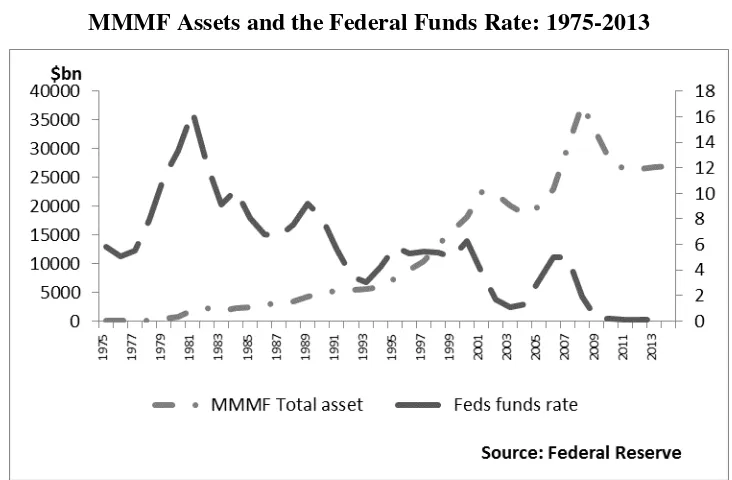
The problem with this type of argument is that it cannot satisfactorily account for a striking peculiarity in the pre-crisis growth rate of the US ABCP market. From its origins in the late 1980s, the size of that market had grown steadily to reach about $600 billion by end-2004, at which point there was then a sudden acceleration in the rate of US ABCP issuance such that by the summer of 2007 the overall value of the market had almost doubled to $1.1 trillion, with bank-sponsored conduits accounting for about 75% of this amount. Why that acceleration at precisely that point in time? In our view, the most plausible answer is to be found in the behaviour of the federal funds rate. From 1% in June, 2004, that rate had risen to 4% by June, 2005, and to 5.25% by June 2006 where it remained until the outbreak of the subprime crisis the following year. Given that throughout this two and a half year period the yield on 10 year-Treasuries lay for much of the time below the policy rate, it stands to reason that institutional investors would have looked to short term securities as a supplementary means of satisfying their need for yield. The aim of this paper is to give empirical backing to this hypothesis.
The structure of the paper is as follows. Section two explains how the reach for yield came to be the key driver behind the exceptionally rapid growth of the US ABCP market between 2005 and 2007. Section three explains the data and the methodology that will be used to support this explanation. Section four provides some results. Section five provides a short summary. Section six concludes.
2. The events surrounding the pre-crisis growth of the US ABCP market
Our story is that the supply of US ABCP was rapidly expanded in 2005-7 principally in order to accommodate the excess demand for yield spilling over from the long term US bond markets. The story can be broken down into five parts.
(i) From about 2001 onwards there was a pronounced decline in yields across all of the
major ‘ground-floor’ US bond markets (treasury, municipal and corporate) caused primarily,
1Although Kacperczyk and Schnabl (2010) provide a detailed analysis of the demand-side of the US ABCP
market in the pre-crisis era they do not go so far as to give primacy to demand pull pressure in the pre-crisis
growth of that market. They acknowledge the fact that “some observers argue that the growth of the asset
3
if not exclusively, by the exceptionally large inflows of funds from foreign private and foreign official investors (see appendix, figure 1A). To help accommodate these inflows the US banking system rapidly expanded the supply of ‘first-floor’ debt securities, principally securities backed by residential mortgage loans. It is noteworthy that of the $9 trillion US ABS outstanding in mid-2007, over one half of these securities had been created in the previous four years (Bank of England, 2007a). Given that the increased rate of ABS supply was never going to be enough to fully satisfy foreign and domestic institutional demand for yield, as attested by the continuing fall in the ABS spread over US treasuries, the US banking system also began
from around 2003 onwards to rapidly expand the supply of ‘second-floor’ debt securities, securities backed by securities backed by mortgage and other credit loans. From approximately $ 0.25 trillion in 2002, the US CDO market had grown twelvefold to $3 trillion by the summer of 2007 (Blundel-Wignall, 2007; IMF, 2008). It is noteworthy in this respect that while conforming (prime agency) mortgage loans constituted the majority part of the US mortgage market up to 2004, between 2005 and 2007 it was the non-conforming segment of this market (subprime, alt-A and jumbo) that became predominant (Bank of England, 2007b).
4
investors would look to the short term securities market as a supplementary means of satisfying their need for yield. The clues that strongly indicate this to have been the case are to be found on both the demand side of the US ABCP market and on the supply side.
(iii) The demand side clue pertains to the US money market mutual funds (MMMFs) that first originated in the early 1970s. These basically divide into ‘government’ MMMFs (that invest solely in securities issued by the government and its agencies) and ‘prime’ MMMFs (that invest in private sector securities) and while the former group continued to account for the majority part of all MMMF asset holdings right up to end-2004, it was the latter group that took over this mantle between 2005 and 2007 (Kacperczyk and Schnabl, 2010). Prime MMMFs
in turn divide into ‘retail’ and ‘institutional’ MMMFs, and while the former group remained
the larger one in terms of asset holdings up to about 1999-2000, the situation was reversed thereafter (see appendix, figure 3A). It is noteworthy that the point at which institutional MMMFs became predominant is also exactly the point at which the overall size of US MMMF asset holdings begin to mirror short run interest rates: down when the rates were down in 2001-2004, and sharply up when the rates were up between June 2004 and July, 2007 (see appendix, figure 4A). What is also noteworthy is that where prior to 2005 the composition of MMMF commercial paper asset holdings was heavily weighted towards financial and corporate commercial paper with ABCP comprising only a small part, over the next two and a half years the situation was reversed (Kacperczyk and Schnabl, 2010). The simple explanation for this reversal is that the banks and corporations needing to finance their borrowing requirements were reluctant to issue short term paper when the short term rate was prohibitively high and preferred instead to lock into the unusually low long term borrowing rates. By contrast, no such considerations constrained either the ability or the willingness of bank-sponsored conduits to increase the issuance of ABCP to make up for the shortfall in the supply of short term paper demanded by the MMMFs (see appendix, figure 5A).
(iv) The above observation brings us to the supply side clues pointing to the pre-crisis growth of the US ABCP market as a reach for yield story. The first of these concerns the geographical breakdown of the bank-sponsored conduits that accounted for approximately $750 billion out of the total $1.1 trillion of US ABCP outstanding in mid-2007. Of this $750 billion, European banks accounted for about $460 billion, US banks for about $270 billion and Japanese banks for the small remainder (see appendix, figure 6A). Taken individually, no
5
the aggregate percentage share of the European banks should have been substantially above that of the US banks when we consider that the contemporaneous European contribution to supplies of ABSs and CDOs was almost negligible: of the $ 11 trillion ABSs and $3 trillion CDOs outstanding in mid-2007 the European banking sector accounted for a mere 17% of both amounts (Bertaut et.al, 2012). Just as remarkable as the European dominance of the US ABCP market in the pre-crisis period is the speed with which this dominance was established. Up to
2001 the European banks’ share of this market remained below that of the US banks and while this share then increased above that of the latter between mid-2001 and mid-2005, the rate of this increase remained fairly steady so that from about $230 billion at the start of this four year
period the European banks’ share only reached about $ 280 billion by the end of it. However, everything abruptly changed in the following two year period up to mid-2007 when it was the European bank sponsored conduits that took the lead in collectively powering the steep rise in US ABCP issuance with the result that their share of that market rose from $280 billion to $460 billion. One possible reason for the discrepancy between the European banks’ minor contribution to ABS and CDO issuance, on the one hand, and their major contribution to ABCP issuance, on the other, are the very different construction requirements needed by these different types of debt securities. The short term and typically non-tradable nature of ABCP means that these instruments are relatively easy to construct as compared with ABSs that, as long term instruments, require more paperwork if they are to be capable of being traded away from the initial conditions of issuance. The difference in technical difficulty and complexity is even pronounced in the case of CDOs given that the inclusion of securitised subprime mortgage loans in the mixture of backing collateral entails the use of sophisticated credit enhancement techniques (CETs) to make these products in any way viable as investable assets. Thus when the institutional demand for short term paper began to expand rapidly from early 2005, the European banks were well able to join with their US counterparts in accommodating this expansion
6
credit loan backed programmes accounted for 77.1% of all ABCP outstanding at that point, by mid-2007 their percentage share had fallen to 62.8% while the share of the three major securities backed programmes rose from 21.3% to 32.8% over the same period (Ahern, 2007). This development in a sense mirrored what was happening at the same time in the CDO market. Despite the high rate of supply of cash CDOs after 2002, this rate was still not enough to satisfy the rapid rise in demand for yield, which is why from about 2004 it was synthetic CDOs that became the dominant component of total CDO stocks ($2 trillion out of $3 trillion by mid-2007). Unlike cash CDOs that take months to be created because they require the physical involvement of household borrowers and of the commercial banks that lend to them in their creation, synthetic CDOs take only a few days to be established in that they involve nothing other than the use of credit default swaps. A similar situation appeared to arise in the ABCP market from about mid-2005 in that while the loan backed programmes continued to carry the major burden of ABCP supply, the high rate of demand for these products combined with the limits to the amounts of loans that could be mustered as collateral in the time needed meant that securities backed programmes, which could be launched more quickly, had to be called upon to help carry the burden.
This explanation as to why European bank sponsored conduits continued their purchases of US ABS in the period 2005-2007 differs markedly from that given by Bertaut et.al. (2012). In their version of events in this period they start with the observation that “the factors that explain European interest in ABS were likely similar to those motivating investors in the United States”, chief amongst these factors being the triple-A rating of ABS that made these assets appear “very safe, while offering slightly higher returns that Treasuries and Agencies” (2012, p.224). Bertaut et.al. then go on to make the assumption that the factors motivating Europeans to purchase ABS in the 2002-2004 period continued to be the primary motivating factors behind European purchases of ABS in the 2005-2007 period. Faced with the question as to why the Europeans would continue to purchase ABS at a time when the profit
opportunities from funding these purchases with ABCP had diminished so greatly, their answer is that, having first gathered pace in the 2002-2004 period, the European demand for ABS then acquired a momentum of its own for a number of reasons including (i) the
7
taking had developed amongst European banks, as amongst their US counterparts, that centred importantly around securitisation (2012, p.224).
In our view, this line of argument does not appear to square with the facts. In the first place,
the European banks’ motive for buying ABS with ABCP funding in the 2002-2004 period appears to differ from that of the US banks in that the latter’s rate of supply of ABCP ( partly backed by ABS) actually declined in this period while the former’s rate of supply remained modestly positive (see appendix, figure 7A): it would appear that over this period the US
banks were more sensitive to the MMMF’s rate of demand for ABCP, which was then
negative, while the European banks were less sensitive to this demand and more concerned with exploiting the profit opportunities offered by the differential between long and short term yields. In the second place, there is the question concerning the European banks’ rate of
acquisition of US ABS over the 2002 to 2007 period. If the ‘momentum’ argument is correct, we should have seen this rate of acquisition slow down while remaining positive in the sub-period 2005-7 or, at the very least, be maintained at roughly the same average level as was maintained in the earlier sub-period of 2002-2004. In fact the contrary was the case, for as shown in figure 7A in the appendix (a figure reproduced from Bertaut et.al (2012)), the rate of European banks’ acquisition of ABS accelerated sharply in the 2005-2007 period, so much so that average European holdings of these assets in this period were double their holdings in the 2002-2004 period. This acceleration in European ABS purchases taken in conjunction with the acceleration in the European rate of ABCP supply over the same 2005-2007 period (as shown in figure 6A) suggests that there was a structural break in the European motives for buying ABS that occurred around end- 2004: in the 2002-2004 period, Europeans may have been supplying APCP to fund their purchases of ABS, but in the 2005-2007 bond yield conundrum period it was the other way round: Europeans were by that time buying ABS to use as collateral in creating ABCP.
8 3. Data and Methodology.
We use a dynamic system Generalized Method of Moments (GMM) two-step first difference model (Arellano and Bond, 1991) to estimate the relationship between ABCP issued in the US market and such determining factors as the federal funds rate, MMMF asset holdings, the geographical breakdown of the banks sponsoring ABCP conduits and differences in conduit characteristics. More formally the baseline econometric model is:
(1) 𝐴𝐵𝐶𝑃𝑖,𝑡 = 𝛽0𝐴𝐵𝐶𝑃𝑡−1+ 𝛽1𝑀𝑀𝑀𝐹𝑡+ 𝛽2𝐼𝑛𝑡𝑒𝑟𝑒𝑠𝑡 𝑟𝑎𝑡𝑒𝑡+ 𝑋𝑖,𝑡 𝜃 + 𝛾𝑖 + 𝜀𝑖,𝑡 (1)
The dependent variable ABCP is the average outstanding commercial paper issued in the US market by conduit i, i=1….325, at time t, t=2001q2…..2007q2. MMMF is the log of total financial assets held by MMMF. Interest rate is the effective Federal Funds Rate, (Fed rate). 𝑋𝑖,𝑡 is a vector that contains information of the different types of conduits. Dummy variables were constructed for each type of programs for which the value of one is given to a representative type and zero otherwise. The programs included are: multiseller, securities arbitrage, hybrid, SIV, Repos/TRS, loan-backed, CDO and fully sponsored. Single seller and other types of programs are the omitted group. 𝛾𝑖 is the unobserved fixed effect that accounts for time invariant conduit-specific features. GMM estimation methodology eliminates the fixed effect by first differencing variables and corrects for all sources of endogeneity between the dependent and independent variables by using as instruments lagged differences of the dependent variable and lagged levels of independent variables. Standard errors are corrected for heteroscedasticity (White, 1980).
Following the initial specification of the model, where we take total MMMF assets, we modify it to so as to separate institutional MMMF assets from retail MMMF assets. We further modify the model to include a dummy variable that separates out conduits that are sponsored by European banks. The dummy variable takes the value of one if the sponsoring bank is headquartered in Europe and zero otherwise.
9
(2) 𝐴𝐵𝐶𝑃𝑖,𝑡 = 𝛽0𝐴𝐵𝐶𝑃𝑡−1+ 𝛽1𝑀𝑀𝑀𝐹𝑡+ 𝛽2𝑌𝑖𝑒𝑙𝑑 𝑆𝑝𝑟𝑒𝑎𝑑𝑡+ 𝑋𝑖,𝑡 𝜃 + 𝛾𝑖 + 𝜀𝑖,𝑡 (2)
WhereYield Spread is the difference between the effective Federal Funds rate and the 10-year Treasury yield rate.
We use a panel dataset of ABCP issuance obtained from Moody’s Investor Service quarterly
information on all active conduits2. Our dataset consists of all bank sponsored conduits that have issued ABCP in the US market for the period between 2001q2-2007q2. We exclude all conduits that have not issued in the US market. The information obtained from Moody’s Investor Service concerns conduit characteristics and sponsor details. The characteristics include credit support type (fully or partially sponsored) and program type. Only bank sponsored conduits are included in our sample.
To construct our dataset we assign an id number to each conduit by name. Any two conduits that have the same name and that have issued in the same quarter are treated as different conduits. We include not only conduits that have issued in all consecutive quarters for the period between 2001-2007 but also those that have issued in only a few quarters.
Furthermore, the dataset includes those conduits that according to Moody’s issue ABCP in the US market but have issued zero ABCP in a particular quarter. In other words, any conduit that has issued in at least one quarter covered in our time span is included in our sample.
In order to distinguish European conduits from non-European ones the bank sponsor location is used. Bankscope is used to identify the headquarter location of each bank. There are a total of 325 bank sponsored conduits in our sample: 156 European, 135 US, 16 Canadian, 12 Japanese and 6 Australian (See appendix Table 1A)
2Moody’s Investors Services published quarterly spreadsheets, Program Index, which contains information on
10 4.Results
The results of our benchmark model are shown in Table 1, column 1. The interest rate coefficient is positive and statistically significant suggesting that an increase in the federal fund rate increases outstanding ABCP by about $102 million. The MMMF coefficient is also positive and significant implying that a 1 % increase in MMMF asset holdings increases the issuance of ABPC by about $1.1 billion. In the second column we add the European bank sponsored dummy variable. As shown, the coefficient of this variable is positive and strongly significant, which is in accordance with our hypothesis that European conduits were the major drivers of ABCP growth in the sample period each issuing on average $75 million more than a non-European conduit. In the third column the MMMF category is split into the institutional and retail subcategories while the forth column again includes the European banks sponsored dummy variable. As can be seen in both columns, it is institutional MMMFs that were responsible for this positive relation while retail MMMF asset holdings over the sample period were negatively related to average ABCP issuance. Furthermore, looking at the program types, the results suggest that SIV, securities arbitrage, multiseller3, hybrid and Repos/TRS are all positively related to ABCP issuance. In other words, all these types of programs issued more than single seller and other type programs. The coefficient associated with SIV type conduit is by far the largest out of all, which is in the range of 15.811 and 8.823. The coefficient associated with Repos/ TRS on the other hand has the least magnitude than the other programs. Loan-backed programs and CDO programs are negatively related with average ABCP outstanding for the period 2001q2-2007q2. Finally, Table 1 shows that a program that is fully sponsored issues more ABCP than a program that is partially sponsored.
3The time invariant dummy variables (i.e. multiseller programs) have been interacted with a linear
11
Table 1: ABCP average outstanding in the US market by program type, location, MMMF and short term rates , 2001Q2-2007Q2
Table 2 presents the results when we run the same baseline model and specification for two sub-periods: 2001q1-2005q2 and 2005q2-2007q2. Note that for the first sub-period the interest rate and MMMF coefficients are negative but then become positive for the second sub-period, 2005q2-2007q2, with institutional MMMFs being responsible for the positive MMMF coefficient. Note also the particularly strong contribution of the securities arbitrage, multiseller and hybrid programmes to US ABCP growth in the second sub-period.
Dependent variable ABCP outstanding
(1) (2) (3) (4)
ABCP(-1) 0.720***
(0.000) 0.692*** (0.000) 0.706*** (0.000) 0.733*** (0.000) Fed Rate 0.102***
(0.000) 0.011*** (0.000) 0.110*** (0.000) 0.058*** (0.000) log(MMMF) 1.154***
(0.000)
1.416***
(0.001)
log(Institutional) 2.437***
(0.003)
1.514***
(0.000)
log(Retail) -1.298***
(0.002)
-0.566***
(0.001) Sec.Arbitrage 7.141***
(0.033) 7.460*** (0.028) 7.142*** (0.036) 5.627*** (0.026) SIV 15.811***
(0.037) 10.843*** (0.042) 12.802*** (0.045) 8.823*** (0.027) Repos/TRS 0.604***
(0.163) 0.070 (0.108) 0.101 (0.126) 0.941*** (0.156) Multiseller*TR 3.759***
(0.032) 2.446*** (0.027) 2.331*** (0.032) 2.976*** (0.026) Loan-Backed -1.529***
(0.002) -2.425*** (0.003) -2.556*** (0.004) -1.909*** (0.001) Hybrid 2.623***
(0.032) 2.611*** (0.027) 1.947*** (0.032) 3.627*** (0.026)
CDO -0.010
(0.006) 0.240*** (0.013) -0.365*** (0.040) -2.048*** (0.002) Full 1.242***
(0.003) 1.334*** (0.008) 1.174*** (0.009) 2.027*** (0.002) European 0.075***
(0.000)
0.024***
(0.000) Observations 4229 4229 4229 4229 AR(2) 0.556 0.118 0.552 0.228 Prob(J-statistic) 0.404 0.401 0.441 0.501
12
Table 2: ABCP average outstanding in the US market by program type, location, MMMF and short term rates, 2005Q2-2007Q2
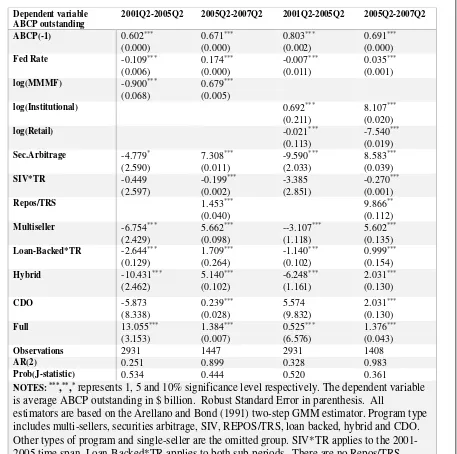
Table 3 shows the results of model (2) in which interest rate spreads replace the federal funds rate variable. We estimate the model over the 2001q2-2007q2 time period as well as for two sub-periods namely 2001q2-2005q2 and 2005q2-2007q2. The coefficient of yield spread for the whole sample period is positive and equal to 0.113. This implies that as the spread widens the issuance of ABCP increases by nearly $113 million. The results for the other two
sub-Dependent variable ABCP outstanding
2001Q2-2005Q2 2005Q2-2007Q2 2001Q2-2005Q2 2005Q2-2007Q2
ABCP(-1) 0.602***
(0.000) 0.671*** (0.000) 0.803*** (0.002) 0.691*** (0.000)
Fed Rate -0.109***
(0.006) 0.174*** (0.000) -0.007*** (0.011) 0.035*** (0.001)
log(MMMF) -0.900***
(0.068)
0.679***
(0.005)
log(Institutional) 0.692***
(0.211)
8.107***
(0.020)
log(Retail) -0.021***
(0.113)
-7.540***
(0.019)
Sec.Arbitrage -4.779*
(2.590) 7.308*** (0.011) -9.590*** (2.033) 8.583*** (0.039)
SIV*TR -0.449
(2.597) -0.199*** (0.002) -3.385 (2.851) -0.270*** (0.001)
Repos/TRS 1.453***
(0.040)
9.866**
(0.112)
Multiseller -6.754***
(2.429) 5.662*** (0.098) --3.107*** (1.118) 5.602*** (0.135)
Loan-Backed*TR -2.644***
(0.129) 1.709*** (0.264) -1.140*** (0.102) 0.999*** (0.154)
Hybrid -10.431***
(2.462) 5.140*** (0.102) -6.248*** (1.161) 2.031*** (0.130)
CDO -5.873
(8.338) 0.239*** (0.028) 5.574 (9.832) 2.031*** (0.130)
Full 13.055***
(3.153) 1.384*** (0.007) 0.525*** (6.576) 1.376*** (0.043)
Observations 2931 1447 2931 1408
AR(2) 0.251 0.899 0.328 0.983
Prob(J-statistic) 0.534 0.444 0.520 0.361
NOTES: ***,**,*represents 1, 5 and 10% significance level respectively. The dependent variable
is average ABCP outstanding in $ billion. Robust Standard Error in parenthesis. All
13
[image:14.595.80.490.268.669.2]periods are in line with the findings in model (1). In the period 2001-2005 the yield spread and MMMF demand for ABCP are negatively related to ABCP issuance as expected. By contrast, the yield spread and MMMF demand are positively related to ABCP issuance in the period 2005-2007, which is in line with our argument concerning the direct link between the bond yield conundrum and investor search for yield. The results for all other control variables are the same as in model (1), which is a clear indication that the results are robust.
Table 3. ABCP average outstanding in the US market by program type, yield spread and MMMF, 2001Q2-2007Q2 Dependent variable ABCP outstanding 2001Q2-2007Q2 2001Q2-2007Q2 2001Q2-2005Q2 2001Q2 2005Q2 2005Q2-2007Q2 2005Q2-2007Q2
ABCP(-1) 0.723***
(0.000) 0.736*** (0.000) 0.604*** (0.002) 0.804*** (0.002) 0.676*** (0.000) 0.676*** (0.000) Yield spread 0.113***
(0.000) 0.078*** (0.000) -0.063*** (0.003) -0.034*** (0.006) 0.168*** (0.001) 0.053*** (0.001) log(MMMF) 1.215***
(0.001)
-0.543***
(0.059)
0.977***
(0.004) log(Institutional) 2.223***
(0.002)
2.914***
(0.184)
7.877***
(0.023) log(Retail) -0.721***
(0.002)
-1.9111***
(0.111)
-7.059 (0.022) Sec.Arbitrage 7.127***
(0.050) 7.020*** (0.038) -3.763* (2.003) -7.467** (3.003) 7.305*** (0.008) 9.119*** (0.317) SIV 14.679***
(0.053) 8.049*** (0.042) 1.922 (2.039) -4.822 (3.097) -0.192*** (0.002) -0.232*** (0.001) Repos/TRS 0.677***
(0.199) 1.317*** (0.158) 1.436*** (0.076) 10.437*** (0.823) Multiseller 3.774***
(0.050) 2.563*** (0.038) -6.002*** (1.871) -9.023*** (2.960) 5.768*** (0.038) 6.239*** (0.320) Loan-backed -1.607***
(0.002) -1.919*** (0.002) -2.322*** (0.106) -3.071*** (0.201) 1.860*** (0.188) 1.138*** (0.122) Hybrid 2.703***
(0.050) 3.181*** (0.038) -10.018*** (1.898) -12.840*** (2.954) 5.199*** (0.037) 2.741*** (0.320) CDO -0.072***
(0.008) -1.580*** (0.043) -3.299 (6.450) -1.648 (3.135) 0.066*** (0.015) 0.737*** (0.012) Full 1.256***
(0.006) 1.397*** (0.007) 13.346*** (3.210) 13.970*** (3.132) 1.377*** (0.017) 1.559*** (0.021) Observations 4229 3872 2931 2931 1447 1447 AR(2) 0.733 0.568 0.582 0.147 0.888 0.888 Prob(J-statistic) 0.373 0.328 0.505 0.412 0.458 0.446 NOTES: ***,**,*represents 1, 5 and 10% significance level respectively. The dependent
variable is average ABCP outstanding in $ billion. Robust Standard Error in
14
Table 4 shows the results of the same GMM estimation taking only the ABCP outstanding related to US bank based sponsored conduits for the whole period of 2001q2-2007q2, and then for the two sub-periods, 2001q2-2005q2 and 2005q2-2007q2. The first and the second columns show that while the MMMF and interests rate coefficients are in line with the
15
Table 4: US bank sponsored conduits ABCP average outstanding by program type
Table 5 shows the results of the GMM estimation taking only the ABCP outstanding related to European bank based sponsored conduits for the whole period of 2001q2-2007q2, and then for the two sub-periods, 2001q2-2005q2 and 2005q2-2007q2. Two things become clear when we compare these results with those of table 4: first, that the European bank sponsored conduits were by far the more responsive to institutional MMMF demand for ABCP in the 2005 to 2007 period as compared with the US bank sponsored conduits, and second, that the European response was particularly concentrated on the securities arbitrage, multi-seller and
Dependent variable ABCP outstanding 2001Q2-2007Q2 2001Q2-2007Q2 2001Q2-2005Q2 2001Q2 2005Q2 2005Q2-2007Q2 2005Q2-2007Q2
ABCP(-1) 0.659***
(0.000) 0.656*** (0.000) 0.433*** (0.000) 0.436*** (0.000) 0.746*** (0.001) 0.749*** (0.002)
Fed Rate 0.108***
(0.001) 0.089*** (0.000) 0.149*** (0.001) 0.227*** (0.001) -0.021*** (0.002) -0.141*** (0.007)
log(MMMF) 1.470***
(0.007)
0.870***
(0.005)
2.097***
(0.038)
log(Institutional) 0.366***
(0.013)
2.612***
(0.012)
8.827***
(0.164)
log(Retail) 1.653***
(0.005)
0.092***
(0.007)
-7.996***
(0.132)
Sec.Arbitrage -3.437***
(0.516) -2.793*** (0.583) -18.092*** (0.497) -18.081*** (0.538) -7.350*** (0.919) -6.804*** (0.180)
SIV*TR 28.846***
(0.879) 30.508*** (0.677) 0.859*** (0.034) 1.036*** (0.027) -0.305*** (0.022) -0.301*** (0.031)
Repos/TRS -0.037 (1.165)
-0.049 (0.869)
- - -6.841 (1.115)
-6.431 (1.277)
Multiseller -2.610***
(0.109) -2.141*** (0.089) 7.163*** (0.122) 7.277*** (0.292) -8.137 (1.090) -7.650*** (1.003)
Loan-backed*TR -0.220***
(0.001) 0.008*** (0.001) 0.153*** (0.001) 0.183*** (0.002) -0.089 (0.137) -0.198** (0.098)
Hybrid*TR -0.158***
(0.002) -0.135*** (0.003) 0.248*** (0.006) 0.271*** (0.008) -0.297*** (0.031) -0.270*** (0.010)
CDO 4.964 (1.066) 4.811 (0.687) 2.450 (0.571) 0.161 90.119) 0.106 (0.555) 0.494* (0.290)
FULL*TR -0.099**
(1.001) -0.061*** (0.001) -0.407*** (0.01) -0.382*** (0.001) 0.020*** (0.001) 0.023*** (0.001)
Observations 1506 1506 1076 1076 481 481
AR(2) 0.976 0.942 0.950 0.933 0.992 0.978
Prob(J-statistic) 0.508 0.449 0.332 0.365 0.520 0.514
16
hybrid programmes. These results are consistent without conjecture that there was an
[image:17.595.82.514.184.543.2]acceleration in European demand for ABS over the bond yield conundrum period principally in order to use as collateral in ABCP issuance to meet institutional MMMF demand.
Table 5. European bank sponsored conduits ABCP average outstanding by program type
6.Summary
The results presented above are broadly consistent with our conjecture that the driving force behind the acceleration in US ABCP supply in the Greenspan conundrum period of 2005-7 was the reach for yield pressure spilling over from the long term US bond markets. First, there is the timing of the acceleration: the jump in demand for ABCP from institutional MMMFs occurs exactly during the conundrum period; second, there is the geographic
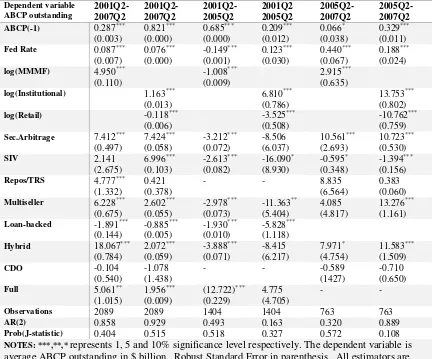
Dependent variable ABCP outstanding 2001Q2-2007Q2 2001Q2-2007Q2 2001Q2-2005Q2 2001Q2 2005Q2 2005Q2-2007Q2 2005Q2-2007Q2
ABCP(-1) 0.287***
(0.003) 0.821*** (0.000) 0.685*** (0.000) 0.209*** (0.012) 0.066* (0.038) 0.329*** (0.011)
Fed Rate 0.087***
(0.007) 0.076*** (0.000) -0.149*** (0.001) 0.123*** (0.030) 0.440*** (0.067) 0.188*** (0.024)
log(MMMF) 4.950***
(0.110)
-1.008***
(0.009)
2.915***
(0.635)
log(Institutional) 1.163***
(0.013)
6.810***
(0.786)
13.753***
(0.802)
log(Retail) -0.118***
(0.006)
-3.525***
(0.508)
-10.762***
(0.759)
Sec.Arbitrage 7.412***
(0.497) 7.424*** (0.058) -3.212*** (0.072) -8.506 (6.037) 10.561*** (2.693) 10.723*** (0.530)
SIV 2.141 (2.675) 6.996*** (0.103) -2.613*** (0.082) -16.090* (8.930) -0.595* (0.348) -1.394*** (0.156)
Repos/TRS 4.777***
(1.332)
0.421 (0.378)
- - 8.835 (6.564)
0.383 (0.060)
Multiseller 6.228***
(0.675) 2.602*** (0.055) -2.978*** (0.073) -11.363** (5.404) 4.085 (4.817) 13.276*** (1.161)
Loan-backed -1.891***
(0.144) -0.885*** (0.005) -1.930*** (0.010) -5.828*** (1.118)
Hybrid 18.067***
(0.784) 2.072*** (0.059) -3.888*** (0.071) -8.415 (6.217) 7.971* (4.754) 11.583*** (1.509)
CDO -0.104 (0.540)
-1.078 (1.438)
- - -0.589 (1427)
-0.710 (0.650)
Full 5.061**
(1.015) 1.956*** (0.009) (12.722)*** (0.229) 4.775 (4.705) - -
Observations 2089 2089 1404 1404 763 763
AR(2) 0.858 0.929 0.493 0.163 0.320 0.889
Prob(J-statistic) 0.404 0.515 0.518 0.327 0.572 0.108
NOTES: ***,**,* represents 1, 5 and 10% significance level respectively. The dependent variable is
17
breakdown of the conduits involved in the acceleration: it was the European bank-sponsored conduits that accounted for the bulk of the increased supply of ABCO during the conundrum period; third, there is the change in the ABCP programme breakdown of the conduits: it was the securities backed programmes that increased their percentage share of total US ABCP supply during the conundrum period.
The above results by no means contradict the argument that the banks sponsoring the
conduits had both the opportunity (the exploitation of lax bank regulation) and the incentive (the exploitation of maturity mismatches) to boost their supply of US ABCP during the conundrum period. However, what the results do call into question is the much stronger argument that profit seeking activities on the part of the banks continued to be the primary driving force behind ABCP supply right up to the outbreak of the subprime crisis in the summer of 2007. If this was the case then why did the sudden acceleration in ABCP supply not occur before June 2004 when the yield differential between long and short term US securities was substantially higher thus offering substantially greater profit opportunities for the banks? Why did the European banks, who always found it much easier to issue ABCP as compared with ABSs and CDOs, wait until after June 2004 to boost their supply of this paper? And why was it that the percentage share of securities backed ABCP programmes, as distinct from credit loan backed programmes, only rose substantially after June 2004 and not before this date?
Our suggested answer to all of these questions is that the banks could not increase their rate of ABCP supply before June 2004, and thus did not need to depend more heavily on
securities backed programmes to overcome the limits on credit loan backed programmes, simply because at that time there was no corresponding increase in the level of ABCP demand from MMMFs. On the contrary, the same set of circumstances offering banks the opportunity to profit handsomely from expanding ABCP supply before June 2004 were also precisely those deterring MMMFs from redirecting their demand for short term commercial paper away from other types of paper and towards ABCP. In sum, the unusually rapid growth of the US ABCP market during the conundrum period makes sense only if causal primacy for this growth is given to demand pull pressures with supply push considerations given a
18 6.Conclusion
In light of the severity of the financial crisis of 2007-8 and the enormous damage
subsequently done to the global economy, it is imperative that we have a full understanding the root causes of the crisis. That point has yet to be reached. While many gaps in our understanding have been filled, some still remain. One is the absence of a satisfactory explanation as to why the ABCP market, a key component of the shadow banking system in the pre-crisis period, experienced unusually rapid growth in the short time span between 2005 and 2007. The present paper has sought to provide such an explanation.
References
Acharya, Viral V. and Schnabl, P (2010), Do global banks spread global imbalances? The case of ABCP during the financial crisis of 2007–09, IMF Economic Review 58, 37–73.
Acharya, Viral V, Schnabl, P and Suarez, G (2013), Securitisation without risk transfer, Journal of Financial Economics, Vol. 107, No 3,
Ahern, J (2007), ABC’s of ABCP, Societe Generale
Arteta, C, Carey, M, Correa, R and Kotter, J ( 2013) Revenge of the Steamroller: ABCP as a Window on Risk Choices, Board of Governors of the Federal Reserve System, International Finance Discussion Papers, Number 1076
Bank of England (2007a). Financial Stability Report. April.
Bank of England (2007b), Financial Stability Report, October
Bernanke, B, S, Bertaut, C, DeMarco, L,P and Kamin, S. (2011). “International Capital Flows and the Returns to Safe Assets in the United States, 2003–2007.” FRS International Finance Discussion Papers 1014, Board of Governors of the Federal Reserve System
Bertaut, C, De Marco, L.P, Kamin, S and Tryon, R (2012), ABS Inflows to the United States and the Global Financial Crisis, Journal of International Economics, Vol.88, Issue 2
19
Caballero, R, J (2010). “The “Other” Imbalance and the Financial Crisis.” NBER Working Paper 15636, National Bureau of Economic Research, Cambridge, Massachusetts,
Washington
Covitz, D, Liang, N and Suarez, G (2012), The evolution of a financial crisis: collapse of the asset-backed commercial paper market, Journal of Finance,
Deutsche Bank, (2015), Money Market funds – an economic perspective, February
Goda, T, Lysandrou, P and Stewart, C. (2013). “The Contribution of U.S. Bond Demand to
the U.S. Bond Yield Conundrum of 2004 to 2007: An Empirical Investigation.” Journal of International Financial Markets, Institutions and Money 27: 113–36.
Goda, T and Lysandrou, P (2014), “The Contribution of Wealth Concentration to the
Subprime Crisis: A Quantitative Estimation.” Cambridge Journal of Economics 38 (2): 301– 27
Kacperczyk, M and Schnabl, P (2010), When safe proved risky: Commercial paper during the financial crisis of 2007–2009, Journal of Economic Perspectives 24, 29–50.
Lysandrou, P (2009). “The Root Cause of the Financial Crisis: A Demand-Side View.” Financial Times Economists Forum, March 24, http://blogs.ft.com/economistsforum/2009/03/ the-root-cause-of-the-financial-crisis-a-demand-side-view
Lysandrou, P and Nesvetailova, A (2015), The role played by the shadow banking system in the subprime crisis: a disaggregated view, Review of International Political Economy,
Pozsar, Z (2011). “Institutional Cash Pools and the Triffin Dilemma of the U.S. Banking
System.” IMF Working Paper 11/190, International Monetary Fund, Washington
20 Appendix Figure 1A
US Bond Yields, 1990-2007
Source: Goda et.al (2013)
Figure 2A
[image:21.595.116.478.496.741.2]21 Figure 3A
MMMF Assets in $US bn (right scale)
Percentage Share of Retail and Institutional MMMF assets (left scale)
Figure 4A
[image:22.595.113.479.455.695.2]22 Figure 5A
US Commercial paper Issuance: 2004-2009
Figure 6A
US ABCP supply by region
[image:23.595.71.445.449.679.2]23 Figure 7A.
European holdings of foreign long term-debt securities
24
Table 1A Conduits contain in the sample
Conduit name Sponsor bank Location
Aeltus CBO V, Limited Aeltus Investment Management, Inc. / Chase Manhattan Bank US
Albis Capital Corporation Glencore AG / JPMorgan Chase Bank US
Amoco Managers Acceptance Corporation Amoco Oil Corporation / Chase Manhattan Bank US
Anglesea Funding LLC / Anglesea Funding PLC Bank of New York US
APRECO Incorporated Citibank, N.A. US
Aquifer Funding, LLC / Aquifer Funding Limited Bank of America N.A. US
Asset Portfolio Funding Corporation JPMorgan Chase Bank US
BA Emerald Notes Program Bank of America, N.A. US
Beta Finance Incorporated Citibank International PLC US
Bishop's Gate Residential Mortgage Trust Cendant Mortgage Corporation / Bank One, N.A.
US
Blue Ridge Asset Funding Corporation Wachovia Bank, N.A. US
Broadhollow Funding, LLC American Home Mortgage Investment Corp.
US
Bunge Asset Funding Corporation Bunge International Ltd. / JPMorgan Chase Bank US
CAFCO, LLC Citibank, N.A. US
Capital One Multi-Asset Execution Trust Capital One Bank US
Catapult-PmX Funding, LLC Paramax Capital Markets LLC / LaSalle Bank National Association US
CC (USA) Incorporated Citibank International PLC US
Centauri Corporation/ CC (USA) Incorporated Citibank International PLC US
Centre Square Funding Corporation First Union National Bank US
Centric Capital Corporation Wachovia Bank, N.A. US
Chariot Funding LLC JPMorgan Chase Bank US
Charta Corporation Citibank, N.A. US
CharterMAC Certificate Trust I First Tennessee Bank, N.A. US
Ciesco, L.P. Citibank, N.A. US
Clipper Receivables Corporation State Street Bank and Trust Company US
Cobblestone Funding LLC Citigroup Global Markets US
Conduit Asset Backed Securities Company Limited Artesia Banking Corporation / Chase Manhattan Bank US
Corporate Asset Funding Company, Incorporated Citibank, N.A. US
Corporate Receivables Corporation Citibank, N.A. US
CRC Funding, LLC Citibank, N.A. US
CXC Incorporated Citibank, N.A. US
DAKOTA Certificate Program Citibank (South Dakota), N.A. US
Declaration Funding I, Limited Independence Fixed Income Associates, Inc. / Chase Manhattan Bank US
Deer Valley Funding Ltd. / Deer Valley Funding LLC Merrill Lynch Bank USA US
Delaware Funding Corporation Morgan Guaranty Trust US
DNA Finance Corporation Genentech Inc. / JPMorgan Chase Bank US
Dorada Finance Incorporated Citibank International PLC US
Eagle I CBO Limited Federated Investment Counseling / Bank of New York US
Emerald Certificates Program MBNA America Bank, N.A. US
Eminent Funding I, Limited TCW Group / Chase Manhattan Bank US
Enterprise Funding Corporation Bank of America, N.A. US
Eureka Securitization Plc/Incorporated Citibank, N.A. US
Fairway Finance Company LLC BMO Nesbitt Burns US
Falcon Asset Securitization Corporation Bank One, N.A. US
FCCII, Incorporated First National Bank of Omaha US
First Express Funding Corporation First Tennessee Bank, N.A. US
Five Finance Incorporated Citibank International PLC US
Forrestal Certificate Funding Trust Bank of America, N.A. US
Fountain Square Commercial Funding Corporation Fifth Third Bank US
Frigate Funding Corporation State Street Bank and Trust Company US
Galaxy Funding, Incorporated Firstar Bank, N.A. US
Galleon Capital Corporation State Street Bank and Trust Company US
25
Table 1A (continued) Conduits contain in the sample
Conduit name Sponsor bank Location
Govco Incorporated Citibank, N.A. US
Grenadier Funding, Limited ACA Management, L.L.C. / JPMorgan Chase Bank US
Hatteras Funding Corporation Bank of America, N.A. US
Hudson Street Funding Corporation Goldman, Sachs & Co. US
Independence Funding LLC Bank of America, N.A. US
IndyMac Bank, F.S.B. - North Lake Capital Funding IndyMac Bank, F.S.B. US
Ivory Funding Corporation Bank One, N.A. US
Jupiter Securitization Corporation (formerly International SecuriBank One, N.A. US
Jupiter Securitization Corp. JPMorgan Chase Bank US
Keel Capital Inc. / Spinnaker Capital Pty Limited State Street Global Markets LLC US
Kitty Hawk Funding Corporation Bank of America, N.A. US
KKR Pacific Funding Trust KKR Financial Advisors III / Deutsche Bank Trust Company Americas US
KKR Atlantic Funding Trust KKR Financial Advisors III / Deutsche Bank Trust Company Americas US
KZH-KMS Chase Manhattan Bank US
Lake Front Funding Company LLC Bank One, N.A. US
Liquid Funding Ltd. Bear Sterns Bank PLC US
Lockhart Funding LLC Zions First National Bank US
Luminent Star Funding Statutory Trust I Luminent Mortgage Capital Inc. / LaSalle Bank N.A. US
Madison Funding Corporation Bank One, N.A. US
Market Street Funding Corporation PNC Bank, N.A. US
MOAT Funding LLC Chase Manhattan Bank US
MPF Limited Alliance Capital Management L.P. / State Street Bank and Trust
Company US
MPF Two Limited Alliance Capital Management L.P. / State Street Bank and Trust
Company US
Newbury Funding CBO I Limited Colonial Advisory Services, Inc. / Bank of New York US
Newcastle Certificates Program Morgan Stanley Dean Witter & Co. US
North Coast Funding LLC National City Bank US
Ocala Funding LLC Taylor, Bean & Whitaker Mortgage Corporation / Lasalle Bank N.A. US
Old Slip Funding Corporation Bank of New York US
Panterra Funding, LLC Citibank, N.A. US
Park Avenue Receivables Company LLC JPMorgan Chase Bank US
Perry Funding Corporation, Series CAB & NJED Bank of America, N.A. US
Perry Global Funding Limited, Series A Bank of America, N.A. US
Perry Global Funding Limited, Series A & B Bank of America, N.A. US
Perry II Funding Corporation, Series Jersey, Hydro-Quebec
(HQ), Quebec, & ACE Bank of America, N.A. US
Perry III Funding Corporation, Series Philadelphia & ROSE Bank of America, N.A.
US
Pooled Accounts Receivables Capital Corporation BMO Nesbitt Burns US
Preferred Receivables Funding Corporation Bank One, N.A. US
Providian Master Trust Series 1993-3 Providian National Bank US
Quincy Capital Corporation Bank of America, N.A. US
Ranger Funding Company LLC Bank of America, N.A. US
Receivables Capital Company LLC Bank of America, N.A. US
Receivables Capital Corporation Bank of America, N.A. US
Revolving Commitment Vehicle Corporation Morgan Guaranty Trust US
Sedna Finance Incorporated Citibank, N.A. US
Steamboat Funding Corporation Bank of New York US
Stellar Funding Corporation Firstar Bank, N.A. US
Sunbelt Funding Corporation Compass Bank US
Sweetwater Capital Corporation Mellon Bank US
Three Rivers Funding Corporation Mellon Bank US
Ticonderoga Funding, LLC / Ticonderoga Master Funding
Ltd. Bank of America, N.A. US
Trainer Wortham First Republic CBO I, Limited Trainer, Wortham & Company, Inc. / Chase Manhattan Bank
US
[image:26.595.72.529.87.713.2]26
Table 1A (continued) Conduits contain in the sample
Conduit name Sponsor bank Location
Ultimate Finance Corporation (formerly Amoco Managers
Acceptance Corporation) Amoco Oil Corporation / JPMorgan Chase Bank US
Variable Funding Capital Corporation Wachovia Bank, N.A. US
Venus Funding Corporation U.S. Bank National Association US
Vetra Finance Inc Citibank, N.A. US
Waratah Securities Australia Limited/ Sydney Capital Corp. Westpac Banking Corp. US
Waterfront Funding Corporation M&I Marshall & Ilsley Bank US
WCP Funding Incorporated Citibank, N.A. US
Westways Funding I, Limited TCW Group / JPMorgan Chase Bank US
Westways Funding II, Limited TCW Group / Chase Manhattan Bank US
Westways Funding III, Limited TCW Group / JPMorgan Chase Bank US
Westways Funding IV, Limited TCW Group / Chase Manhattan Bank US
Westways Funding V, Limited TCW Group / Chase Manhattan Bank US
White Pine Corporation Limited / White Pine Finance LLC Bank One, N.A. US
Yorktown Capital, LLC Bank of America, N.A. US
Zane Funding, LLC Merrill Lynch Bank USA US
Zela Finance Corporation / Zela Finance Inc Citibank International plc US
Beta Finance Corporation Citibank International PLC US
Capital USA Funding II, L.P. Capital USA, LLC US
Centauri Corporation Citibank International PLC US
Citibank Capital Markets Assets II LLC Citibank, N.A. US
Citibank Capital Markets Assets LLC Citibank, N.A. US
Dorada Corporation Citibank International PLC US
Five Finance Corporation Citibank International PLC US
Immunex Funding Corporation Immunex Corporation / JPMorgan Chase Bank US
Oasis Asset Management Limited Citibank International PLC US
Perry Global Funding Limited, Series A & B Bank of America, N.A. US
Sandlot Funding LLC U.S. Central Federal Credit Union US
Wood Street Funding Corporation PNC Bank, N.A. US
Indomitable Funding Ltd. Bank of America, N.A. US
CPI Funding Corporation Lord Securities Corporation/ JPMorgan Chase Bank US
CentreStar Capital No.1, LLC National Australia Bank Limited Australia
Coast Asset Corporation ANZ Investment Bank Australia
Sydney Capital Corporation / Waratah Securities Australia
Limited Westpac Banking Corp. Australia
Titan Securitisation Limited / TSL (USA) Inc. National Australia Bank Ltd. Australia
MTF Securities Limited Commonwealth Bank of Australia Australia
TSL (USA) Incorporated National Australia Bank Limited Australia
ABSC Capital Corporation, Incorporated Canadian Imperial Bank of Commerce Canada
Asset Securitization Cooperative Corporation Canadian Imperial Bank of Commerce Canada
Asset-Backed Securitisation Corporation Limited / ABSC
Capital Corporation, Incorporated Canadian Imperial Bank of Commerce Canada
Exelsior Incorporated XL Capital / Royal Bank of Canada Canada
Liberty Street Funding Corporation Bank of Nova Scotia Canada
Links Finance Corporation / Links Finance LLC Bank of Montreal (London Branch) Canada
Old Line Funding Corporation Royal Bank of Canada Canada
Parkland Finance Corporation/ Parkland (USA) LLC Bank of Montreal (London Branch) Canada
SPARC, LLC Canadian Imperial Bank of Commerce Canada
Special Purpose Accounts Receivable Cooperative
Corporation Canadian Imperial Bank of Commerce Canada
Superior Funding Capital Corporation Canadian Imperial Bank of Commerce Canada
Thunder Bay Funding Incorporated Royal Bank of Canada Canada
White Point Funding, Inc. Royal Bank of Canada, New York Branch Canada
[image:27.595.74.527.87.674.2]27
Table 1A (continued) Conduits contain in the sample
Conduit name Sponsor bank Location
Great Lakes Funding Capital Corporation Canadian Imperial Bank of Commerce Canada
Links Finance LLC Bank of Montreal (London Branch) Canada
A.M. Funding Corporation Credit Suisse First Boston Europe
ABEL Funding Pty. Limited/ Tasman Funding Incorporated ABN AMRO Australia Limited Europe
Abington Square Funding, LLC HSBC Bank PLC Europe
ACE Overseas Corporation Societe Generale Australia Limited Europe
Cobbler Funding Limited / Cobbler Funding LLC WestLB AG Europe
Ajax Bambino Funding Limited / Ajax Bambino Funding Inc. ING Bank N.V. Europe
Alpine Securitization Corporation Credit Suisse Europe
Altamira Funding LLC Banco Santander Central Hispano, S.A. Europe
Amstel Funding Corporation ABN AMRO Bank N.V. Europe
Amsterdam Funding Corporation ABN AMRO Bank N.V. Europe
Antalis S.A. / Antalis U.S. Funding Corp. Societe Generale Europe
Aquinas Funding LLC Rabobank Nederland Europe
AriesOne Metafolio Corporation Hudson Castle Group Inc. / Deutsche Bank Trust Company Americas
Europe
Arth Capital Corporation Glencore AG / Deutsche Bank Trust Company Americas
Europe
Aspen Funding Corporation Deutsche Bank AG Europe
Asscher Finance Limited HSBC Bank plc Europe
Atlantic Asset Securitization Corporation Credit Lyonnais Europe
Atlantis One Funding Corporation Rabobank Nederland Europe
Atlantis Two Funding Corporation Rabobank Nederland Europe
Atomium Funding LLC KBC Bank N.V. / JPMorgan Chase Bank Europe
Austra Corporation Société Générale Australia Limited Europe
Autobahn Funding Company LLC DG Deutsche Genossenschaftsbank AG Europe
Barton Capital Corporation Societe Generale Europe
Bavaria Finance Funding I LLC Bayerische Hypo-und Vereinsbank AG Europe
Bavaria GLB Corporation Bayerische Hypo-und Vereinsbank AG Europe
Bavaria TRR Corporation Bayerische Hypo - und Vereinsbank AG Europe
Bavaria Universal Funding Corporation Bayerische Hypo-und Vereinsbank AG Europe
Beacon Funding Limited / Beacon Funding LLC HSH Nordsbank AG Europe
Beethoven Funding Corporation Dresdner Bank AG Europe
Berkeley Square Finance LLC / Berkeley Square Finance Ltd.Deutsche Bank Trust Company Americas Europe
BEST Funding Limited Bankgesellschaft Berlin AG Europe
Black Forest Funding Corporation Bayerische Hypo-und Vereinsbank AG Europe
BLUE SPICE, LLC Deutsche Bank AG Europe
Blue Topaz, LLC Deutsche Bank AG Europe
Brahms Funding Corporation Dresdner Bank AG Europe
Bryant Park Funding LLC HSBC Bank PLC Europe
Cable Beach L.P. Deutsche Bank AG Europe
Cancara Asset Securitisation LLC Lloyds TSB Bank PLC Europe
Cantabric Financing PLC / Cantabric Financing LLC Banco Santander Central Hispano, S.A. Europe
Carrera Capital Finance LLC / Carrera Capital Finance Ltd. HSH Nordbank AG / JP Morgan Chase Bank Europe
Certain Funding Corporation Societe Generale Europe
Check Point Charlie Incorporated Bankgesellschaft Berlin AG Europe
Classic LLC Calyon Europe
Cobbler Funding LLC / Cobbler Funding Limited Nationwide Building Society Europe
Compass Securitization LLC Westdeutsche Landesbank Girozentrale Europe
Coral Capital Limited/ Coral Capital LLC DZ Bank AG Europe
Cullinan Finance Limited / Cullinan Finance Corporation HSBC Bank PLC Europe
Eaton Vance Variable Leverage Fund Ltd. Deutsche Bank AG Europe
Erasmus Capital Corporation Rabobank Nederland Europe
Four Winds Funding Corporation Commerzbank AG Europe
Fox Trot CDO Ltd. Rabobank Nederland Europe
Gemini Securitization Corporation LLC Deutsche Bank AG Europe
[image:28.595.74.526.88.723.2]28
Table 1A (continued) Conduits contain in the sample
Conduit name Sponsor bank Location
Giro Balanced Funding Corporation Bayerische Landesbank Girozentrale Europe
Giro Funding U.S. Corporation Bayerische Landesbank Europe
Giro Lion Funding Limited Bayerische Landesbank Europe
Giro Multi-Funding Corporation Bayerische Landesbank Girozentrale Europe
Gramercy Capital Corporation Credit Suisse First Boston Europe
Grampian Funding LLC HBOS Treasury Services plc Europe
Grand Funding Corporation ABN AMRO Bank N.V. Europe
Grand II Funding Corporation ABN AMRO Bank N.V. Europe
Greenwich Funding Corporation Credit Suisse First Boston Europe
Greyhawk Funding LLC Westdeutsche Landesbank Girozentrale Europe
Hannover Funding Company LLC Norddeutsche Landesbank Girozentrale Europe
High Peak Funding LLC Erste Bank / Chase Manhattan Bank Europe
Hudson-American Realty Protection LLC Bayerische Hypo-und Vereinsbank AG Europe
Jade Capital Corporation Bayerische Hypo-und Vereinsbank & Industrial Bank of Japan / Mizuho Trust & Banking Co., Ltd.
Europe
K2 (USA) LLC Dresdner Bank AG Europe
Kaiserplatz Funding Commerzbank AG Europe
KBC Commercial Paper Trust KBC Bank N.V. Europe
Kestrel Funding US LLC WestLB AG Europe
La Fayette Asset Securitization LLC Credit Lyonnais (New York Branch) Europe
Lake Constance Funding Ltd./ Lake Constance Funding LLC Landesbank Baden-Wuerttemburg Europe
Lakeside Funding LLC Deutsche Bank AG Europe
Landale Funding LLC HBOS Treasury Services plc Europe
LMA S.A. (Liquidités de Marché) Calyon Europe
Loch Ness Limited / Ness LLC Royal Bank of Scotland PLC Europe
Lone Star Funding LLC Associates First Capital Corporation / Deutsche Bank Trust Company
Americas Europe
Lyon Short Term Funding Corporation Credit Lyonnais Europe
Mane Funding Corporation ING Bank N.V. Europe
Maximilian Capital Corporation Bayerische Hypo-und Vereinsbank AG (Singapore Branch)
Europe
Mermaid Funding Corporation Rabobank Nederland Europe
Monte Rosa Capital Corporation ING Bank N.V. Europe
Mica Funding, LLC Stanfield Global Strategies LLC / Deutsche Bank Trust Company
Americas Europe
Mont Blanc Capital Corporation ING Bank N.V. Europe
Montauk Funding Corporation Westdeutsche Landesbank Girozentrale Europe
Monument Gardens Funding LLC Rabobank Nederland Europe
Moriarty Limited Abbey National Treasury Services PLC Europe
Ness LLC Royal Bank of Scotland Europe
Newport Funding Corporation Deutsche Bank AG Europe
Nieuw Amsterdam Receivables Corporation Rabobank Nederland Europe
Nightwatch Funding LLC ABN AMRO Bank N.V. Europe
North Sea Funding LLC ABN AMRO Bank N.V. Europe
Orchid Funding Corporation ABN AMRO Bank N.V. Europe
Granite Funding LLC Ceres Capital LLC / Bankers Trust Company
Europe
FIDEX PLC BNP Paribas Europe
Eiger Capital Corporation ING Bank N.V. Europe
Paradigm Funding LLC WestLB AG Europe
Peacock Funding Corporation Credit Suisse First Boston Europe
Pennine Funding LLC Halifax PLC Europe
Picaros Funding plc / Picaros Funding LLC KBC Bank N.V. / KBC Financial Products UK Limited Europe
Polonius, Incorporated Danske Bank Europe
Premier Asset Collateralized Entity Limited / Premier Asset
[image:29.595.74.528.89.698.2]29
Table 1A (continued) Conduits contain in the sample
Conduit name Sponsor bank Location
Premier Cru Funding Corporation ABN AMRO Bank N.V. Europe
Public Square Funding LLC, Series I Key Bank, N.A. / Deutsche Bank Trust Company Americas Europe Public Square Funding LLC, Series II Key Bank, N.A. / Deutsche Bank Trust Company Americas Europe
Regency Markets No. 1 LLC HSBC Investment Bank PLC Europe
Repeat Offering Securitisation Entity Funding Incorporated (ROSENational Westminster Bank PLC Europe
Rhein-Main Securitisation Limited Deutsche Bank AG Europe
Rheingold Securitisation Limited Deutsche Bank AG Europe
Rhineland Funding Capital Corporation IKB Deutsche Industriebank AG / Canadian Imperial Bank of Commerce Europe
Romulus Funding Corporation IntesaBci S.p.A. / JPMorgan Chase Bank Europe
Rosy Blue International S.A. KBC Bank N.V. / JPMorgan Chase Bank (London Branch) Europe
Saratoga Funding Corp. LLC Deutsche Bank AG Europe
Scaldis Capital Limited / Scaldis Capital LLC Fortis Bank S.A./N.V. Europe
Sceptre International Incorporated Barclays Bank PLC Europe
Sedona Capital Funding Corporation Deutsche Bank AG Europe
Sheffield Receivables Corporation Barclays Bank PLC Europe
Silver Tower Funding Limited / Silver Tower US Funding LLC Dresdner Bank AG Europe
Silver Tower US Funding LLC Dresdner Bank AG Europe
Simba Funding Corp/Simba Funding Corp. (US) ING Bank N.V. Europe
Solitaire Funding Limited HSBC Bank PLC Europe
Stanfield Victoria Funding, LLC Stanfield Global Strategies, LLC / Deutsche Bank Trust Company Americas Europe Starbird Funding Corporation (formerly Global Receivables
Corporation) BNP Paribas Europe
Stratford Receivables Company LLC Barclays Bank PLC Europe
Sunflowers Funding Corporation LLC ABN AMRO Bank N.V. Europe
Surrey Funding Corporation Barclays Bank PLC Europe
Tahoe Funding Corporation Deutsche Bank AG Europe
Tango Finance Limited/ Tango Finance Corporation Rabobank Nederland Europe
Tasman Funding Incorporated ABN AMRO Bank N.V. Europe
Tempo Finance Limited / Tempo Finance Corporation Rabobank International Europe Thames Asset Global Securitization No. 1, Incorporated National Westminster Bank PLC Europe
Three Crowns Funding LLC Skandinaviska Enskilda Banken AB Europe
Times Square Funding, LLC Eurohypo AG, New York Branch Europe
Trident Capital Finance Incorporated Société Générale Europe
Tulip Funding Corporation / Tulip Euro Funding Corporation ABN AMRO Bank N.V. Europe Whistlejacket Capital Ltd. / Whistlejacket Capital LLC Standard Chartered Bank Europe
Windmill Funding Corporation ABN AMRO Bank N.V. Europe
Bills Securitisation Limited Deutsche Bank AG Europe
Certain Funding Limited Societe Generale Europe
Citation Capital Incorporated Deutsche Bank AG / Bankers Trust Company Europe
Compass Securitisation Limited Westdeutsche Landesbank Girozentrale Europe
Eliopée Limited BNP Paribas Europe
K2 Corporation Dresdner Bank AG Europe
Nantucket Funding Corp., LLC Deutsche Bank AG Europe
Ormond Quay Funding PLC Sachsen LB Europe plc Europe
Scaldis Capital Limited Fortis Bank S.A./N.V. Europe
Silver Tower Funding Limited Dresdner Bank AG Europe
TempUS Funding LLC Rabobank International, New York Branch Europe
Twin Towers Incorporated Deutsche Bank AG Europe
Viking Asset Securitisation Limited Unibank A/S Europe
Arabella Funding Ltd. Bayerische Hypo-und Vereinsbank AG Europe
Bavaria Securitisation Limited Bayerische Hypo-und Vereinsbank AG Europe
Ebbets Funding LLC / Ebbets Funding Plc Deutsche Bank Trust Company Americas Europe Fenway Funding, LLC Hudson Castle Group Inc. / Deutsche Bank Trust Company Americas Europe
Harrier Finance Limited / Harrier Finance (US) Limited WestLB AG Europe
Albion Capital Corporation S.A. Bank of Tokyo-Mitsubishi UFJ Japan
Broadway Capital Corporation Bank of Tokyo-Mitsubishi, Ltd. Japan
Dynamic Funding Corporation Fuji Bank, Limited Japan
Golden Fish Limited/ Golden Fish LLC Norinchukin Bank Japan
Gotham Funding Corporation Bank of Tokyo-Mitsubishi, Ltd. Japan
Manhattan Asset Funding Company LLC Sumitomo Mitsui Banking Corporation / Bankers Trust Company Japan Parthenon Receivables Funding LLC Swiss Re Financial Products & Bank of Tokyo-Mitsubishi, Ltd. Japan Victory Receivables Corporation Bank of Tokyo-Mitsubishi, Ltd. / Deutsche Bank Trust Company Americas Japan
Working Capital Management Co., L.P. Industrial Bank of Japan Japan
Golden Fish LLC Norinchukin Bank Japan
Strategic Asset Funding Corporation (SAFCO), Tranche B Sanwa Bank / Toyo Trust Company of New York Japan
[image:30.595.74.510.92.746.2]