Proceedings of the 57th Annual Meeting of the Association for Computational Linguistics, pages 5093–5100 5093
Studying Summarization Evaluation Metrics in the Appropriate Scoring
Range
Maxime Peyrard∗
EPFL
Abstract
In summarization, automatic evaluation met-rics are usually compared based on their abil-ity to correlate with human judgments. Un-fortunately, the few existing human judgment datasets have been created as by-products of the manual evaluations performed during the DUC/TAC shared tasks. However, modern systems are typically better than the best sys-tems submitted at the time of these shared tasks. We show that, surprisingly, evalua-tion metrics which behave similarly on these datasets (average-scoring range) strongly dis-agree in the higher-scoring range in which cur-rent systems now operate. It is problematic because metrics disagree yet we can’t decide which one to trust. This is a call for collect-ing human judgments for high-scorcollect-ing sum-maries as this would resolve the debate over which metrics to trust. This would also be greatly beneficial to further improve summa-rization systems and metrics alike.
1 Introduction
The progress in summarization is tightly inter-twined with the capability to quickly measure im-provements. Thus, a significant body of research was dedicated to the development of automatic metrics (Lloret et al.,2018). Yet, this remains an open problem (Rankel et al.,2013).
Typically, evaluation metrics are compared based on their ability to correlate with humans (Lin and Hovy, 2003). Then, the selected met-rics heavily influence summarization research by guiding progress (Lloret et al.,2018) and by pro-viding supervision for training summarization sys-tems (Yogan et al.,2016).
Despite their central role, few human judgment datasets have been created. The existing ones are the result of the manual evaluations performed
∗
[image:1.595.328.502.225.325.2]Research partly done at UKP Lab from TU Darmstadt
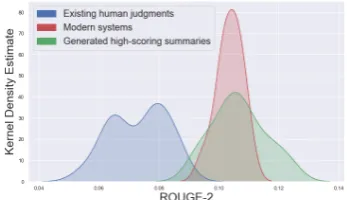
Figure 1: The blue distribution represents the score dis-tribution of summaries available in the human judg-ment datasets of TAC-2008 and TAC-2009. The red distribution is the score distribution of summaries gen-erated by mordern systems. The green distribution cor-responds to the score distribution of summaries we gen-erated in this work as described in section3.
during shared tasks (Dang and Owczarzak,2008,
2009).
Thus, the annotated summaries are mostly aver-agecompared to nowadays standards. Indeed, the best systems submitted at the time of these shared-tasks have typically served as baselines for subse-quent works. This is illustrated by figure1, which compares the score distribution of summaries in human judgment datasets with the score distri-bution of modern summarization systems.1 The score distribution on which evaluation metrics are tested (blue zone) differs from the one in which they now operate (red zone). Thus, there is no guarantee that evaluation metrics behave accord-ing to human judgments in the high-scoraccord-ing range. Yet, summarization systems explicitly target high-scoring summaries (Radev et al.,2003).
In this work, we study several evaluation met-rics in this high-scoring range based on an auto-matically generated dataset. We show that, even though current evaluation metrics correlate well
1for modern systems, we used the scores of summaries
with each other in the average range, they strongly disagree for high-scoring summaries. This is re-lated to theSimpson paradox, where different con-clusions are drawn depending on which slice of the population is considered (Wagner,1982). This is problematic because current metrics cannot be distinguished based solely on an analysis of avail-able human judgments. Nevertheless, they will promote very different summaries and systems.
These results call for the gathering of human judgments in the high-scoring range. We provide data and code to reproduce our experiments.2
Contributions:
(i) We present a simple methodology to study the behavior of metrics in the high-scoring range.
(ii) We observe low and even some negative cor-relations in this range.
(iii) This work serves as a motivation to gather human annotations in the relevant scoring range.
2 Background
Usually, evaluation metrics are compared based on their ability to correlate with human judgments (Lin and Hovy, 2003). Several works followed this principle and provided different recommen-dations about which metric to use. For instance,
Owczarzak et al. (2012) used a signed Wilcoxon testto find significant differences between metrics and recommended to use ROUGE-2 recall with stemming and stopwords not removed. In a wider study, Graham(2015) found ROUGE-2 precision with stemming and stopwords removed to be the best.Rankel et al.(2013) used accuracy and found ROUGE-4 to perform well. They also observe that the correlation between ROUGE and human judg-ments decreases when looking at the best systems only. This is in agreement with our work, except that we look at summaries better than the current state-of-the-art. Radev et al.(2003) also observed that the high-scoring range is the most relevant for comparing evaluation metrics because summariz-ers aim to extract high-scoring summaries. How-ever, they performed analysis on the best scoring summaries from 6 systems which remain average compared to nowadays standard.
Our analysis differs from such meta-evaluation (evaluation of evaluation metrics) because we do not provide another metric recommendation.
In-2https://github.com/PeyrardM/
acl-2019-Compare_Evaluation_Metrics
stead, we start from the observation that human judgments are limited in their coverage and an-alyze the behavior of existing candidate metrics in the high-scoring range not available in these datasets.
These previous works computed correlations between metrics and humans, we compute corre-lations between pairs of metrics in scoring ranges for which there are no human judgments available.
3 Data Generation
In this work, we study the following metrics:
ROUGE-2 (R-2): measures the bigram overlap between the candidate summary and the pool of reference summaries (Lin,2004).
ROUGE-L (R-L): a variant of ROUGE which measures the size of the longest common sub-sequence between candidate and reference sum-maries.
ROUGE-WE (R-WE): instead of hard lexical matching of bigrams, R-WE uses soft matching based on the cosine similarity of word embeddings (Ng and Abrecht,2015).
JS divergence (JS-2): uses Jensen-Shannon di-vergence between bigram distributions of refer-ences and candidate summaries (Lin et al.,2006).
S3: a metric trained explicitly to maximize its correlation with manual Pyramid annotations (Peyrard et al.,2017).
We chose these metrics because they correlate well with available human judgments (about .4
Kendall’s τ; the exact numbers are provided in appendixA) and are easily available. For a recent overview of evaluation metrics, we recommend
Lloret et al.(2018).
Once an evaluation metric becomes standard, it is optimized, either directly by supervised meth-ods or indirectly via repeated comparisons of un-supervised systems. To mimic this procedure, we optimized each metric using a recently introduced genetic algorithm for summarization (Peyrard and Eckle-Kohler, 2016).3 The metric m is used as the fitness function. The resulting population is a set of summaries ranging from random to upper-bound according to m. For both TAC-2008 and TAC-2009, we used a population of 400 sum-maries per topic (per metric). The final dataset contains 160,523 summaries for an average of
3https://github.com/UKPLab/
R-WE R-L JS-2 S3 R-2 (W) (A) (T) .774 .644 .016 .708 .532 -.187 .871 .887 .284 .799 .744 .096 R-WE (W) (A) (T) -.692 .462 -.254 .703 .530 -.145 .824 .752 .131 R-L (W) (A) (T) - -.647 .492 -.274 .709 .571 -.200 JS-2 (W) (A) (T) - - -.738 .659 -.046
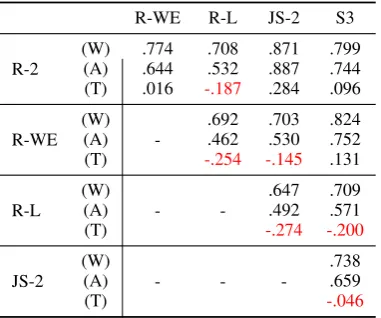
Table 1: Pairwise correlation (Kendall’s τ) between evaluation metrics on various scoring range. (T) is the high-scoring range, (A) is the average-scoring range (human judgment datasets) and (W) is the whole scor-ing range
1,763summaries per topic (less than5∗400due to removed duplicates). We refer to this dataset as (W) as it covers the whole scoring range.
In order to focus on the top-scoring summaries, we preserve the summaries scoring higher than the LexRankbaseline (Erkan and Radev,2004) for at least one metric. LexRank is a graph-based extrac-tive summarizer often used as a baseline. Thus, most current and future summarization systems should perform better and should be covered by the selected scoring range. Besides, LexRank is strong enough to discard a large number of av-erage scoring summaries. The resulting dataset contains an average of 102 summaries kept per topic. This dataset of top-scoring summaries is noted (T). The ROUGE-2 score distribution of (T) is depicted by the green area in figure1.
We provide the pseudo-code and other details concerning the data generation procedure in ap-pendixB.
Additionally, we refer to the summaries avail-able as part of the human judgment datasets as (A) because they cover the average-scoring range.
4 Correlation Analysis
We compute the pairwise correlations between evaluation metrics averaged over all topics for dif-ferent scoring ranges and report the results in ta-ble1. For (A) and (W), we observe high correla-tions between pairs of metrics (> .6Kendall’sτ).
JS-2andR-2have the strongest correlation, while
[image:3.595.309.521.64.214.2]R-Lis less correlated with the others. It is worth remembering that JS-2 andR-2 both operate on
Figure 2: Percentage of disagreement between metrics for increasing scores of summary pairs (Scores have been normalized).
bigrams which also explain their stronger connec-tion.
However, in the high-scoring range (T), corre-lations are low and often negative. Even,R-2and
JS-2only retain little correlation (<0.3τ). For most pairs, the correlations are close to what would be expected from random behavior. Addi-tionally,R-Lhas negative correlations with other metrics. It indicates that there is no global agree-ment on what constitutes improveagree-ments when the summaries are already better than the baseline.
This is akin to the Simpson paradox because considering different sub-populations yields different conclusions (Wagner, 1982). In fact, it is simple to distinguish obviously bad from obviously good summaries, which results in superficially high correlations when the whole scoring range is considered (Radev et al., 2003). However, summarization systems target the high-scoring range and evaluation metrics should accurately distinguish between high-scoring sum-maries. Unfortunately, existing metrics disagree wildly in this range.
Disagreement increases with higher-scoring summaries:
The problem with reporting several disagreeing metrics:
It is a common good practice to report the results of several evaluation metrics. In the average scor-ing range, where metrics generally agree, this cre-ates a robust measure of progress. The specificities of each metric are averaged-out putting the focus on the general trend.
However, when the metrics do not correlate, provements according to one metric are rarely im-provements for the other ones.
Let M = {m1, . . . , mn} be the set of
evalua-tion metrics. Then, for a topicT from the dataset (W), we select a summary sand ask: among the summaries which are better thansfor one metric (N), how many are better for all metrics (F)? This is given by:
F N =
|{x∈ T |∀m∈M, m(x)> m(s)}| |{x∈ T |∃m∈M, m(x)> m(s)}| (1)
Here,m(x)is the score of the summaryx accord-ing to the metric m. Thus, NF measures the dif-ficulty of finding consistent improvements across metrics.
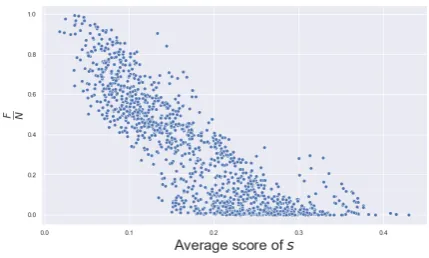
The process is repeated for 5,000 randomly sampled summaries in the sources. In figure3, the resulting NF ratios are reported against the normal-ized average score of the selected summariess.
We observe a quick decrease in the ratio NF. The proportion of consistent improvements (agreed by all metrics) is dropping when the average score of summaries increases. When the baseline scores go up, the disagreement between metrics is strong enough that we cannot identify summaries which are considered better than the baseline for each metric. Thus, there is no common trend between metrics that can be exploited by reporting them together.
Discussion:
Intuitively, smaller populations and narrow scor-ing ranges can also lead to lower correlations. However, (T) displays low correlations with 102
[image:4.595.308.523.64.193.2]summaries per topic whereas (A) has strong correlations with 50 summaries per topic. Also, the high-scoring range covers 38% of the full scoring range (from LexRank to upper-bound), while human judgments cover 35% of the full scoring range. Thus, the width of the scoring range and the population size do not explain the
Figure 3: Thex-axis is the score of the normalized av-erage score ofsgiven by n1P
imi(s)after the metrics
have been normalized between 0 and 1. On they-axis:
F
N associated to the sampled summarys. We also
re-port the average performance of current systems.
observed differences.
As a limitation of this study, we can note that the data generation procedure simulates further progress in summarization by stochasti-cally optimizing each evaluation metric. While this constitutes a good approximation, there is no guarantee that high-scoring summaries are sampled with the same distribution as future summarization systems. However, the sampling still covers a large diversity of high-scoring sum-mary and reveal general properties of evaluation metrics.
Other tasks:
Our analysis is performed on TAC-2008 and TAC-2009 because they are benchmark datasets typically used for comparing evaluation metrics. However, our approach can be applied to any dataset. In particular, for future work, this study could be replicated for related fields likeMachine TranslationorNatural Language Generation.
5 Conclusion
summaries.
Indeed, since metrics strongly disagree in the high-scoring regime, at least some of them are de-viating largely from humans. By collecting human judgments in this specific range, we could identify the best ones using standard meta-evaluation tech-niques. Such annotations would also be greatly beneficial to improve summarization systems and evaluation metrics alike.
Acknowledgements
This work was partly supported by the Ger-man Research Foundation (DFG) as part of the Research Training Group “Adaptive Prepara-tion of InformaPrepara-tion from Heterogeneous Sources” (AIPHES) under grant No. GRK 1994/1, and via the German-Israeli Project Cooperation (DIP, grant No. GU 798/17-1). We also thank the anonymous reviewers for their comments.
References
Ziqiang Cao, Furu Wei, Sujian Li, Wenjie Li, Ming Zhou, and WANG Houfeng. 2015. Learning Sum-mary Prior Representation for Extractive Summa-rization. In Proceedings of the 53rd Annual Meet-ing of the Association for Computational LMeet-inguistics and the 7th International Joint Conference on Natu-ral Language Processing, volume 2, pages 829–833.
Hoa Trang Dang and Karolina Owczarzak. 2008. Overview of the TAC 2008 Update Summarization Task. InProceedings of the First Text Analysis Con-ference (TAC 2008), pages 1–16.
Hoa Trang Dang and Karolina Owczarzak. 2009. Overview of the TAC 2009 Summarization Track. InProceedings of the First Text Analysis Conference (TAC 2009), pages 1–12.
G¨unes Erkan and Dragomir R. Radev. 2004. LexRank: Graph-based Lexical Centrality As Salience in Text Summarization. Journal of Artificial Intelligence Research, pages 457–479.
Yvette Graham. 2015. Re-evaluating automatic sum-marization with bleu and 192 shades of rouge. In Proceedings of the 2015 Conference on Empirical Methods in Natural Language Processing, pages 128–137. Association for Computational Linguis-tics.
Kai Hong, John M. Conroy, benoit Favre, Alex Kulesza, Hui Lin, and Ani Nenkova. 2014. A Repository of State of the Art and Competitive Baseline Summaries for Generic News Summariza-tion. In Proceedings of the Ninth International Conference on Language Resources and Evaluation (LREC’14), pages 1608–1616.
Chin-Yew Lin. 2004. ROUGE: A Package for Auto-matic Evaluation of Summaries. In Text Summa-rization Branches Out: Proceedings of the ACL-04 Workshop, pages 74–81, Barcelona, Spain. Associa-tion for ComputaAssocia-tional Linguistics.
Chin-Yew Lin, Guihong Cao, Jianfeng Gao, and Jian-Yun Nie. 2006. An Information-Theoretic Approach to Automatic Evaluation of Summaries. In Pro-ceedings of the Human Language Technology Con-ference at NAACL, pages 463–470, New York City, USA.
Chin-Yew Lin and Eduard Hovy. 2003. Auto-matic Evaluation of Summaries Using N-gram Co-occurrence Statistics. In Proceedings of the 2003 Conference of the North American Chapter of the Association for Computational Linguistics on Hu-man Language Technology, volume 1, pages 71–78.
Elena Lloret, Laura Plaza, and Ahmet Aker. 2018.
The Challenging Task of Summary Evaluation: An Overview. Language Resources and Evaluation, 52(1):101–148.
Ramesh Nallapati, Feifei Zhai, and Bowen Zhou. 2017. SummaRuNNer: A Recurrent Neural Net-work Based Sequence Model for Extractive Summa-rization of Documents. InAAAI, pages 3075–3081.
Jun-Ping Ng and Viktoria Abrecht. 2015. Better sum-marization evaluation with word embeddings for rouge. In Proceedings of the 2015 Conference on Empirical Methods in Natural Language Process-ing, pages 1925–1930, Lisbon, Portugal. Associa-tion for ComputaAssocia-tional Linguistics.
Karolina Owczarzak, John M. Conroy, Hoa Trang Dang, and Ani Nenkova. 2012. An Assessment of the Accuracy of Automatic Evaluation in Summa-rization. InProceedings of Workshop on Evaluation Metrics and System Comparison for Automatic Sum-marization, pages 1–9, Montreal, Canada. Associa-tion for ComputaAssocia-tional Linguistics.
Maxime Peyrard, Teresa Botschen, and Iryna Gurevych. 2017. Learning to score system summaries for better content selection evalua-tion. In Proceedings of the EMNLP workshop ”New Frontiers in Summarization”, pages 74–84. Association for Computational Linguistics.
Maxime Peyrard and Judith Eckle-Kohler. 2016.
A General Optimization Framework for Multi-Document Summarization Using Genetic Algo-rithms and Swarm Intelligence. InProceedings of the 26th International Conference on Computational Linguistics (COLING), pages 247 – 257.
Maxime Peyrard and Iryna Gurevych. 2018. Objec-tive function learning to match human judgements for optimization-based summarization. In Proceed-ings of the 16th Annual Conference of the North American Chapter of the Association for Computa-tional Linguistics: Human Language Technologies, pages 654–660. Association for Computational Lin-guistics.
Dragomir R. Radev, Simone Teufel, Horacio Saggion, Wai Lam, John Blitzer, Hong Qi, Arda C¸ elebi, Danyu Liu, and Elliott Drabek. 2003. Evaluation Challenges in Large-scale Document Summariza-tion. InProceedings of the 41st Annual Meeting on Association for Computational Linguistics - Volume 1, ACL ’03, pages 375–382.
Peter A. Rankel, John M. Conroy, Hoa Trang Dang, and Ani Nenkova. 2013. A Decade of Automatic Content Evaluation of News Summaries: Reassess-ing the State of the Art. InProceedings of the 51st Annual Meeting of the Association for Computa-tional Linguistics, pages 131–136, Sofia, Bulgaria. Association for Computational Linguistics.
Clifford H Wagner. 1982. Simpson’s Paradox in Real Life.The American Statistician, 36(1):46–48.
A Correlation with Human Judgments
For each metric that we consider in the paper, we computed its correlation with human judgments in both TAC-2008 and TAC-2009 datasets (Peyrard and Eckle-Kohler, 2017). We used two kinds of human annotations available in these datasets: Re-sponsiveness which is score given by human on 5-point LIKERT scale, and Pyramid where anno-tators follow the Pyramid annotation guideline to annotate content selection. The correlations are computed with Kendall’sτ for each topic and av-eraged over all topics in both datasets. The results are reported in table2.
responsiveness Pyramid
R-2 .391 .451
R-WE .378 .431
R-L .353 .392
JS-2 .379 .444
[image:7.595.305.531.63.335.2]S3 .403 .477
Table 2: Correlation of automatic metrics with human judgments for TAC-2008 and TAC-2009. The correla-tion is measured with Kendall’sτ.
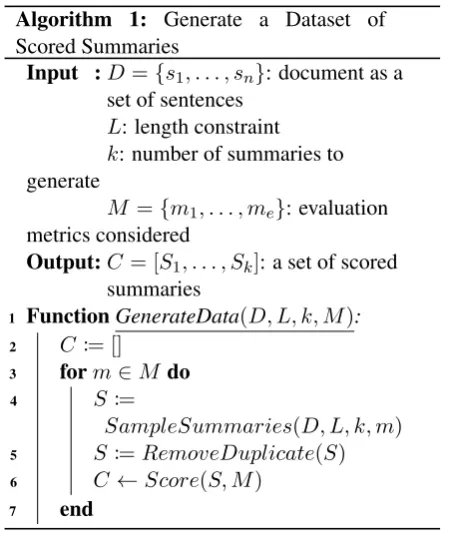
B Data Generation Algorithm
The general data generation procedure is described by algorithm 1. The function Score(S, M)takes a listSof summaries and a list M of evaluation metrics and outputs a list where each summary has been scored by each evalu-ation metric in M. The SampleSummaries function is the genetic algorithm introduced genetic algorithm for summarization (Peyrard and Eckle-Kohler, 2016; Peyrard and Gurevych,
2018). The evaluation metric is optimized by the genetic algorithm and the resulting population is a set of summaries ranging from random to upper-bound.
We used a population of k = 400. Then, the final dataset contains 160,523 summaries for an average of 1,763summaries per topic (less than
5∗400due to removed duplicates).
This algorithm results in a dataset covering the whole scoring range. In order to filter out low and average scoring summaries, we employ the proce-dure described by algorithm2. In this algorithm, the functionScore(T, m) returns a list of all the summaries in the topicT scored by the metricm. The baseline B is an existing algorithm used as
Algorithm 1: Generate a Dataset of Scored Summaries
Input :D={s1, . . . , sn}: document as a
set of sentences L: length constraint k: number of summaries to generate
M ={m1, . . . , me}: evaluation
metrics considered
Output:C= [S1, . . . , Sk]: a set of scored
summaries
1 FunctionGenerateData(D, L, k, M):
2 C := []
3 form∈M do
4 S:=
SampleSummaries(D, L, k, m)
5 S:=RemoveDuplicate(S) 6 C←Score(S, M)
7 end
a threshold: for each metric, we keep every sum-mary scoring higher thanB. The final set of top-scoring summaries is the union of the top-top-scoring summaries of each metric.
For the thresholding, we chose LexRank (Erkan and Radev, 2004), because it is a heavily used baseline. Therefore, most current and future summarization systems should perform better and should be covered by the selected scoring range. Besides, LexRank is strong enough to discard a large number of average scoring summaries. After the selection, we ended up with an average of102
summaries kept per topic.
C Scatter Matrix Plots: TAC-2008 and TAC-2009
(a) Whole scoring range (W). (b) Average-scoring range (A). (c) High-scoring range (T).
Figure 4: Pairwise correlation between evaluation metrics on various scoring range. The generated dataset uses the topics from TAC-2008 and TAC-2009. The human judgments are the ones available as part of TAC-2008 and TAC-2009.
Algorithm 2: Select Top-Scoring Sum-maries
Input :D={T1, . . . ,Tn}: dataset as a
list of topics (each topic contains a list of summaries)
B: baseline algorithm used to decide the high-scoring summaries
M ={m1, . . . , me}: evaluation
metrics considered
Output:D(top): dataset which contain only top-scoring summaries
1 FunctionSelectTopSummaries(D, B, M): 2 D(top):= []
3 forT ∈Ddo
4 T(top):= []
5 form∈Mdo
6 S:= []
7 fors∈Score(T, m)do
8 if
m(s)> m(B(T.source)) then
9 S ←s
10 end
11 end
12 T(top):=T(top)∪S
13 end
14 D(top)←T(top)