http://www.scirp.org/journal/ojogas ISSN Online: 2473-1900
ISSN Print: 2473-1889
DOI: 10.4236/ojogas.2017.24017 Oct. 30, 2017 214 Open Journal of Yangtze Gas and Oil
Well Placement Optimization Using a Basic
Genetic Search Heuristics Algorithm and a
Black Oil Simulator
Charles Y. Onuh*, David Alaigba, Oluwatosin J. Rotimi, Bamidele T. Arowolo
Department of Petroleum Engineering, Covenant University, Ota, Nigeria
Abstract
In petroleum reservoir management, the essence of well placement is to de-velop and maintain reservoir pressure in order to achieve maximum produc-tion for economic benefits. Large producproduc-tion can be achieved with the place-ment of multiple wells but this approach is capital intensive and inefficient for the development of a reservoir. A preferable option is the optimal placement of production and injection wells so as to fully capitalize on the imbedded hy-drocarbons at a relatively decreased capital investment. The aim of this study is to use developed algorithm and a black oil simulator to place wells in the zones for optimal recovery in the reservoir. Optimal production was deter-mined out of eight scenarios created from well placement in a hypothetical reservoir (finch reservoir) using a black oil simulator, alongside an algorithm developed with java for determining the best possible locations for well placement, taking into consideration the reservoir permeability, fluid satura-tion, and pay zone thickness. The results of this study reveal that well place-ment using the engineering judgplace-ment coupled with the application of the al-gorithm using a black oil simulator results in better production compared to other scenarios which consider the combined effect of algorithm and black oil simulator alone.
Keywords
Well Placement, Genetic Algorithm, Reservoir Simulator, Production Analysis, Injection Analysis
1. Introduction
Well placement can be described as the positioning of production and injection
How to cite this paper: Onuh, C.Y., Alaigba, D., Rotimi, O.J. and Arowolo, B.T. (2017) Well Placement Optimization Using a Basic Genetic Search Heuristics Algo-rithm and a Black Oil Simulator. Open Journal of Yangtze Gas and Oil, 2, 214-225.
https://doi.org/10.4236/ojogas.2017.24017
Received: April 6, 2017 Accepted: October 27, 2017 Published: October 30, 2017
Copyright © 2017 by authors and Scientific Research Publishing Inc. This work is licensed under the Creative Commons Attribution International License (CC BY 4.0).
DOI: 10.4236/ojogas.2017.24017 215 Open Journal of Yangtze Gas and Oil wells in an oil field to optimally deplete the reservoir. Knowledge of this key concept is a necessary requirement to effectively utilize the reservoirs natural pressure; this will ensure optimal drainage of the saturating hydrocarbons [1]. A decision on optimal well location is normally a tedious process which is affected by geologic complexities, engineering limitations and economics. These factors must be properly accounted for to avoid the adverse effect on the general per-formance of the reservoir and place limit to the recoverable hydrocarbon re-serves. An interesting approach to solving the problem of well placement is the use of quality mapping; it is a two-dimensional representation of multiple flows through a porous medium. In the utilization of quality maps, two approaches are present: the basic quality map approach (BQM) and the modified quality map approach (MQM) [2][3][4].
Another popular method of deciding well architecture is the utilization of si-mulation software to decide well placement positions within a reservoir. This approach utilizes information from seismic surveys, measurement while drilling, special core analysis and also logging to create an electronic sample of the reser-voir. This method is applied to establish the most efficient depletion scheme which may be utilized to produce a well [5].
In order to ensure the optimal productivity of a reservoir, some of the para-mount factors which must be taken into account are the location, timing and types of well utilized for a field development project. The positioning of produc-tion and injecproduc-tion wells is a very critical aspect of oil field development planning (FDP), a phase which deals with the acquisition, analysis and integration of data from geologists, geophysicists and reservoir engineers for the optimal develop-ment of an oil field [6].
Detail work has been done on optimal well placement focusing on the inte-raction within the surface facilities or the reservoir [7]. Henry et al. [8] used combined knowledge of geological model and reservoir properties obtained from log data to build a 3-D reservoir property model, considering facies in identifying sweet spots for optimizing well placement. The integration of the geological and reservoir model assumed negligible interaction between wells which actually reduces complexity and possible computation time, this com-putation may limit the wide application of the result. The method of using quality maps alongside integration programming solution was implemented by
[9]; the use heuristics algorithm technique offers a better solution efficiently for complex computational problems requiring large solution times [8]. Mar-ques et al. [10] investigated the placement of well using reservoir drive me-chanisms (gas cap and water drive) and aquifer size in three different locations: right below the oil water contact, at the middle of the oil column, and right above the oil water contact. The integration of detail engineering judgment and heuristic algorithm will possibly provide efficient result in the well place-ment.
optimiza-DOI: 10.4236/ojogas.2017.24017 216 Open Journal of Yangtze Gas and Oil tion of well placement [11]. With advancement in the speed of computing, more variables can be accounted for with the perspective of a larger scope for better computational result within relatively smaller time frame. Yeten et al. [12] uti-lized a Genetic Algorithm (GA) to maximize well location, well type and trajec-tory for directional wells. Asides that, they also improved and incorporated software based on nonlinear conjugate gradient algorithm to further enhance intelligent well controls.
Genetic Algorithm (GA)
In the field of synthetic intellectual competence, a GA is a search heuristic that mirrors or mimics the approach of normal decision. This heuristic (also occa-sionally called a metaheuristic) is routinely used to create accommodating res-ponses for development and chase problems [13]. Genetic algorithms fit in with the greater class of Transformative Algorithms (TA), which make answers for headway issues using systems moved by normal advancement.
Genetic algorithms find application in bioinformatics, phylogenetic, computa-tional science, Civil engineering/construction, budgetary angles, science, creat-ing, math, material science, pharmacometrics and diverse fields [14].
This study involves the use of 3-D reservoir simulator to generate data which is then run through a heuristic program. Next, the result is coupled with engi-neering judgment in order to generate an optimal solution to the well placement problem. Well placement is extremely a challenging task of reservoir develop-ment, nevertheless, the application of the engineering judgment to the data gen-erated from the simulator integrated with the heuristic algorithm, helps in de-termining the optimum infill well location, and field development plan resulting in the substantial increase in the productivity and reserves. This principle is profitable in wells with complex fluid low and heterogeneous in nature. The heuristics for automated optimization is used for benchmarking performance of well placement. The optimal well placement into areas of the reservoir maximiz-es more flow area of fluid saturation, rmaximiz-esulting in cumulative oil recovery, re-duces level of uncertainty, and this in general will possibly reduce unnecessary cost that may result from inappropriate well placement.
2. Materials and Methods
In this study of well placement in a finch reservoir, a 3-D Reservoir simulator was used to build the model, alongside a genetic algorithm created with the use of the java compiler program for optimum placement of the well, with the engi-neering judgments as guiding factors in order to maximize the reservoir produc-tivity. The varying permeability, porosity and pay zone thickness at different points in the reservoir were used in the developed algorithm to compute the in-jection and production points.
DOI: 10.4236/ojogas.2017.24017 217 Open Journal of Yangtze Gas and Oil multiple configuration being considered by the genetic algorithm and also to obtain the best recovery factor. The efficiency of all scenarios evaluated is then considered in terms of the recovery factor, production profiles and evolution of water cut.
2.1. Engineering Judgment
Engineering judgment involves the exploitation of natural phenomena present in the reservoir. It is based on reservoir parameters such as: The presence of faults, fractures, anisotropy, connectivity, reservoir extent, flooding pattern selection, permeable zone exploitation, fluid distribution within reservoir, in-jection fluid selection, exploitation of reservoir geological features, gravity drainage effect, well spacing and positioning. In applying the engineering judgment, the well placement results from simulator and the GA are modified by placing injection and production wells in the following regions: unswept areas and areas which are not optimally drained by the GA derived well placement.
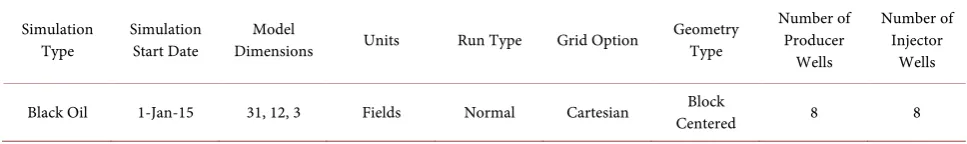
2.2. Basic Model Information
[image:4.595.55.539.440.512.2]The model parameters used for this work is as shown in Table 1, the data ex-tracted from the reservoir model involves the step-by-step selection of cellblocks and then reading measurements of individual cellblock parameters such as:
Table 1. Basic model information.
Simulation
Type Simulation Start Date Dimensions Model Units Run Type Grid Option Geometry Type
Number of Producer
Wells
Number of Injector
Wells
Black Oil 1-Jan-15 31, 12, 3 Fields Normal Cartesian Centered Block 8 8
• Position (x,y,z) • Pressure (psia) • Depth (ft) • Thickness (ft)
• Permeability (millidarcy) • Oil saturation (%) • Water saturation (%)
The objective function of the genetic algorithm describes the value utilized during computing to ascertain the “fitness” of an individual cellblock being con-sidered. The objective function being considered in this work is a crude zonal representation of adequate reservoir properties and well characteristics.
DOI: 10.4236/ojogas.2017.24017 218 Open Journal of Yangtze Gas and Oil Table 2. Injector/producer locations with WPI-Case 1.
Case 1
x y Producer Index x y Injector Index
7 2 × 10¹¹ 17 3 35,093
21 7 2 × 10¹¹ 20 3 33,473
16 7 2 × 10¹¹ 14 3 29,663
19 8 2 × 10¹¹ 7 3 27,019
22 7 2 × 10¹¹ 22 3 25,486
24 7 1 × 10¹¹ 18 4 24,702
9 7 1 × 10¹¹ 15 4 21,417
[image:5.595.207.538.312.498.2]20 8 1 × 10¹¹ 13 4 20,481
Table 3. Injector/producer locations with WPI-Case 2.
Case 2
x y Producer Index x y Injector Index
18 7 2 × 10¹¹ 17 3 35,093
15 7 2 × 10¹¹ 15 3 29,775
17 8 2 × 10¹¹ 17 4 26,600
24 7 1 × 10¹¹ 18 4 24,702
21 8 1 × 10¹¹ 8 3 20,643
9 8 1 × 10¹¹ 19 4 19,342
22 8 9 × 10¹⁰ 17 5 16,869
19 9 9 × 10¹⁰ 26 3 14,605
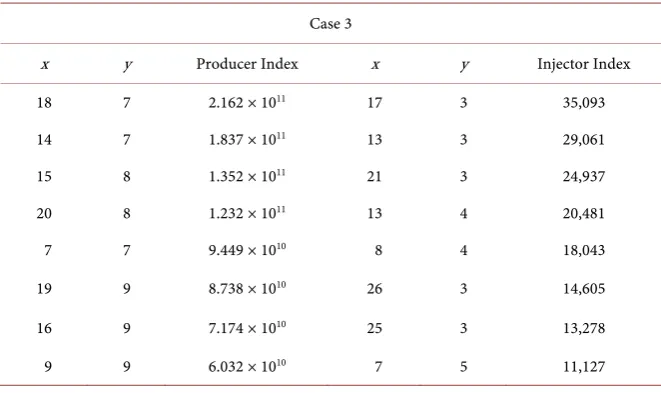
Table 4. Injector/producer locations with WPI-Case 3.
Case 3
x y Producer Index x y Injector Index
18 7 2.162 × 10¹¹ 17 3 35,093
14 7 1.837 × 10¹¹ 13 3 29,061
15 8 1.352 × 10¹¹ 21 3 24,937
20 8 1.232 × 10¹¹ 13 4 20,481
7 7 9.449 × 10¹⁰ 8 4 18,043
19 9 8.738 × 10¹⁰ 26 3 14,605
16 9 7.174 × 10¹⁰ 25 3 13,278
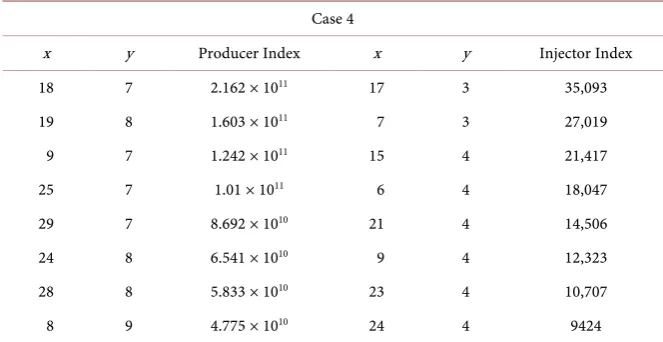
[image:5.595.207.538.530.734.2]DOI: 10.4236/ojogas.2017.24017 219 Open Journal of Yangtze Gas and Oil Table 5. Injector/producer locations with WPI-Case 4.
Case 4
x y Producer Index x y Injector Index
18 7 2.162 × 10¹¹ 17 3 35,093
19 8 1.603 × 10¹¹ 7 3 27,019
9 7 1.242 × 10¹¹ 15 4 21,417
25 7 1.01 × 10¹¹ 6 4 18,047
29 7 8.692 × 10¹⁰ 21 4 14,506
24 8 6.541 × 10¹⁰ 9 4 12,323
28 8 5.833 × 10¹⁰ 23 4 10,707
8 9 4.775 × 10¹⁰ 24 4 9424
Furthermore, the suitability of each cell location is ascertained using the de-rived fitness function. This is given as Equation (1).
p p
W R
ℵ = ∗ (1)
where:
ℵ = Well placement index and,
P
1 well parameter
Depth
W = = (2)
p
R = reservoir parameters
(
)
p x y 1 w
R =K K h −S P for a producer (3)
and
(
w)
p
x y
K K hS R
P
= for an injector (4)
Thus, for a producer, the well placement index is derived by combining Equa-tions (1), (2) and (3) and is given as:
(
w)
prod
1
x y
K K h S P
D
−
ℵ = (5)
And similarly, for an injector, the well placement index is derived by combin-ing Equations (1), (2) and (4) and is given as:
w inj
x y
K K hS
PD
ℵ = (6)
Objective Function Parameters 1) Reservoir
Reservoir parameters considered for the formation of the objective function (for individual cells):
• Pressure
• Saturation (oil and water) • Thickness (h) and
DOI: 10.4236/ojogas.2017.24017 220 Open Journal of Yangtze Gas and Oil Based on these parameters, an index which is a multiple of the parameters above was created, which directly defines the favorability of each position.
2) Well
Well parameters considered for the formation of the objective function (also for individual cells):
• Depth
This approach assumes other well variables are constant. Hence the most de-fining factor is the depth the well would reach in the reservoir. It is important to state here that the increase in cost of drilling a well is directly proportional to the depth of the well (i.e. greater depth = greater cost).
3) Production analysis
The production analysis for the genetic algorithm involves the use of the ob-jective function with the reservoir parameters dependent on multiple of pressure, oil saturation, permeability in the x direction (vertical well consideration), the thickness of the contact cell and depth. These considerations are required in or-der to account for favorable production well placement. The genetic algorithm is aimed at the identification of well combinations, which would give the best cu-mulative oil production..
4) Injection analysis
Injection analysis inputted into the genetic algorithm, involves the use of the objective function with the reservoir parameters dependent on the multiple of thickness of the contact cell, permeability in the x direction (also considering vertical injection wells). These factors being considered are highly important in the consideration of injection parameters.
The data is inputted into the algorithm to discover the positions which have the highest injectivity indices.
3. Results and Discussion
The model is of two different categories: the study case (with the singular use of GA) and the case with the use of GA and reservoir engineering judgments as a major contributing factor. Each case is evaluated using a time step of 15 years and subsequently ranked based on field oil production rate, water breakthrough time, field pressure and recovery factor.
3.1. Case Scenarios
Following the derivation of the well placement indices for all the cells in the ver-tical direction in order to guide the selection of various cases, the well spacing is not taken into consideration for cases 1 to 4.
Cases 1 to 4 (8 Producers and 8 Injectors)
DOI: 10.4236/ojogas.2017.24017 221 Open Journal of Yangtze Gas and Oil manner. The locations of production and injection wells with their correspond-ing well placement indices are shown in Tables 2-5.
3.2. Discussion and Analysis of Simulation Results
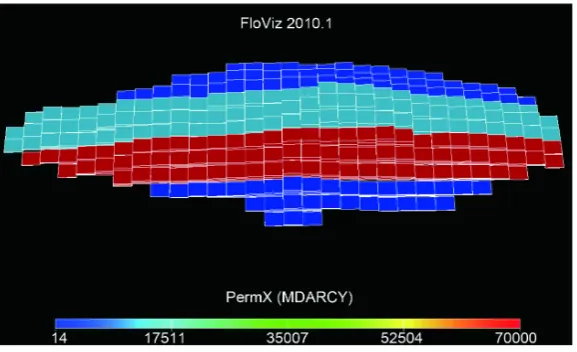
[image:8.595.229.518.530.706.2]Following the acquisition of well placement locations for the four cases, the models for each of them was then incorporated into the grid. Simulation for production and injection forecast was then performed for each of the four cases. The results of the simulation are shown in subsequent figures and tables.
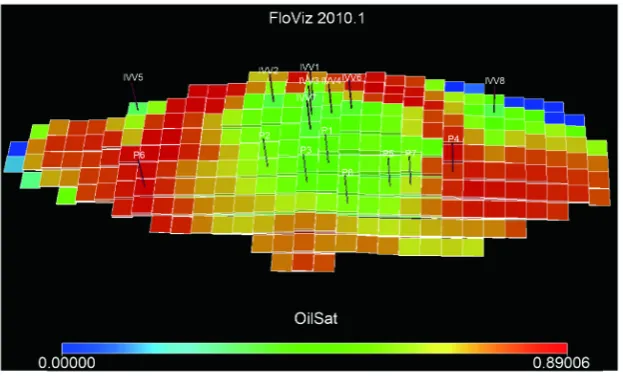
Figure 1 shows the distribution of permeability in the x direction and Figure 2 displays the saturation of oil in the grid block used in the simulations. Figures 3-6 show the locations of the wells in the grid with the post-simulation oil satu-ration distribution. All the four cases have different sweep efficiencies. Figures 7-9 show the field oil production, the cumulative field production and the re-covery factor for all the cases. From Figure 9, it can be observed that cases 3 and 4 have the highest recovery factors somewhere around 34% of the initial oil in place. Whereas, cases 1 and 2 have much lower recovery factors. This is most likely due to the wells positioning in the very sweet spots in cases 3 and 4 as di-rected by the well placement equations. The wells in cases 3 and 4 cover a larger area and hence yields higher sweep efficiencies (The sweetness of the combined producer and injector WPI of the cases reduces from case 4 down to a minimum in case 1). Noting that the development costs for all cases are more or less the same as the fiscal framework, number of wells and surface facilities for all cases are the same. The field oil production rate and cumulative production plots re-veals sufficient economic evaluation. Figure 10 shows the evolution of field wa-ter cut with time. Whereas, cases 3 and 4 seem to have higher wawa-ter cut com-pared to cases 1 and 2, their recoveries (Figure 9) and cumulative oil production (Figure 8) are higher. This is because, some of the production wells in cases 1 and 2 get to the upper limit for the maximum allowable water cut and then the wells are shut-in. This leads to a corresponding reduction in total field water production for cases 1 and 2.
DOI: 10.4236/ojogas.2017.24017 222 Open Journal of Yangtze Gas and Oil Figure 2. Grid showing oil sat profile at simulation start.
Figure 3. Well location/post-production oil sat distribution—case 1.
[image:9.595.220.532.517.705.2]DOI: 10.4236/ojogas.2017.24017 223 Open Journal of Yangtze Gas and Oil Figure 5. Well location /post-production oil sat distribution—case 3.
Figure 6. Well location/post-production oil sat distribution—case 4.
4. Conclusions
The following are evident looking at the results obtained in Figures 7-10:
[image:10.595.243.503.546.704.2]DOI: 10.4236/ojogas.2017.24017 224 Open Journal of Yangtze Gas and Oil Figure 8. Cumulative field oil production—all cases.
Figure 9. Evolution of recovery factors—all cases.
Figure 10. Field water cut—all cases.
[image:11.595.243.501.463.614.2]DOI: 10.4236/ojogas.2017.24017 225 Open Journal of Yangtze Gas and Oil case is case 1 which is the optimal case proposed by the algorithm. The involve-ment of geological constraints (anticlines, faults, fractures etc.) into the solution of the genetic algorithm helped in providing a more suitable analysis. In the analysis, an improved solution on the well positioning was obtained from the smaller sample size implemented through the genetic algorithm.
References
[1] Akpan, S.E. (2012) Well Placement for Maximum Production in the Norwegian Sea. Trondheim Norwegian of Science and Technology, Trondheim.
[2] Badru, O., Stanford, U., Kabir, C.S. and Petroleum, C.O. (2003) SPE 84191 Well Placement Optimization in Field Development. SPE Annual Technical Conference and Exhibition, Denver, October 2003, 1-9.
[3] Nakajima, L. and Schiozer, D.J. (2003) Horizontal Well Placement Optimization Using Quality Map Definition. Canadian International Petroleum Conference, Cal-gary, 10-12 June 2003, 1-10. https://doi.org/10.2118/2003-053
[4] Seifert, D., Lewis, J.J.M., Hern, C.Y. and Steel, N.C.T. (1996) Well Placement Opti-misation and Risking using 3-D Stochastic Reservoir Modelling Techniques. Euro-pean 3-D Reservoir Modelling Conference, Stravanger, April 1996, 289-300. [5] Guyaguler, B. and Horne, R.N. (2001) SPE 71625 Uncertainty Assessment of Well
Placement Optimization. SPE Annual Technical Conference and Exhibition, Loui-siana, 30 September-3 October 2001, 1-13. https://doi.org/10.2118/71625-MS [6] Aitokhuehi, I., Durlofsky, L.J., Artus, V., Yeten, B. and Aziz, K. (2004) Optimization
of Advanced Well Type and Performance. 9th European Conference on the Ma-thematics of Oil Recovery, Cannes, September 2004, 1-8.
[7] Tavallali, M.S., Karimi, A., Halim, A., Baxendale, D. and Teo, K.M. (2014) Well Placement, Infrastructure Design, Facility Allocation, and Production Planning in Multireservoir Oil Fields with Surface Facility Networks. Industrial Engineering & Chemical Research, 53, 11033-11049. https://doi.org/10.1021/ie403574e
[8] Henery, F., Trimbitasu, L. and Johnson, J. (2011) An Integrated Workflow for Re-servoir Sweet Spot Identification. Gussow Geoscience Conference, Calgary, 2011, 1-2.
[9] Vasantharajan, S. and Cullick, A.S. (1993) Well Site Selection Using Integer Pro-gramming. IAMG ’97, CIMNE, 1993, 421-426.
[10] Marques, I. and Athichanagorn, S. (2015) Optimal Horizontal Well Placement in Combination-Drive Thin Oil Rim. International Journal of Earth Sciences and En-gineering, 8, 266-271.
[11] Montes, G., Bartolome, P. and Udias, A.L. (2001) The Use of Genetic Algorithms in Well Placement Optimization. SPE Latin American and Caribbean Petroleum En-gineering Conference, Buenos Aires, 25-28 March 2001, 1-10.
https://doi.org/10.2118/69439-MS
[12] Yeten, B., Durlofsky, L.J. and Aziz, K. (2002) SPE 77565 Optimization of Noncon-ventional Well Type, Location and Trajectory. SPE Annual Technical Conference and Exhibition, San Antonio, October 2002, 1-14.
[13] Zhang, Q. (2014) Design of Early Warning Decision System for Uncertain Network Public Opinion Emergency. International Journal of Application or Innovation in Engineering & Management, 3, 32-39.