MUTT: Metric Unit TesTing
for Language Generation Tasks
Willie Boag, Renan Campos, Kate Saenko, Anna Rumshisky
Dept. of Computer Science
University of Massachusetts Lowell
198 Riverside St, Lowell, MA 01854
{wboag,rcampos,saenko,arum}@cs.uml.edu
Abstract
Precise evaluation metrics are important for assessing progress in high-level lan-guage generation tasks such as machine translation or image captioning. Histor-ically, these metrics have been evaluated using correlation with human judgment. However, human-derived scores are often alarmingly inconsistent and are also limited in their ability to identify precise areas of weakness. In this paper, we perform a case study for metric evaluation by measuring the effect that systematic sentence trans-formations (e.g. active to passive voice) have on the automatic metric scores. These sentence “corruptions” serve as unit tests for precisely measuring the strengths and weaknesses of a given metric. We find that not only are human annotations heavily in-consistent in this study, but that the Met-ric Unit TesT analysis is able to capture precise shortcomings of particular metrics (e.g. comparing passive and active sen-tences) better than a simple correlation with human judgment can.
1 Introduction
The success of high-level language generation tasks such as machine translation (MT), paraphrasing and image/video captioning depends on the existence of reliable and precise automatic evaluation metrics.
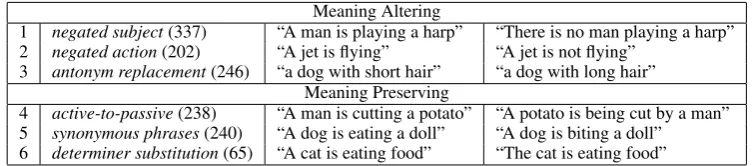
Figure 1: A few select entries from the SICK dataset. All of these entries follow the same “Negated Subject” transfor-mation between sentence 1 and sentence 2, yet humans anno-tated them with an inconsistently wide range of scores (from 1 to 5). Regardless of whether the gold labels for this partic-ular transformation should score this high or low, theyshould score be scored consistently.
Efforts have been made to create standard met-rics (Papineni et al., 2001; Lin, 2004; Denkowski and Lavie, 2014; Vedantam et al., 2014) to help advance the state-of-the-art. However, most such popular metrics, despite their wide use, have seri-ous deficiencies. Many rely on ngram matching and assume that annotators generate all reasonable refer-ence sentrefer-ences, which is infeasible for many tasks. Furthermore, metrics designed for one task, e.g., MT, can be a poor fit for other tasks, e.g., video cap-tioning.
a metric is ”good” based on correlation with incon-sistent human scores. When ”gold” target data is unreliable, even good metrics can appear to be inac-curate.
Furthermore, correlation of system output with human-derived scores typically provides an overall score but fails to isolate specific errors that met-rics tend to miss. This makes it difficult to dis-cover system-specific weaknesses to improve their performance. For instance, an ngram-based metric might effectively detect non-fluent, syntactic errors, but could also be fooled by legitimate paraphrases whose ngrams simply did not appear in the training set. Although there has been some recent work on paraphrasing that provided detailed error analysis of system outputs (Socher et al., 2011; Madnani et al., 2012), more often than not such investigations are seen as above-and-beyond when assessing metrics.
The goal of this paper is to propose a process for consistent and informative automated analysis of evaluation metrics. This method is demonstrably more consistent and interpretable than correlation with human annotations. In addition, we extend the SICK dataset to include un-scored fluency-focused sentence comparisons and we propose a toy metric for evaluation.
The rest of the paper is as follows: Section 2 introduces the corruption-based metric unit testing process, Section 3 lists the existing metrics we use in our experiments as well as the toy metric we propose, Section 4 describes the SICK dataset we used for our experiments, Section 5 motivates the need for corruption-based evaluation instead of cor-relation with human judgment, Section 6 describes the experimental procedure for analyzing the met-ric unit tests, Section 7 analyzes the results of our experiments, and in Section 8 we offer concluding remarks.
2 Metric Unit TesTs
We introduce metric unit tests based on sentence corruptionsas a new method for automatically eval-uating metrics developed for language generation tasks. Instead of obtaining human ranking for system output and comparing it with the metric-based ranking, the idea is to modify existing
ref-erences with specific transformations, and exam-ine the scores assigned by various metrics to such corruptions. In this paper, we analyze three broad categories of transformations – meaning-altering, meaning-preserving, and fluency-disrupting sen-tence corruptions – and we evaluate how success-fully several common metrics can detect them.
As an example, the original sentence “A man is playing a guitar.” can be corrupted as follows:
Meaning-Altering: A man is not playing guitar. Meaning-Preserving: A guitar is being played by a man.
Fluency-Disrupting: A man a guitar is playing.
Examples for each corruption type we consider are shown in Tables 1 and 2.
2.1 Meaning-altering corruptions
Meaning-altering corruptions modify the seman-tics of a sentence, resulting in a new sentence that has a different meaning. Corruptions (1– 2) check whether a metric can detect small lex-ical changes that cause the sentence’s semantics to entirely change. Corruption (3) is designed to fool distributed and distributional representations of words, whose vectors often confuse synonyms and antonyms.
2.2 Meaning-preserving corruptions
Meaning-preserving corruptions change the lexical presentation of a sentence while still preserving meaning and fluency. For such transformations, the “corruption” is actually logically equivalent to the original sentence, and we would expect that consis-tent annotators would assign roughly the same score to each. These transformations include changes such as rephrasing a sentence from active voice to passive voice (4) or paraphrasing within a sentence (5).
2.3 Fluency disruptions
Meaning Altering
1 negated subject(337) “A man is playing a harp” “There is no man playing a harp” 2 negated action(202) “A jet is flying” “A jet is not flying”
3 antonym replacement(246) “a dog with short hair” “a dog with long hair” Meaning Preserving
4 active-to-passive(238) “A man is cutting a potato” “A potato is being cut by a man” 5 synonymous phrases(240) “A dog is eating a doll” “A dog is biting a doll”
[image:3.595.109.486.119.202.2]6 determiner substitution(65) “A cat is eating food” “The cat is eating food”
Table 1:Corruptions from the SICK dataset. The left column lists the number of instances for each corruption type.
Fluency disruptions
7 double PP(500) “A boy walks at night” “A boy walks at night at night” 8 remove head from PP(500) “A man danced in costume” “A man danced costume” 9 re-order chunked phrases(500) “A woman is slicing garlics” “Is slicing garlics a woman”
Table 2:Generated corruptions. The first column gives the total number of generated corruptions in parentheses.
3 Metrics Overview
3.1 Existing Metrics
Many existing metrics work by identifying lexical similarities, such as n-gram matches, between the candidate and reference sentences. Commonly-used metrics include BLEU, CIDEr, and TER:
• BLEU, an early MT metric, is a precision-based metric that rewards candidates whose words can be found in the reference but pe-nalizes short sentences and ones which overuse popular n-grams (Papineni et al., 2001).
• CIDEr, an image captioning metric, uses a consensus-based voting of tf-idf weighted ngrams to emphasize the most unique seg-ments of a sentence in comparison (Vedantam et al., 2014).
• TER (Translation Edit Rate) counts the changes needed so the surface forms of the out-put and reference match (Snover et al., 2006).
Other metrics have attempted to capture similar-ity beyond surface-level pattern matching:
• METEOR, rather than strictly measuring ngram matches, accounts for soft similari-ties between sentences by computing synonym and paraphrase scores between sentence align-ments (Denkowski and Lavie, 2014).
• BADGER takes into account the contexts over the entire set of reference sentences by using a simple compression distance calculation af-ter performing a series of normalization steps (Parker, 2008).
• TERp (TER-plus) minimizes the edit dis-tance by stem matches, synonym matches, and phrase substitutions before calculating the TER score, similar to BADGER’s normaliza-tion step (Snover et al., 2009).
We evaluate the strengths and weaknesses of these existing metrics in Section 7.
3.2 Toy Metric: W2V-AVG
To demonstrate how this paper’s techniques can also be applied to measure a new evaluation metric, we create a toy metric, W2V-AVG, using the cosine of the centroid of a sentence’s word2vec embeddings (Mikolov et al., 2013). The goal for this true bag-of-words metric is to serve as a sanity check for how corruption unit tests can identify metrics that cap-ture soft word-level similarities, but cannot handle directed relationships between entities.
4 Datasets
4.1 SICK
which contains entries consisting of a pair of sen-tences and a human-estimated semantic relatedness score to indicate the similarity of the sentence pair (Marelli et al., 2014). The reason we use this data is twofold:
1. it is a well-known and standard dataset within semantic textual similarity community. 2. it contains many common sentence
transfor-mation patterns, such as those described in Ta-ble 1.
The SICK dataset was built from the 8K Image-Flickr dataset1 and the SemEval 2012 STS
MSR-Video Description corpus2. Each of these
origi-nal datasets contain human-generated descriptions of images/videos – a given video often has 20-50 reference sentences describing it. These reference sets prove very useful because they are more-or-less paraphrases of one another; they all describe the same thing. The creators of SICK selected sentence pairs and instructed human annotators to ensure that all sentences obeyed proper grammar. The creators of SICK ensured that two of the corruption types – meaning-altering and meaning-preserving – were generated in the annotated sentence pairs. We then filtered through SICK using simple rule-based tem-plates3 to identify each of the six corruption types
listed in Table 1. Finally, we matched the sentences in the pair back to their original reference sets in the Flickr8 and MSR-Video Description corpora to ob-tain reference sentences for our evaluation metrics experiments.
4.2 SICK+
Since all of the entries in the SICK dataset were created for compositional semantics, every sentence was manually checked by annotators to ensure flu-ency. For our study, we also wanted to measure
1http://nlp.cs.illinois.edu/ HockenmaierGroup/data.html
2http://www.cs.york.ac.uk/
semeval-2012/task6/index.php?id=data 3For instance, the “Antonym Replacement” template checked to see if the two sentences were one word apart, and if so whether they had a SICK-annotated NOT ENTAILMENT relationsip.
the effects of bad grammar between sentences, so we automatically generated our own corruptions to the SICK dataset to create SICK+, a set of fluency-disrupting corruptions. The rules to gener-ate these corruptions were simple operations involv-ing chunkinvolv-ing and POS-tagginvolv-ing. Fortunately, these corruptions were, by design, meant to be ungram-matical, so there was no need for (difficult) auto-matic correctness checking for fluency.
5 Inconsistencies in Human Judgment
A major issue with comparing metrics against hu-man judgment is that huhu-man judgments are often inconsistent. One reason for this is that high-level semantic tasks are difficult to pose to annotators. Consider SICK’s semantic relatedness annotation as a case study for human judgment. Annotators were shown two sentences, were asked “To what extent are the two sentences expressing related meaning?”, and were instructed to select an integer from 1 (com-pletely unrelated) to 5 (very related). We can see the difficulty annotators faced when estimating seman-tic relatedness, especially because the task descrip-tion was intendescrip-tionally vague to avoid biasing anno-tator judgments with strict definitions. In the end, “the instructions described the task only through [a handful of] examples of relatedness” (Marelli et al., 2014).
As a result of this hands-off annotation guideline, the SICK dataset contains glaring inconsistencies in semantic relatedness scores, even for sentence pairs where the only difference between two sentences is due to the same known transformation. Figure 1 demonstrates the wide range of human-given scores for the pairs from SICK that were created with the Negated Subject transformation. Since the guide-lines did not establish how to handle the effect of this transformation, some annotators rated it high for describing the same actions, while others rated it low for having completely opposite subjects.
Figure 2: Human annotations for the Negated Subject corruption.
Figure 3:Metric predictions for theNegated Subject cor-ruption.
deviation of about .45. The issue with this distri-bution is that regardless of whether the annotators rank this specific transformation as low or high, they should be ranking it consistently. Instead, we see that their annotations span all the way from 2.5 to 4.5 with no reasonable justification as to why.
Further, a natural question to ask is whether all sentence pairs within this common Negated Sub-jecttransformation do, in fact, share a structure of how similar their relatedness scores “should” be. To answer this question, we computed the similar-ity between the sentences in an automated manner using three substantially different evaluation met-rics: METEOR, BADGER, and TERp. These three
metrics were chosen because they present three very different approaches for quantifying semantic sim-ilarity, namely: sentence alignments, compression redundancies, and edit rates. We felt that these dif-ferent approaches for processing the sentence pairs would allow for different views of their underlying relatedness.
To better understand how similar an automatic metric would rate these sentence pairs, Figure 3 shows the distribution over scores predicted by the METEOR metric. The first observation is that the metric produces scores that are far more peaky than the gold scores in Figure 2, which indicates that they have a significantly more consistent structure about them.
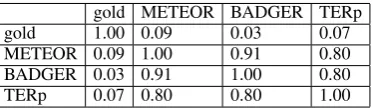
In order to see how each metric’s scores com-pare, Table 3 lists all pairwise correlations between the gold and the three metrics. As a sanity check, we can see that the 1.0s along the diagonal indicate perfect correlation between a prediction and itself. More interestingly, we can see that the three met-rics have alarmingly low correlations with the gold scores: 0.09, 0.03, and 0.07. However, we also see that the three metrics all have significantly higher correlations amongst one another: 0.80, 0.80, and 0.91. This is a very strong indication that the three metrics all have approximate agreement about how the various sentences should be scored, but this con-sensus is not at all reflected by the human judg-ments.
6 MUTT Experiments
In our Metric Unit TesTing experiments, we wanted to measure the fraction of times that a given metric is able to appropriately handle a particular corrup-tion type. Each (original,corrupcorrup-tion) pair is consid-ered a trial, which the metric either gets correct or
gold METEOR BADGER TERp
gold 1.00 0.09 0.03 0.07
METEOR 0.09 1.00 0.91 0.80
BADGER 0.03 0.91 1.00 0.80
TERp 0.07 0.80 0.80 1.00
[image:5.595.311.498.588.643.2]Figure 4: Results for theDeterminer Substitution cor-ruption (usingDifference formulascores).
incorrect. We report the percent of successful trials for each metric in Tables 4, 5, and 6. Experiments were run using 5, 10, and 20 reference sentences to understand which metrics are able perform well without much data and also which metrics are able to effectively use more data to improve. An accu-racy of 75% would indicate that the metric is able to assign appropriate scores 3 out of 4 times.4
For Meaning-altering and Fleuncy-disrupting corruptions, the corrupted sentence will be truly dif-ferent from the original and reference sentences. A trial would be successful when the score of the orig-inalsorig is rated higher than the score of the
cor-ruptionscorr:
sorig> scorr
Alternatively, Meaning-preserving transforma-tions create a ”corruption” sentence which is just as correct as the original. To reflect this, we consider a trial to be successful when the score of the corrup-tionscorris within 15% of the score of the original
sorig:
sorig−scorr sorig+
≤0.15
whereis a small constant (10−9) to prevent
divi-sion by zero. We refer to this alternative trial formu-lation as theDifference formula.
4Our code is made available athttps://github. com/text-machine-lab/MUTT
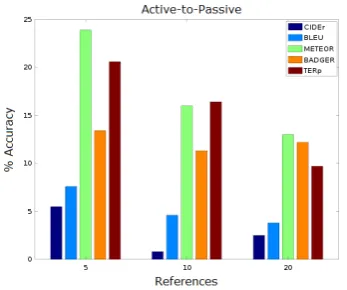
Figure 5: Results for theActive-to-Passive corruption (usingDifference formulascores).
7 Discussion
7.1 Meaning-altering corruptions
As shown by the middle figure in Table 4, it is CIDEr which performs the best for Antonym Re-placement. Even with only a few reference sen-tences, it is already able to score significantly higher than the other metrics. We believe that a large contributing factor for this is CIDEr’s use of tf-idf weights to emphasize the important aspects of each sentence, thus highlighting the modified when com-pared against the reference sentences.
The success of these metrics reiterates the earlier point about metrics being able to perform more con-sistently and reliably than human judgment.
7.2 Meaning-preserving corruptions
The graph in Figure 4 of the determiner substitu-tion corrupsubstitu-tion shows an interesting trend: as the number of references increase, all of the metrics in-crease in accuracy. This corruption replaces “a” in the candidate with a “the’, or vice versa. As the ref-erences increase, there we tend to see more exam-ples which use these determiners interchanagably while keeping the rest of the sentence’s meaning the same. Since a large number of references results in far more for the pair to agree on, the two scores are very close.
[image:6.595.97.276.123.270.2]1. Negated Subject
num refs 5 10 20
CIDEr 99.4 99.4 99.4
BLEU 99.1 99.7 99.7
METEOR 97.0 98.5 98.2 BADGER 97.9 97.6 98.2
TERp 99.7 99.7 99.4
2. Negated Action
num refs 5 10 20
CIDEr 98.5 98.5 98.5
BLEU 97.5 97.5 98.0
METEOR 96.0 96.0 97.0 BADGER 93.6 95.5 96.5
TERp 95.5 97.0 95.0
3. Antonym Replacement
num refs 5 10 20
CIDEr 86.2 92.7 93.5
BLEU 76.4 85.4 88.6
METEOR 80.9 86.6 91.5 BADGER 76.0 85.8 88.6
[image:7.595.80.506.118.196.2]TERp 75.2 79.7 80.1
Table 4: Meaning-altering corruptions. These % accuracies represent the number of times that a given metric was able to correctly score the original sentence higher than the corrupted sentence. Numbers refer-enced in the prose analysis are highlighted in bold.
4. Active-to-Passive
num refs 5 10 20
CIDEr 5.5 0.8 2.5
BLEU 7.6 4.6 3.8
METEOR 23.9 16.0 13.0 BADGER 13.4 11.3 12.2
TERp 20.6 16.4 9.7
5. Synonymous Phrases
num refs 5 10 20
CIDEr 32.1 26.2 30.0
BLEU 45.0 36.7 34.2
METEOR 62.1 62.1 62.1 BADGER 80.8 80.4 86.7
TERp 53.3 46.7 41.2
6. DT Substitution
num refs 5 10 20
CIDEr 40.0 38.5 56.9
BLEU 21.5 27.7 53.8
METEOR 55.4 55.4 70.8 BADGER 80.0 84.6 95.4
[image:7.595.81.506.254.333.2]TERp 6.2 10.8 27.7
Table 5:Meaning-preserving corruptions. These % accuracies represent the number of times that a given metric was able to correctly score the semantically-equaivalent ”corrupted” sentence within 15% of the original sentence. Numbers referenced in the prose analysis are highlighted in bold.
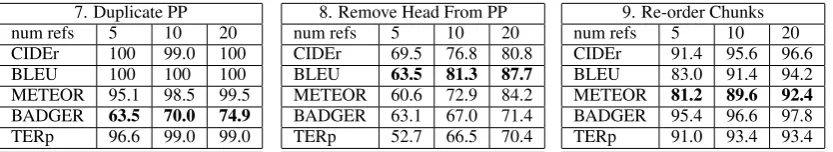
7. Duplicate PP
num refs 5 10 20
CIDEr 100 99.0 100
BLEU 100 100 100
METEOR 95.1 98.5 99.5 BADGER 63.5 70.0 74.9
TERp 96.6 99.0 99.0
8. Remove Head From PP
num refs 5 10 20
CIDEr 69.5 76.8 80.8
BLEU 63.5 81.3 87.7
METEOR 60.6 72.9 84.2 BADGER 63.1 67.0 71.4
TERp 52.7 66.5 70.4
9. Re-order Chunks
num refs 5 10 20
CIDEr 91.4 95.6 96.6
BLEU 83.0 91.4 94.2
METEOR 81.2 89.6 92.4 BADGER 95.4 96.6 97.8
TERp 91.0 93.4 93.4
Table 6:Fluency-disrupting corruptions. These % accuracies represent the number of times that a given metric was able to correctly score the original sentence higher than the corrupted sentence. Numbers refer-enced in the prose analysis are highlighted in bold.
Active-to-Passive table reflects how adding more (mostly active) references makes the system more (incorrectly) confident in choosing the active origi-nal. As the graph in Figure 5 shows, METEOR per-formed the best, likely due to its sentence alignment approach to computing scores.
7.3 Fluency disruptions
All of the metrics perform well at identifying the duplicate prepositional phrase corruption, except for BADGER which has noticeably lower accuracy
scores than the rest. These lower scores may be at-tributed to the compression algorithm that it uses to compute similarity. Because BADGER’s algorithm works by compressing the candidate and references jointly, we can see why a repeated phrase would be of little effort to encode – it is a compression algo-rithm, after all. The result of easy-to-compress re-dundancies is that the original sentence and its cor-ruption have very similar scores, and BADGER gets fooled.
[image:7.595.87.504.390.466.2]the accuracy scores of the “Remove Head from PP” corruption reach 90%, so this corruption could be seen as one that metrics could use improvement on. BLEU performed the best on this task. This is likely due to its ngram-based approach, which is able to identify that deleting a word breaks the fluency of a sentence.
All of the metrics perform well on the “Re-order Chunks” corruption. METEOR, however, does slightly worse than the other metrics. We believe this to be due to its method of generating an align-ment between the words in the candidate and refer-ence sentrefer-ences. This alignment is computed while minimizing the number of chunks of contiguous and identically ordered tokens in each sentence pair (Chen et al., 2015). Both the original sentence and the corruption contain the same chunks, so it makes sense that METEOR would have more trouble dis-tinguishing between the two than the n-gram based approaches.
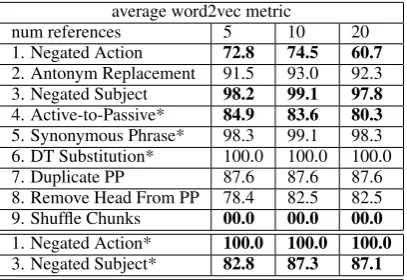
7.4 W2V-AVG
The results for the W2V-AVG metric’s success on each corruption are shown in Table 7. “Shuffled Chunks” is one of the most interesting corruptions for this metric, because it achieves an accuracy of 0% across the board. The reason for this is that W2V-AVG is a pure bag-of-words model, meaning that word order is entirely ignored, and as a result the model cannot distinguish between the original sentence and its corruption, and so it can never rank the original greater than the corruption.
Surprisingly, we find that W2V-AVG is far less fooled by active-to-passive than most other metrics. Again, we believe that this can be attributed to its bag-of-words approach, which ignores the word or-der imposed by active and passive voices. Because each version of the sentence will contain nearly all of the same tokens (with the exception of a few “is” and “being” tokens), the two sentence representa-tions are very similar. In a sense, W2V-AVG does well on passive sentences for the wrong reasons -rather than understanding that the semantics are un-changed, it simply observes that most of the words are the same. However, we still see the trend that performance goes down as the number of reference
average word2vec metric
num references 5 10 20
[image:8.595.308.512.119.259.2]1. Negated Action 72.8 74.5 60.7 2. Antonym Replacement 91.5 93.0 92.3 3. Negated Subject 98.2 99.1 97.8 4. Active-to-Passive* 84.9 83.6 80.3 5. Synonymous Phrase* 98.3 99.1 98.3 6. DT Substitution* 100.0 100.0 100.0 7. Duplicate PP 87.6 87.6 87.6 8. Remove Head From PP 78.4 82.5 82.5 9. Shuffle Chunks 00.0 00.0 00.0 1. Negated Action* 100.0 100.0 100.0 3. Negated Subject* 82.8 87.3 87.1
Table 7:Performance of the AVG-W2V metric. These % accuracies represent the number of successful trials. Numbers referenced in the prose analysis are highlighted in bold. * indicates the scores computed with the Differ-ence formula.
sentences increases.
Interestingly, we can see that although W2V-AVG achieved 98% accuracy on “Negated Subject”, it scored only 75% on “Negated Action”. This ini-tially seems quite counter intuitive - either the model should be good at the insertion of a negation word, or it should be bad. The explanation for this reveals a bias in the data itself: in every instance where the “Negated Subject” corruption was applied, the sentence was transformed from “A/The [subject] is” to “There is no [subject]”. This is differs from the change in “Negated Action”, which is simply the insertion of “not” into the sentence before an ac-tion. Because one of these corruptions resulted in 3x more word replacements, the model is able to identify it fairly well.
words play a larger role than we’d want in our toy metric. To develop a stronger metric, we might change W2V-AVG so that it considers only the con-tent words when computing the centroid embed-dings.
8 Conclusion
The main contribution of this work is a novel ap-proach for analyzing evaluation metrics for lan-guage generation tasks using Metric Unit TesTs. Not only is this evaluation procedure able to high-light particular metric weaknesses, it also demon-strates results which are far more consistent than correlation with human judgment; a good metric will be able to score well regardless of how noisy the human-derived scores are. Finally, we demonstrate the process of how this analysis can guide the devel-opment and strengthening of newly created metrics that are developed.
References
Chris Callison-Burch, Philipp Koehn, Christof Monz, Kay Peterson, Mark Przybocki, and Omar Zaidan. 2010. Findings of the 2010 joint work-shop on statistical machine translation and met-rics for machine translation. InProceedings of the Joint Fifth Workshop on Statistical Machine Translation and MetricsMATR, pages 17–53, Up-psala, Sweden, July. Association for Computa-tional Linguistics.
X. Chen, H. Fang, TY Lin, R. Vedantam, S. Gupta, P. Dollr, and C. L. Zitnick. 2015. Microsoft coco captions: Data collection and evaluation server. arXiv preprint arXiv:1504.00325.
Michael Denkowski and Alon Lavie. 2014. Meteor universal: Language specific translation evalua-tion for any target language. In Proceedings of the EACL 2014 Workshop on Statistical Machine Translation.
Chin-Yew Lin. 2004. Rouge: a package for auto-matic evaluation of summaries. pages 25–26. Matous Machacek and Ondrej Bojar. 2014.
Re-sults of the wmt14 metrics shared task. In Pro-ceedings of the Ninth Workshop on Statistical
Machine Translation, pages 293–301, Baltimore, Maryland, USA, June. Association for Computa-tional Linguistics.
Nitin Madnani, Joel Tetreault, and Martin Chodorow. 2012. Re-examining machine translation metrics for paraphrase identification. In Proceedings of the 2012 Conference of the North American Chapter of the Association for Computational Linguistics: Human Language Technologies, pages 182–190, Montr´eal, Canada, June. Association for Computational Linguistics. M. Marelli, S. Menini, M. Baroni, L. Ben-tivogli, R. Bernardi, R. Zamparelli, and Fon-dazione Bruno Kessler. 2014. A sick cure for the evaluation of compositional distributional se-mantic models.
Tomas Mikolov, Ilya Sutskever, Kai Chen, Greg Corrado, and Jeffrey Dean. 2013. Distributed representations of words and phrases and their compositionality. InIn Proceedings of NIPS. K. Papineni, S. Roukos, T. Ward, and W. Zhu. 2001.
Bleu: a method for automatic evaluation of ma-chine translation. Technical report, September. Steven Parker. 2008. Badger: A new machine
translation metric.
Matthew Snover, Bonnie Dorr, Richard Schwartz, Linnea Micciulla, and John Makhoul. 2006. A study of translation edit rate with targeted human annotation. InIn Proceedings of Association for Machine Translation in the Americas, pages 223– 231.
Matthew G. Snover, Nitin Madnani, Bonnie Dorr, and Richard Schwartz. 2009. Ter-plus: Para-phrase, semantic, and alignment enhancements to translation edit rate.
Richard Socher, Eric H. Huang, Jeffrey Penning-ton, Andrew Y. Ng, and Christopher D. Manning. 2011. Dynamic Pooling and Unfolding Recur-sive Autoencoders for Paraphrase Detection. In Advances in Neural Information Processing Sys-tems 24.