Munich Personal RePEc Archive
Impact of Financial Development,
Economic Growth and Energy
Consumption On Environmental
Degradation: Evidence from Pakistan
Raza, Syed Ali and Shah, Nida
IQRA University
2018
Impact of Financial Development, Economic Growth and Energy
Consumption On Environmental Degradation: Evidence from Pakistan
Abstract:
With the advent of globalization and industrialization, the life of human being has become
luxurious, efficient and comfortable but at the same time, the economies are facing the challenge
of environmental degradation. Environmental degradation has become the significant problem
around the world and increasing day by day. Amongst many, the key reasons of this environmental
degradation are the financial development and energy consumption. The purpose of this study is
to examine the impact of financial development, economic growth and energy consumption on
environmental degradation in Pakistan. We construct financial development index for Pakistan by
applying principle component method on the major four proxies of financial development
available in literature namely; domestic credit by banking sector, domestic credit to private sector,
stock market capitalization, and liquid liabilities. The unit root test, co-integration test, and
ordinary least square analyses have been applied on the historical data over the period of
1972-2014. The empirical evidence shows that all the variables have a significant positive effect on
environmental degradation which means an increase in any variable will increase the
environmental degradation. This study will be beneficial for the strategy makers and government
of Pakistan in the formulation of eco-friendly strategies.
Keywords:Financial Development, Economic Growth, Economic Consumption, CO2 Emission,
Introduction:
Earth is a planet which is the combination of sky, forest and green valley but are being
degraded and polluted by different activities held by humans. The vast growth has been observed
in the countries social and economic development which increases the demand for energy (i.e.,
fossil fuels) rapidly (Al-mulali; 2014; Azam & Raza, 2018). Despite of efforts made by the
economies to reduce the energy consumption, fossil fuels are one of the significant sources,
representing 80% of the energy consumption used worldwide (World Development Indicators;
2013). Thus, economic degradation is one of the challenges which all the economies are facing
(Al-mulali; 2014; Zaman et al., 2016).
The economic degradation impacts human health with different diseases like Asthma,
cancer, lung problem and others. The environmental degradation also reduces natural resources,
further impacting environmental quality which damages the country economy in terms
of cleanup landfills, restoration of green cover and endangered species protection (Hitam and
Borhan 2012). According to the inter-governmental panel on climate change (2014) the global
temperature has been increased from 1.1˚C to 6.5 ˚C because of the environmental degradation.
This change in global warming takes the attention of many researchers to take this issue seriously
(Albiman, Suleiman and Baka, 2014; Omri, 2015).
Many studies have been conducted to study the factors that cause the CO2 emission at both
micro and macro level (Al-Mulali, 2014; Raza et al., 2017). Urbanization, financial development,
energy consumption, trade is identified as the main factors that increases the CO2 emission (Sharif,
& Raza, 2016; Tamazian et al. 2009; Kasman and Duman, 2015; Omri et.al, 2015). The mix
results have been found related to the association between financial development and CO2
financial development and energy consumption (Sadorsky 2011, Shahbaz and Lean, 2012; Islam
et al, 2013; Tang and Tan, 2014). On the other hand, some studies reported that financial
development reduces the energy consumption and co2 emission (Jalil and Feridun; 2011; Shahbaz
et al; 2013)
The financial development contributes to the CO2 emission in a number of ways. Firstly,
due to financial intermediations the loans are available to the consumers in the easiest manner by
which people buy appliances, houses, refrigerators and automobiles and make their lifestyle more
convenient. They can easily buy items like air-conditioners, automobiles, etc. that emits CO2
emission (Zhang, 2011). Secondly, under financial development the financial intermediaries
increase the ways of credit channels by which people do invest more, launch new projects in a
cheap way by which less transaction cost incurs and directly increase in Carbon emission (CO2)
Sehrawat, Giri and Mohapatra, 2015). Third, financial developments also attract the FDI inflows
which increases the economic growth and result in more CO2 emission (Tamazian and Rao, 2010).
Fourth, the Industrial activities also increase due to financial development which lead to industrial
pollution (Tamazian et.al; 2009). Energy consumption and the economic growth are the cause that
increases the CO2 emission (Kivyiro and Arminen, 2014). In literature, the association between
the two variables are mostly modelled by the environmental Kuznets curve (EKC) and reported
that the association between them is unidirectional i.e., both economic growth (GDP) per capita
and energy consumption cause CO2 emission (Chandran and Tang 2013; Albiman, Suleiman
and Baka 2015). The studies on economic growth and energy consumption nexus has been done
by taking different proxies, techniques and countries (Apergis and Payne, 2009, Lin and Li, 2011,
The association between financial development, energy consumption, economic growth
and CO2 emission in spite of its importance did not receive the attention of the researchers in the
context of Pakistan. So, this study refills the gap and investigate the association between the
variables in Pakistan by using the data from 1972-2014. Pakistan economy transformed after 1990
when the government adopted the liberalization policies and steps were taken to improve the
financial sector of the economy. The banking sector of the economy has been improved drastically
in last 10 years, the total number of branches in 2004 was 6882 and increased to 11551 in 2014.
The domestic credit provided by the financial sector (% of GDP) has also improved from 36.2%
to 47.5% (World Bank indicators). Furthermore, the growth rate of Pakistan has also improved to
4.24% in 2014 to 4.03% in 2013 (Economic survey of Pakistan, 2014-2015). The increased in both
financial development and economic growth has also caused the economic derogation in the
country. According to the BP Statistical Review of World Energy report (June, 2016) the CO2
emission shows an increasing trend. In 1965, it was 20.79M, in 1975 it was 20.2M, in 1985 it was
41.8M, in 1995 it was 86.5M, in 2005 it was 135.3M, and in 2015, the CO2 emission is 179.5M.
Thus, very few studies have been conducted that examine the linkages between financial
development, economic growth and economic degradation in the context of Pakistan, this study
contributes to the literature by exploring the association between financial development, economic
growth and economic degradation by using the sample period 1972-2014.
The rest of the paper will be as follows: Section 2 explains the literature review, Section 3
shows the methodology, section 4 shows the result and conclusion and policy implications are
2. Literature Review:
2.1 Theoretical Background:
The theory based on the environment is the Environmental Kuznets Curve (EKC)
introduced by the Simon Kuznets in 1950. The theory of EKC enlightens that with the increase of
economic growth the pollution of the environment will also increase in early stages, but as the
income rises more and reaches a certain point the improvement has been seen in the environment.
Many past studies seen the correlation between the economic growth and environmental
degradation by using EKC (Kuznets curve), although the hypothesis of EKC results often mix and
debatable by many researchers and by different theories.
2.2 Empirical Studies:
In this section, we discuss the related empirical literature on energy consumption,
economic growth, financial development and environmental degradation.
Energy consumption, economic growth & CO2 Emission:
Pao & Tsai (2010) explored the association between CO2 emission, energy consumption
(EC) and economic growth (EG) in BRIC economies. The outcomes indicated that in the long run,
the bi-directional causality association exists between energyconsumption-CO2 emission and
EC-EG, whereas in the short run, both CO2 emission and EC causes economic growth unidirectionally.
Omri (2013) used the simultaneous-equations models to study the nexus among CO2 emissions,
ED and EC in MENA countries. The evidence showed the bi-directional causality between
EG-EC and EG-CO2 emissions, whereas a unidirectional causality is found between energy
consumption-co2 emissions. Vidyarthi (2014), explored the link of EG, carbon emission and EC
in five different economies the South Asian countries by taking the data from 1972-2009. The
and unidirectional causality from CO2 emission to GDP and EC is found. In the short run, EC
causes the CO2 emission. Hassan and Salim (2015) examined the correlation between GDP and
CO2 emission in Organization for Economic Cooperation and Development (OECD) economies
by using the sample size 1980-1990. The result indicated that CO2 emission upsurges with the
economic development but after reaching a certain level, it starts to decline and also reported that
in all OECD countries the Kuznets curve shaped is U-Inverted.
Ang (2007) studies the causal association between EC, GDP and CO2 emission in France.
The data comprised of the years 1960-2000 and reported that all the variables are co-integrated.
Moreover, in the long run, a bidirectional causality is found between GDP- EC, GDP-CO2
emission, whereas, in the short run, a unidirectional causality from EC-GDP is found. Halkos and
Tzeremes (2011) used the regression technique to examine the association between the CO2
emission and EG in China by using the yearly data from 1960-2006. The empirical result showed
the invert u-shaped curve between the CO2 and GDP (gross domestic product). Hussain et.al
(2012), find out the association between EC, EG and environmental pollution in Pakistan by
utilizing the Granger causality test on the dataset 1971-2006. The result indicated that
bi-directional causality exists between the variables.
Mugableh (2013), studied the CO2 emission, EG and EC, association in Malaysia by using
annual data from 1971-2012. The empirical results showed that the gross domestic product (GDP)
and EC are positively associated with CO2 emission in the long and short run both. Albiman,
Suleiman and Baka (2015), examined the correlation between EG, CO2 emission and EC in
Tanzania by using the data from 1975-2013. The findings revealed that EG and EC cause the CO2
emission. Ahmed and Long (2013) investigated the economic growth, environmental degradation
hypothesis and ARDL technique The findings of the study showed that in the short run the relation
between variables does not support the EKC hypothesis but in the long run the EKC hypothesis
shows the inverted U-shaped between the variables. Ahmed et.al (2016) used the VECM technique
to examine the association between CO2 emissions, EG and EC in India and reported that all the
variables are co-integrated in the long run.
Cialani (2007) explored the correlation between the economic growth and CO2 emission
in Italy by using yearly data from 1990-2002. The result showed a negative relationship is found
between economic growth and CO2 emission. Vidyarthi (2013) applied the Vector error causality
and co-integration technique and reported that energy consumption insignificantly impact the
Carbon emission whereas, economic growth have the positive impact on energy consumption, and
similarly carbon emission significantly affect the economic growth in India.
Financial development (FD) & CO2 Emission:
Sadorsky (2011) studied the role of financial development (FD) in promoting co2 emission
in 9 Central and Eastern European frontier countries and reported that the significant positive
association exists between the two variables. Tamazian and Rao (2010) used the data of 24
transition counties from 1993-2004 to reexamine the role of financial development in increasing
CO2 emission. They reported that financial development exert high impact on co2 emission.
Al-mulali and Sab (2012) investigated the link between the EG, EC, FD, and CO2 emission in thirty
Sub-Saharan African Countries. The data comprised of the years 1980-2008. They concluded that
energy consumption increases the FD and economic growth, but at the same time also increases
the co2 emission. Nasreen and Anwar (2015), enquired the effect of FD, EG and EC on
environmental degradation in low income, high income and middle income economies. The data
reduce the CO2, however, in low and middle income the situation become vice versa. Moreover,
the Granger causality test showed that bi-directional causality is found between financial
development and CO2 in high income countries, whereas, in low and middle income the causality
between the variables are unidirectional.
Zhang (2011) examined the impact of FD on CO2 emissions in China and reported that FD
found an important driver that increases the CO2 emission. Sehrawati, Giri and Mohapatra (2012)
explored the effect of EG, EC and FD on environmental degradation in India by using the yearly
data from 1971-2011. They used the ARDL technique and reported that all the variables are
co-integrated in the long run, and environmental degradation upsurges with the increase in any
variable. Islam et.al (2013) applied the VECM to examine the association between EC, financial
development and EG in Malaysia. The empirical evidence indicated that financial development
and EG influenced the energy consumption. Shahbaz et.al (2013) employed the ARDL bounds
testing approach to study the link between EG, CO2 emissions, FD and EC in Indonesia. They
reported that EC and EG enhances the CO2 emission whereas as FD minimize the CO2 emission.
Tang & Tan (2014) investigated the link between CO2 emission and FD in Malaysia by using the
data from 1972-2009. They reported that significant positive relationship exists between the
variables. Farhani & Ozturk (2015) applied the ARDL and ECM on the dataset of Tunisia to
explore the role of FD in increasing CO2 emissions. The result indicated that FD increases the
emission.
Tamazian, Chousa & Vadlamannati (2009) study the FD and economic degradation
association in BRIC countries. The result indicated that financial development reduces the CO2
emission. Jalil & Feridun (2011) used the ARDL approach to study the association among financial
between the variables. Ozturk and Acaravci (2013) tested the association between FD, CO2
emission and EG. They reported that financial development insignificantly effect the CO2
emission in Turkey.
3. Methodology:
In this study, we used the data from 1972 to 2014 of Pakistan. The data of environmental
degradation, economic growth, trade openness and urbanization has been taken from World Bank.
The stock capitalization data are taken from Handbook of Statistics the economic survey of
Pakistan, banking sector proxies’ data has been taken by the Global Financial development. We
construct financial development index for Pakistan by applying principle component method on
the major four proxies of financial development available in literature namely; domestic credit by
banking sector, domestic credit to private sector, stock market capitalization, and liquid liabilities.
After examining the empirical studies, the model to analyze the association between economic
growth, financial development, and energy consumption on environmental degradation in Pakistan
is determined by following function:
In the above model CO2 means Carbon Dioxide emission, FDI is the Financial
Development Index, EC is the Energy Consumption, EG is the Economic Growth, TO means the
trade openness and URB is the urbanization. The detailed description of all variables is presented
in table-1.
-Insert table 1-
Construction of Financial development:
t i t t
t t
t
t FDI EC EG TO URB
According to past literature, the effect of financial development in any economy can be
analyzed by using two methods. In the first method, the different proxies from the financial sector
can be taken to understand the characteristics and future performance of financial development on
the economy. This method is adopted in numerous studies (Hye, 2011; Ang & McKibbin, 2007).
In the second method, the financial index is constructed by using the principal component (PC),
this is also used in some studies (Islam et.al, 2013). In this study, we have applied both methods
(i) Proxies of financial development (five different proxies present in the literature) (ii) principal
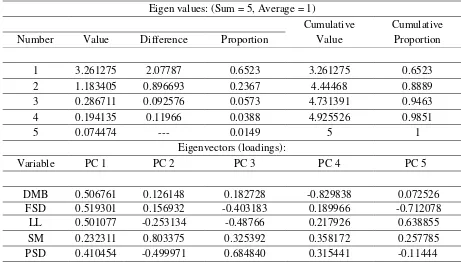
component (PC) to develop the financial index. The principal component method is a multivariate
technique in which many quantitative variables are used. This technique is widely used in the area
of environmental studies or in globalization. The PC is arranged in descending order of the
Eigenvalues, which are equivalent to the variance of the components. The vector of Eigen can take
only at unit length. The first component has the major assortment of unit length linear mixture of
the formative variables.
-Insert table 2-
As seen from table 2, the initial principal component (PC) explains about 65.2, the next
principal component (PC) clarifies 23.6%, the third shows 5.3%, similarly, the fourth one explains
3.8% and the last one explain about 1.49% of the standardized variance. Therefore, we pick the
opening PC to work out financial development index. The primary PC is a linear mixture of the
five standard measures whose weights decided by the initial eigenvector. After rescaling, the entity
contributions of each series DMB, FSD, LL, SM and PSD of the PC1 the variance of standardized
are established to 50.6%, 51.9%, 50.1%, 23.2% and 41% respectively. This study deploys these
The statistical approaches used in this study are unit root tests, co-integration test and
regression examine the relationship between the variables.
Unit Root Analysis
The Augmented dickey fuller (ADF) unit root test has been used to analyze the stationary
properties of the variables. The Dickey and Fuller (1979) test is employed to observe whether the
approximations are equal to zero or not. This test provides the combined distribution of ADF
statistics. If the prob value of the variables are less than the 0.1 at first difference this means that
the variable is stationary and the unit root problem does not exist (Raza, 2015; Raza et al., 2016).
Cointegration Analysis
The present study also employs Johansen and Juselius (1990) co-integration technique to
analyze the long run correlation among variables. The null hypothesis for J.J cointegration is no
long run correlation exist among the variables. If the (λtrace and λmax) value is greater than the
critical value, then the null hypothesis is rejected, which means that the alternative hypothesis is
accepted, i.e., the existence of the long run relationship among the series of variables.
Moreover, the long run estimations among the variables is analyze through ordinary least
square regression analysis.
4. Results and Estimations
The ADF unit root test is employed to see the stationary properties of the variables.
Table-3 shows the results of unit root test results. As seen from the table the unit root null hypothesis is
accepted and at 1st difference all the variables are stationary as the prob value is less than 0.1.
-Insert table 3-
By using Johansen and Juselius (1990) Co-integration method we evaluate the long run
4. As seen from the table both Eigen and trace values are higher than the critical values calculated
which shows the rejection of null hypothesis and the acceptance of alternative hypothesis i.e, long
run relationship is found between the two variables.
-Insert table 4-
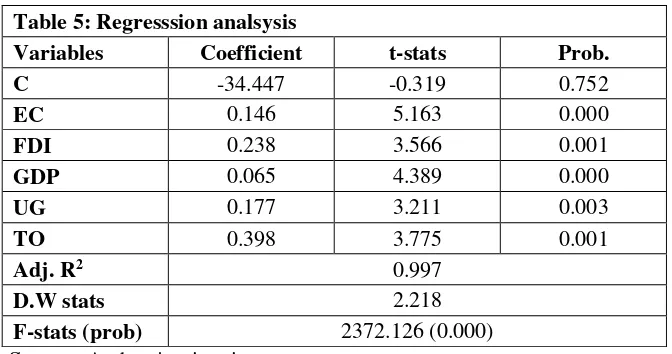
Results of long run estimations based on regression analysis are presented in table-4. The
result indicate that energy consumption has a significant positive effect on CO2 emission. The
results in line with the studies of Halicioglu (2009); Arouri et al. (2012). The result suggests that
Pakistan is highly dependent on energy consumption and it uses a large amount of energy in order
to earn the economic growth. About 55% of energy consumption in Pakistan are reliant on gas and
oil out of total primary energy that contributes the higher CO2 emission.
The Financial development index (FDI) also shows a significant positive relationship with
CO2 emission. The result are consistent with the studies of Ozturk and Acaravcı, (2012); Islam et
al. (2013). The Financial development index tends to be a new contributor towards the CO2
emission in Pakistan for the following reasons. Firstly, the development of stock market provides
lower financing costs, dispersion of operating risks, increase financial channels, and optimize the
structure of asset this helps out the investors in establishing new ventures and emit more CO2
emission. Secondly, well-organized financial intermediation and affluent seem favorable to
consumers' loan activities, which gives the advantage to consumers to buy the big tickets like
houses, air condition, automobiles, refrigerator and other big machines and contributes more
carbon in the economy.
The economic growth also shows a significant effect on CO2 emission. This implies that
as economic growth rise environment pollution will also rise. The findings are consistent with the
change in economy has been seen from 1970’s due to the industrialization which leads to higher
CO2 emission. Moreover, 60% production of total production is only dependent on cement
production that contributes higher CO2 emission in the economy.
The positive association is also found between urbanization and CO2 emission. The result
are in accordance with the studies of Zhang & Lin (2012); Al-mulali et.al (2013). This result
implies that as the urbanization increases the CO2 emission also increases. As urbanization does
not involve the transformation of the agricultural sector to non-agricultural sector, it also includes
the process of migration from rural areas. According to the World Bank statistics, the urbanization
in Pakistan is showing the upward trend and in 2015 the 39% of the total population has become
urbanized. This increased in residents’ increases the demand for energy products which results in
C02 emission. Moreover, the urbanization also demands the development of megalopolises,
advancement in infrastructures such as road networks and electricity networks which ultimately
increases the C02 emission.
The trade openness has a significant positive effect on CO2 emission in Pakistan. The
results are in accordance with the studies of Ozturk and Acaravci (2013); Jalil and Feridun (2011).
The reason behind this positive association is, the economy since 1980’s take place significant
trade liberalization in the account, in which they reduced the import taxes, tariffs and modified
their trade policies. Moreover, the high imports of vehicles and electronic items also lead to
increase the pollution in Pakistan.
5. Conclusion & Recommendations:
The climate change in the developing world, more specifically in Asian countries is
observed due to massive industrialization and population, so, the economic degradation becomes
economies that are producing more carbon and according to the World Bank, it is contributing
about 7 to 8 percent carbon dioxide yearly in Global warming. The trend is continually moving
upward due to high investment in industries, an increase in population size and most importantly,
Pakistan is highly dependent on energy consumption, i.e., approximately 60 percent consumption
of gas and oil. In order to mitigate this sensitive issue, this research is conducted to analyze the
role of financial development, energy consumption, economic growth, on environmental
degradation in Pakistan by using the data from 1972-2014. We applied the stationary analysis,
co-integration and regression analysis to examine the association between the energy consumption,
financial development, economic growth and environmental degradation. The empirical evidence
showed that all the variables have a significant positive effect on environmental degradation which
means an increase in any variable will increase the environmental degradation.
On the basis of the results, it is recommended to the industries to acquire advanced
technologies as this will reduce the energy used and economic degradation. Moreover, the
government should switch to renewable energy resources such as wind or solar on an urgent
basis as this also minimize the C02 emission. The government of Pakistan should implement
environmental policies that convince industries to boost their investment in cleaner technology
and improve their energy-related R&D (Research and Development).
The financial development also has a significant effect on CO2 emission, so the economy
should transform the industry structure. The efforts should also be made to reduce
the industry's energy consumption by evolving high technology and modern service industries.
Moreover, the increase in income also increases the CO2 emission so the awareness should be
The government should also developed energy efficient policies as it will minimize the
CO2 emissions. The proper implementation of property rights and environment related laws should
be implemented and revisited to mitigate the environmental degradation problem. If any violation
is found strict action should be taken. To control the urbanization problem the government should
also start developing the rural areas, and in urban areas the green belts should be planted. The co2
emission should be controlled by banning the deforestation. Furthermore, the policy makers should
encourage green technologies and environmental friendly energies to promote economic growth
and reduce CO2 emission.
This study also has some limitations. The industrial growth is ignored, which is one of the
prime sources of CO2 emission in Pakistan. So the same research can be conducted by adding the
role of industries. This study focuses on yearly data so future research can be conducted by using
the monthly and yearly data. New proxy of financial development can be explored and used in
future studies. Moreover, the sector based studies should also be done by the researchers to identify
References:
Ahmad, A., Zhao, Y., Shahbaz, M., Bano, S., Zhang, Z., Wang, S., & Liu, Y. (2016). Carbon
emissions, energy consumption and economic growth: An aggregate and disaggregate
analysis of the Indian economy. Energy Policy,96, 131-143.
Ahmed, K., & Long, W. (2013). An empirical analysis of CO2 emission in Pakistan using EKC
hypothesis. Journal of International Trade Law and Policy, 12(2), 188-200.
Albiman, M. M., Suleiman, N. N., & Baka, H. O. (2015). The relationship between energy
consumption, CO2 emissions and economic growth in Tanzania. International Journal of Energy Sector Management, 9(3), 361-375.
Al-Mulali, U. (2014). Investigating the impact of nuclear energy consumption on GDP growth and
CO 2 emission: a panel data analysis. Progress in Nuclear Energy, 73, 172-178.
Al-Mulali, U., & Sab, C. N. B. C. (2012). The impact of energy consumption and CO 2 emission
on the economic growth and financial development in the Sub Saharan African
countries. Energy, 39(1), 180-186.
Al-mulali, U., Fereidouni, H. G., Lee, J. Y., & Sab, C. N. B. C. (2013). Exploring the relationship
between urbanization, energy consumption, and CO 2 emission in MENA
countries. Renewable and Sustainable Energy Reviews, 23, 107-112.
Ang, J. B. (2007). CO 2 emissions, energy consumption, and output in France. Energy Policy, 35(10), 4772-4778.
Ang, J. B., & McKibbin, W. J. (2007). Financial liberalization, financial sector development and
growth: evidence from Malaysia. Journal of development economics, 84(1), 215-233. Apergis, N., & Payne, J. E. (2009). CO 2 emissions, energy usage, and output in Central
Arouri, M. E. H., Youssef, A. B., M'henni, H., & Rault, C. (2012). Energy consumption, economic
growth and CO 2 emissions in Middle East and North African countries. Energy Policy, 45,
342-349.
Azam, M., & Raza, S. A. (2018). Financial sector development and income inequality in
ASEAN-5 countries: does financial Kuznets curve exists?. Global Business and Economics
Review, 20(1), 88-114.
Chandran, V. G. R., & Tang, C. F. (2013). The impacts of transport energy consumption, foreign
direct investment and income on CO 2 emissions in ASEAN-5 economies. Renewable and Sustainable Energy Reviews, 24, 445-453.
Chen, C. Y., Yeh, K. L., Aisyah, R., Lee, D. J., & Chang, J. S. (2011). Cultivation, photobioreactor
design and harvesting of microalgae for biodiesel production: a critical
review. Bioresource technology, 102(1), 71-81.
Cialani, C. (2007). Economic growth and environmental quality: an econometric and a
decomposition analysis. Management of Environmental Quality: An International
Journal, 18(5), 568-577.
Dickey, D. A., & Fuller, W. A. (1979). Distribution of the estimators for autoregressive time series
with a unit root. Journal of the American statistical association, 74(366a), 427–431.
Farhani, S., & Ozturk, I. (2015). Causal relationship between CO2 emissions, real GDP, energy
consumption, financial development, trade openness, and urbanization in
Tunisia. Environmental Science and Pollution Research, 22(20), 15663-15676.
Halicioglu, F. (2009). An econometric study of CO 2 emissions, energy consumption, income and
Halkos, G. E., & Tzeremes, N. G. (2011). Growth and environmental pollution: empirical evidence
from China. Journal of Chinese Economic and Foreign Trade Studies, 4(3), 144-157.
Hassan, K., & Salim, R. (2015). Population ageing, income growth and CO2 emission: Empirical
evidence from high income OECD countries. Journal of Economic Studies, 42(1), 54-67. Hitam, M. B., & Borhan, H. B. (2012). FDI, growth and the environment: impact on quality of life
in Malaysia. Procedia-Social and Behavioral Sciences, 50, 333-342. http://data.worldbank.org/country/pakistan
http://databank.worldbank.org/data/download/WDI-2013-ebook.pdf
http://ipcc-wg2.gov/AR5/report/
http://www.bp.com/content/dam/bp/pdf/energy-economics/statistical-review-2016/bp-statistical-review-of-world-energy-2016-full-report.pdf
http://www.finance.gov.pk/survey/chapters_15/01_Growth.pdf
Hussain, M., Irfan Javaid, M., & Drake, P. R. (2012). An econometric study of carbon dioxide
(CO2) emissions, energy consumption, and economic growth of Pakistan. International
Journal of Energy Sector Management,6(4), 518-533.
Islam, F., Shahbaz, M., Ahmed, A. U., & Alam, M. M. (2013). Financial development and energy
consumption nexus in Malaysia: a multivariate time series analysis. Economic
Modelling, 30, 435-441.
Jalil, A., & Feridun, M. (2011). The impact of growth, energy and financial development on the
environment in China: A cointegration analysis. Energy Economics, 33(2), 284-291. Johansen, S., & Juselius, K. (1990). Maximum likelihood estimation and inference on coin-
tegration with applications to the demand for money. Oxford Bulletin of Economics and
Kasman, A., & Duman, Y. S. (2015). CO2 emissions, economic growth, energy consumption,
trade and urbanization in new EU member and candidate countries: a panel data
analysis. Economic Modelling, 44, 97-103.
Kivyiro, P., & Arminen, H. (2014). Carbon dioxide emissions, energy consumption, economic
growth, and foreign direct investment: Causality analysis for Sub-Saharan
Africa. Energy, 74, 595-606.
Lin, B., & Li, X. (2011). The effect of carbon tax on per capita CO 2 emissions. Energy
policy, 39(9), 5137-5146.
Mugableh, M. I. (2013). Analysing the CO 2 emissions function in Malaysia: autoregressive
distributed lag approach. Procedia Economics and Finance,5, 571-580.
Muhammad Adnan Hye, Q. (2011). Financial development index and economic growth: empirical
evidence from India. The Journal of Risk Finance, 12(2), 98-111.
Nasreen, S., & Anwar, S. (2015). The impact of economic and financial development on
environmental degradation: An empirical assessment of EKC hypothesis. Studies in
Economics and Finance, 32(4), 485-502.
Omri, A. (2013). CO 2 emissions, energy consumption and economic growth nexus in MENA
countries: evidence from simultaneous equations models.Energy economics, 40, 657-664.
Omri, A. (2014). An international literature survey on energy-economic growth nexus: Evidence
from country-specific studies. Renewable and Sustainable Energy Reviews, 38, 951-959.
Omri, A., Mabrouk, N. B., & Sassi-Tmar, A. (2015). Modeling the causal linkages between nuclear
energy, renewable energy and economic growth in developed and developing
Ozturk, I., & Acaravci, A. (2013). The long-run and causal analysis of energy, growth, openness
and financial development on carbon emissions in Turkey. Energy Economics, 36,
262-267.
Pao, H. T., & Tsai, C. M. (2010). CO 2 emissions, energy consumption and economic growth in
BRIC countries. Energy Policy, 38(12), 7850-7860.
Raza, S. A. (2015). Foreign direct investment, workers’ remittances and private saving in Pakistan:
an ARDL bound testing approach. Journal of Business Economics and Management, 16(6),
1216-1234.
Raza, S. A., Shahbaz, M., & Nguyen, D. K. (2015). Energy conservation policies, growth and trade
performance: Evidence of feedback hypothesis in Pakistan. Energy Policy, 80, 1-10.
Raza, S. A., Shahbaz, M., & Paramati, S. R. (2016). Dynamics of Military Expenditure and income
Inequality in Pakistan. Social Indicators research, 1-21. DOI 10.1007/s11205-016-1284-7.
Raza, S. A., Sharif, A., Wong, W. K., & Karim, M. Z. A. (2017). Tourism development and environmental
degradation in the United States: evidence from wavelet-based analysis. Current Issues in
Tourism, 20(16), 1768-1790.
Sadorsky, P. (2011). Financial development and energy consumption in Central and Eastern
European frontier economies. Energy Policy, 39(2), 999-1006.
Saidi, K., & Hammami, S. (2015). The impact of CO 2 emissions and economic growth on energy
consumption in 58 countries. Energy Reports, 1, 62-70.
Sehrawat, M., Giri, A. K., & Mohapatra, G. (2015). The impact of financial development,
economic growth and energy consumption on environmental degradation: Evidence from
India. Management of Environmental Quality: An International Journal, 26(5), 666-682. Shahbaz, M., & Lean, H. H. (2012). The dynamics of electricity consumption and economic
Shahbaz, M., Hye, Q. M. A., Tiwari, A. K., & Leitão, N. C. (2013). Economic growth, energy
consumption, financial development, international trade and CO 2 emissions in
Indonesia. Renewable and Sustainable Energy Reviews,25, 109-121.
Sharif, A., & Raza, S. A. (2016). Dynamic relationship between urbanization, energy consumption
and environmental degradation in Pakistan: Evidence from structure break testing. Journal
of Management Sciences, 3(1), 1-21.
Tamazian, A., & Rao, B. B. (2010). Do economic, financial and institutional developments matter
for environmental degradation? Evidence from transitional economies. Energy Economics, 32(1), 137-145.
Tamazian, A., Chousa, J. P., & Vadlamannati, K. C. (2009). Does higher economic and financial
development lead to environmental degradation: evidence from BRIC countries. Energy policy, 37(1), 246-253.
Tamazian, A., Chousa, J. P., & Vadlamannati, K. C. (2009). Does higher economic and financial
development lead to environmental degradation: evidence from BRIC countries. Energy
policy, 37(1), 246-253.
Tang, C. F., & Tan, B. W. (2014). The linkages among energy consumption, economic growth,
relative price, foreign direct investment, and financial development in Malaysia. Quality
& Quantity, 48(2), 781-797.
Vidyarthi, H. (2013). Energy consumption, carbon emissions and economic growth in India. World
Journal of Science, Technology and Sustainable Development, 10(4), 278-287.
Vidyarthi, H. (2014). An econometric study of energy consumption, carbon emissions and
economic growth in South Asia: 1972-2009. World Journal of Science, Technology and
Zaman, K., Shahbaz, M., Loganathan, N., & Raza, S. A. (2016). Tourism development, energy
consumption and Environmental Kuznets Curve: Trivariate analysis in the panel of
developed and developing countries. Tourism Management, 54, 275-283.
Zhang, C., & Lin, Y. (2012). Panel estimation for urbanization, energy consumption and CO 2
emissions: a regional analysis in China. Energy Policy, 49, 488-498.
Zhang, Y. J. (2011). The impact of financial development on carbon emissions: An empirical
Table-1: Variable Definitions
Variable Full Form Measure Definitions
CO2
Carbon dioxide emission
per capita metric tons Carbon dioxide emissions are those that stems from the burning of fossil fuels and the manufacturing of cement. It also includes the carbon dioxide which is produced during the consumption of solid, liquid, and gas fuels and gas flaring.
FDI
Financial development Index
different proxies of
capital sector This index measures and evaluates the factors which enables the development of financial systems in the economy.
EC Energy
consumption
oil equivalent kg per capita
It refers to the use of primary energy before alteration to other end-use fuels. It is equal to indigenous production plus imports and stock changes, minus exports and fuels supplied to ships and aircraft engaged in international transport.
EG Economic
growth
Gross domestic product (2000 constant US dollar
Economic growth refers to the quantitative change or expansion in a country's economy. In other words, it is the general rise in living standard of residents of a country.
TO
Trade openness
Percentage of imports and exports
Openness to trade is the value of merchandise trade (exports plus imports) as a percent of gross domestic product
URB Urbanization total population percentage
Urbanization is the migration of population from rural or remote areas to more developed or urban areas
Note: All the variables definition are taken from the source of World bank except for financial development.
Table 2
Principal Components Analysis
Eigen values: (Sum = 5, Average = 1)
Cumulative Cumulative
Number Value Difference Proportion Value Proportion
1 3.261275 2.07787 0.6523 3.261275 0.6523 2 1.183405 0.896693 0.2367 4.44468 0.8889 3 0.286711 0.092576 0.0573 4.731391 0.9463 4 0.194135 0.11966 0.0388 4.925526 0.9851
5 0.074474 --- 0.0149 5 1
Eigenvectors (loadings):
Variable PC 1 PC 2 PC 3 PC 4 PC 5
DMB 0.506761 0.126148 0.182728 -0.829838 0.072526 FSD 0.519301 0.156932 -0.403183 0.189966 -0.712078
LL 0.501077 -0.253134 -0.48766 0.217926 0.638855 SM 0.232311 0.803375 0.325392 0.358172 0.257785 PSD 0.410454 -0.499971 0.684840 0.315441 -0.11444
Source: Authors' estimations.
Table-3: Stationary Test Result
Variables ADF test statistics
I(0) I(1)
C C &T C C&T
CO2 -0.7134 (0.8323) -2.0252 (0.5710) -7.2130 (0.0000) -7.2130 (0.0000)
EC -0.3960 (0.2810) -2.6220 (0.7532) -6.2240 (0.0000) -6.1460 (0.0010)
FDI -2.0100 (0.9100) -2.1670 (0.2730) -4.8750 (0.0000) -4.9120 (0.0000)
GDP 0.2570 (0.9730) -2.9800 (0.1490) -4.1212 (0.0024) -4.1060 (0.0120)
TO 4.0044 (1.0000) 0.9768 (0.9998) -4.7245 (0.0004) -6.4187 (0.0000)
UG 1.4591 (0.5439) -1.2712 (0.8811) -3.6973 (0.0078) -4.5752 (0.0446)
Source: Authors' estimations.
[image:25.612.97.522.402.694.2]Source: Authors' estimations.
Table-4: Co integration Test Results
Null Hypothesis No.
of CS(s)
Trace Statistics
5% critical
values
Prob. Value
Max. Eigen Value Statistics
5% critical
values
Prob. Value
None * 142.0789 107.3466 0.0000 73.3716 43.4198 0.0000 At most 1 * 68.7073 79.3415 0.2411 33.6499 37.1636 0.1201 At most 2 35.0574 55.2458 0.7608 15.6954 30.8151 0.8655 At most 3 19.3620 35.0109 0.7463 11.1881 24.2520 0.8279 At most 4 8.1739 18.3977 0.6651 8.1216 17.1477 0.5896
Table 5: Regresssion analsysis
Variables Coefficient t-stats Prob.
C -34.447 -0.319 0.752
EC 0.146 5.163 0.000
FDI 0.238 3.566 0.001
GDP 0.065 4.389 0.000
UG 0.177 3.211 0.003
TO 0.398 3.775 0.001
Adj. R2 0.997
D.W stats 2.218
[image:26.612.162.498.265.442.2]