Towards a Dialogue System that Supports Rich Visualizations of Data
Abhinav Kumar and Jillian Aurisano and Barbara Di Eugenio and Andrew Johnson University of Illinois at Chicago
Chicago, IL USA
{akumar34,jauris2,bdieugen,ajohnson}@uic.edu Alberto Gonzalez and Jason Leigh
University of Hawai’i at Manoa Honolulu, HI USA {agon,leighj}@hawaii.edu
Abstract
The goal of our research is to support full-fledged dialogue between a user and a sys-tem that transforms the user queries into visualizations. So far, we have collected a corpus where users explore data via vi-sualizations; we have annotated the corpus for user intentions; and we have developed the core NL-to-visualization pipeline.
1 Introduction
Visualization, even in its simplest forms, remains a highly effective means for converting large vol-umes of raw data into insight. Still, even with the aid of robust visualization software, e.g. Tableau1
and ManyEyes (Viegas et al., 2007), especially novices face challenges when attempting to trans-late their questions into appropriate visual encod-ings (Heer et al., 2008; Grammel et al., 2010). Ideally, users would like to tell the computer what they want to see, and have the system intelligently create the visualization. However, existing sys-tems (Cox et al., 2001; Sun et al., 2013; Gao et al., 2015) do not offer two-way communication, or only support limited types of queries, or are not grounded in how users explore data.
Our goal is to develop Articulate 2, a full-fledged conversational interface that will automat-ically generate visualizations. The contributions of our work so far are: a new corpus unique in its genre;2 and a prototype system, which is able
to process a sequence of requests, create the cor-responding visualizations, position them on the screen, and manage them.
1http://www.tableau.com/
2The corpus will be released at the end of the project.
2 Related Work
Much work has focused on the automatic gen-eration of visual representations, but not via NL (Feiner, 1985; Roth et al., 1994; Mackinlay et al., 2007). Likewise, much work is devoted to multi-modal interaction with visual representations (e.g. (Walker et al., 2004; Meena et al., 2014)), but not to automatically generating those visual repre-sentations. Systems like AutoBrief (Green et al., 2004) focus on producing graphics accompanied by text; or on finding the appropriate graphics to accompany existing text (Li et al., 2013).
(Cox et al., 2001; Reithinger et al., 2005) were among the first to integrate a dialogue interface into an existing information visualization system, but they support only a small range of questions. Our own Articulate (Sun et al., 2013) maps NL queries to statistical visualizations by using very simple NLP methods. When DataTone (Gao et al., 2015), the closest to our work, cannot resolve an ambiguity in an NL query, it presents the user with selection widgets to solve it. However, only one visualization is presented to the user at a given time, and previous context is lost. (Gao et al., 2015) compares DataTone to IBM Watson Ana-lytics,3 that allows users to interact with data via
structured language queries, but does not support dialogic interaction either.
3 A new corpus
15 subjects, 8 male and 7 female, interacted with a remote Data Analysis Expert (DAE) who assists the subject in an exploratory data analysis task: analyze crime data from 2010-2014 to provide suggestions as to how to deploy police officers in four neighborhoods in Chicago. Each session con-sisted of multiple cycles of visualization
construc-3http://www.ibm.com/analytics/watson-analytics/
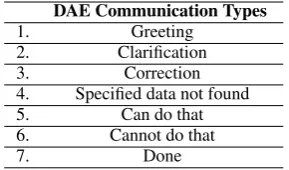
DAE Communication Types
1. Greeting
2. Clarification
3. Correction
4. Specified data not found 5. Can do that 6. Cannot do that
[image:2.595.109.254.62.147.2]7. Done
Table 1: DAE Communication Types
tion, interaction and interpretation, and lasted be-tween 45 and 90 minutes.
Subjects were instructed to ask spoken ques-tions directly to the DAE (they knew the DAE was human, but couldn’t make direct contact4).
[image:2.595.73.291.331.430.2]Users viewed visualizations and limited commu-nications from the DAE on a large, tiled-display wall. This environment allowed analysis across many different types of visualizations (heat maps, charts, line graphs) at once (see Figure 1).
Figure 1: A subject examining crime data.
The DAE viewed the subject through two high-resolution, direct video feeds, and also had a mir-rored copy of the tiled-display wall on two 4K dis-plays. The DAE generated responses to questions using Tableau, and used SAGE2 (Marrinan et al., 2014), a collaborative large-display middlewear, to drive the display wall. The DAE could also communicate via a chat window, but confined her-self to messages of the types specified in Table 1. Apart from greetings, and status messages (sorry, it’s taking long) the DAE would occasionally ask for clarifications, e.g.Did you ask for thefts or bat-teries. Namely, the DAE never responded with a message, if the query could be directly visualized; neither did the DAE engage in multi-turn elicita-tions of the user requirements. Basically, the DAE tried to behave like a system with limited dialogue capabilities would.
Table 2 shows summary statistics for our data, that was transcribed in its entirety. So far, we
4In a strict Wizard-of-Oz experiment, the subjects would
not have been aware that the DAE is human.
Words Utterances Directly Actionable Utts.
38,105 3,179 490
Table 2: Corpus size
have focused on the type of requests subjects pose. Since no appropriate coding scheme exists, we de-veloped our own. Three coders identified the directly actionable utterances, namely, those ut-terances5 which directly affect what the DAE is
doing. This was achieved by leaving an utter-ance unlabelled or labeling it with one of 10 codes (κ = 0.84(Cohen, 1960) on labeling an utterance or leaving it unlabeled;κ= 0.74on the 10 codes). The ten codes derive from six different types of actionable utterances, which are further differenti-ated depending on the type of their argument. The six high-level labels are: requests to create new vi-sualizations (8%, e.g.Can I see number of crimes by day of the week?), modifications to existing vi-sualizations (45%, Umm, yeah, I want to take a look closer to the metro right here, umm, a little bit eastward of Greektown); window management in-structions (12.5%,If you want you can close these graphs as I won’t be needing it anymore); fact-based questions, whose answer doesn’t necessar-ily require a visualization (7%,During what time is the crime rate maximum, during the day or the night?); requests for clarification (20.5%,Okay, so is this statistics from all 5 years? Or is this for a particular year?); expressing preferences (7%,
The first graph is a better way to visualize rather than these four separately).
Three main themes have emerged from the anal-ysis of the data. 1) Directly actionable requests cover only about 15% of what the subject is say-ing; the remaining 85% provides context that in-forms the requests (see Section 6). 2) Even the directly actionable 15% cannot be directly mapped to visualization specifications, but intermediate representations are needed. 3) An orthogonal di-mension is to manage the visualizations that are generated and positioned on the screen.
So far, we have made progress on issues 2) and 3). The NL-to-visualization pipeline we de-scribe next integrates state-of-the-art components to build a novel conversational interface. At the moment, the dialogue initiative is squarely with the user, since the system only executes the re-quests. However, strong foundations are in place
for it to become a full conversational system.
4 The NL-to-visualization pipeline
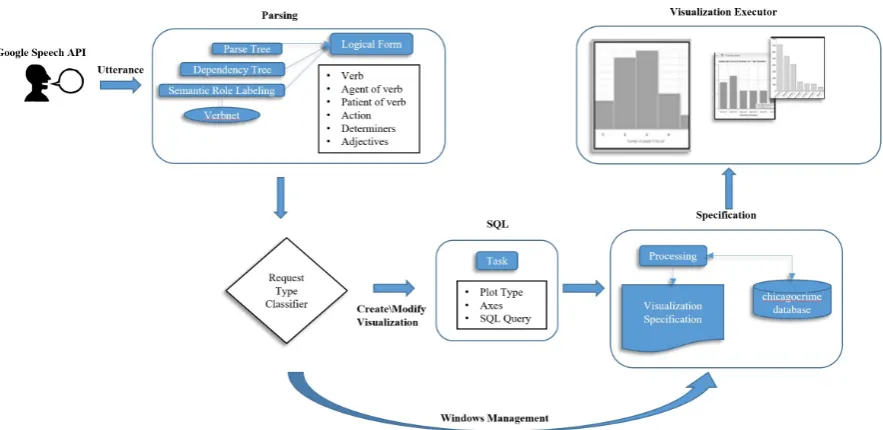
The pipeline in Figure 2 illustrates how Articu-late 2 processes a spoken utterance, first by trans-lating it into a logical form and then into a visu-alization specification to be processed by the Vi-sualization Executor (VE). For create/modify vi-sualization requests, an intermediate SQL query is also generated.
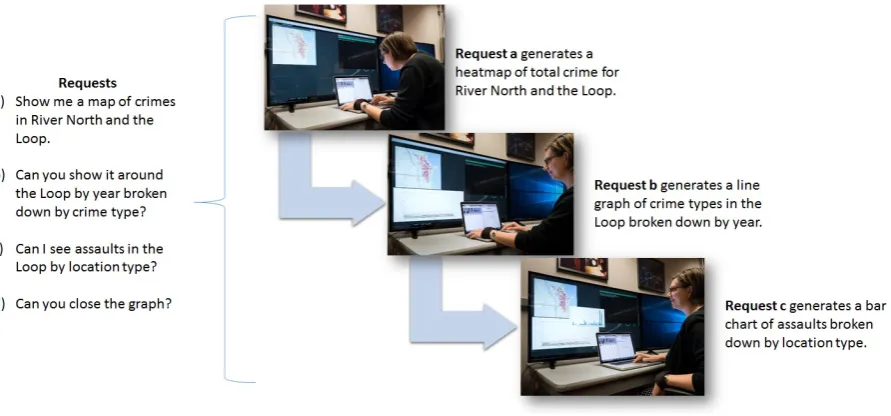
Before providing more details on the pipeline, Figure 3 presents one example comprising a se-quence of four requests, which results in three vi-sualizations. The user speaks the utterances to the system by using the Google Speech API. The first utterance asks for a heatmap of the ”River North” and ”Loop” neighborhoods (two downtown areas in Chicago). The system generates the visual-ization in the upper-left corner of the figure. In response to utterance b, Articulate 2 generates a new visualization, which is added to the first vi-sualization (see bottom of screen in the middle); it is a line graph because the utterance requests the aggregate temporal attribute ”year”, as we dis-cuss below. The third request is absent of aggre-gate temporal attributes, and hence the system pro-duces a bar chart also added to the display. Finally, for the final requestd), the system closes the most recently generated visualization, i.e. the bar chart (this is not shown in Figure 3).
4.1 Parsing
We begin by parsing the utterance we obtain from the Google Speech API into three NLP structures. ClearNLP (Choi, 2014) is used to obtain Prop-Bank (Palmer et al., 2005) semantic role labels (SRLs), which are then mapped to Verbnet (Kip-per et al., 2008) and Wordnet using SemLink (Palmer, 2009). The Stanford Parser is used to ob-tain the remaining two structures, i.e. the syntac-tic parse tree and dependency tree. The final for-mulation is the conjunctionCpredicate∩Cagent∩
Cpatient∩Cdet∩Cmod∩Caction. The first three
clauses are extracted from the SRL. The NPs from the syntactic parse tree contain the determiners for Cdet, adjectives forCmod, and nouns as arguments
forCaction.
4.2 Request Type Classification
A request is classified into the six actionable types mentioned earlier, for which we developed a
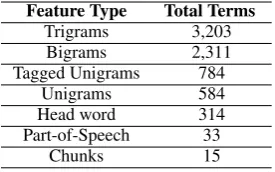
mul-Feature Type Total Terms
Trigrams 3,203
Bigrams 2,311
Tagged Unigrams 784
Unigrams 584
Head word 314
Part-of-Speech 33
[image:3.595.348.486.62.148.2]Chunks 15
Table 3: Feature Types
ticlass classifier. We applied popular question classification features from (Loni et al., 2011) due to the general question-based construct of the requests. Apache OpenNLP (Apache Soft-ware Foundation, 2011) was used to generate un-igrams, bun-igrams, trun-igrams, chunking, and tagged unigrams, while Stanford Parser’s implemented Collins rules (Collins, 2003) were used to obtain the headword. The feature vector is comprised of 7,244 total features, see Table 3. We used Weka (Hall et al., 2009) to experiment with several classifiers. We will discuss their performance in Sec. 5; currently, we use the SVM model, which performs the best.
4.3 Window Management Requests
If the classifier assigns to an utterance the win-dow management type, a logical form along the lines described above will be generated, but no SQL query will be produced. At the moment, key-word extraction is used to determine whether the window management instruction relates to clos-ing, openclos-ing, or repositioning; the system only supports closing the most recently created new vi-sualization.
4.4 Create/Modify Visualization Requests
If the utterance is classified as a request to create or modify visualizations, the logical form is used to produce an SQL query. 6 SQL was partly chosen
because the crime data we obtained from the City of Chicago is stored in a relational database.
Most often, in their requests users include con-straints that can be conceptualized as standard fil-ter and aggregate visualization operators. In ut-terance cin Figure 3, assaults can be considered as a filter, and location as an aggregator ( loca-tion is meant as office, restaurant, etc.). We distinguish between filter and aggregate based on types stored in the KO, a small domain-dependent
6Since our system does not resolve referring expressions
Figure 2: NL-to-Visualization Pipeline
knowledge ontology.7 The KO contains relations,
attributes, and attribute values. Filters such as “as-sault” are defined as attribute values in the KO, whereas aggregate objects such as ”location” are attribute names. A synonym lexicon contains syn-onyms corresponding to each entry in the KO. SQL naturally supports these operators, since the data can be filtered using the ”WHERE” clause and aggregated with the ”GROUP BY” clause.
4.5 Vizualization Specification
The final transformation is from SQL to visual-ization specification. Overall, the specification for creating a new visualization includes the x-axis, y-axis, and plot type. Finally, the VE uses Vega (Trifacta, 2014) to plot a graphical representation of the visualization specification on SAGE2. We currently support 2-D bar charts, line graphs, and heat maps. The different representations for sentencec)from Figure 3 are shown here:
Logical Form: see.01(a) ∩ Action(a, Loop, assault, location)∩Det(a, the)
SQL: SELECT count(*) as TOTAL CRIME, location FROM chicagocrime WHERE (neighborhood = loop) AND (crimetype = assault) GROUP BY location
Visualization Specification: {”horizontalAxis”: ”NON UNIT”, ”horizontalGroupAxis”: ”location”, ”verticalAxis”: ”TOTAL CRIME”, ”plotType”: ”BAR”}
7The system is re-configurable for different domains by
updating the KO.
5 Evaluation
Since the work is in progress, a controlled user study cannot be carried out until all the compo-nents of the system are in place. We have con-ducted piecemeal smaller and/or informal evalua-tions of its components. For example, we have manually inspected the results of the pipeline on the 38 requests that concern creating new visual-izations. The pipeline produces the correct SQL expression (that is, the actual SQL that a human would produce for a given request) for 31 (81.6%) of them (spoken features such as filled pauses and restarts were removed, but the requests are oth-erwise processed unaltered). The seven unsuc-cessful requests fail for various reasons, includ-ing: two are fact-based that cannot be answered yet; two require mathematical operations on the data which are not currently supported; one does not have a main verb, one does not name any at-tributes or values (can I see the map– in the future, our conversational interface will ask for clarifica-tion). For the last one, the SQL query is generated, but it is very complex and the system times out.
As concerns classifying the request type, Ta-ble 4 reports the results of the classifiers trained on the features discussed in Section 4.2. The SVM results are statistically significantly different from the Naive Bayes results (paired t-test), but indis-tinguishable from Random Forest or Multinomial Naive Bayes.
prelimi-Figure 3: Incremental generation of visualizations
Classifier Accuracy
Support Vector Machines 87.65%
Random Forest 85.60%
Multinomial Naive Bayes 85.60%
[image:5.595.78.524.61.269.2]Naive Bayes 74.28%
Table 4: Request Type Classification Accuracy
nary, informal observation is that the generated visualization specifications result in accurate and appropriate visualizations. However, we have not dealt with constraints across visualizations: e.g., consistent application of colors by attribute (theft is always blue), would help users integrate infor-mation across visualizations.
6 Current Work
Annotation.We are focusing on referring expres-sions (see below), and on the taxonomy of abstract visualization tasks from (Brehmer and Munzner, 2013). This taxonomy, which includeswhya task is performed, will help us analyze that 85% of the users utterances that are not directly actionable. In fact, many of those indicate thewhy, i.e. the user’s goal (e.g.,”I want to identify the places with vio-lent crimes.”).
Dialogue Manager / Referring Expressions.We are developing a Dialogue Manager (DM) and a Visualization Planner (VP) that will be in a con-tinuous feedback loop. If the DM judges the query to be unambiguous, it will pass it to the VP. If not, the DM will generate a clarification request for the user. We will focus on referring expres-sion resolution, necessary when the user asks for
a modification to a previous visualization or wants to manipulate a particular visualization. In this do-main, referring expressions can refer to graphical elements or to what those graphical elements rep-resent (color the short bar red vs. color the theft bar red), which creates an additional dimension of coding, and an additional layer of ambiguity.
The Visualization Planner.The VP both needs to create more complex visualizations, and to man-age the screen real estate when several visualiza-tions are generated (which is the norm in our data collection, see Figure 1, and reflected in the sys-tem’s output in Figure 3). The VP will deter-mine the relationships between the visualizations on screen and make decisions about how to po-sition them effectively. For instance, if a set of visualizations are part of a time series, they might be more effective if ordered on the display.
References
Apache Software Foundation. 2011. Apache OpenNLP. http://opennlp.apache.org.
Matthew Brehmer and Tamara Munzner. 2013. A multi-level typology of abstract visualization tasks.
IEEE Transactions on Visualization and Computer Graphics, 19(12):2376–2385.
Jinho D. Choi. 2014. Optimization of Natural Lan-guage Processing components for Robustness and Scalability. Ph.D. thesis, University of Colorado Boulder.
[image:5.595.102.258.312.367.2]Michael Collins. 2003. Head-driven statistical models for natural language parsing. Computational Lin-guistics, 29(4):589–637.
Kenneth Cox, Rebecca E Grinter, Stacie L Hibino, Lalita Jategaonkar Jagadeesan, and David Mantilla. 2001. A multi-modal natural language interface to an information visualization environment. Interna-tional Journal of Speech Technology, 4(3-4):297– 314.
Steven Feiner. 1985. APEX: an experiment in the automated creation of pictorial explanations. IEEE Computer Graphics and Applications, 5(11):29–37. Tong Gao, Mira Dontcheva, Eytan Adar, Zhicheng Liu, and Karrie G. Karahalios. 2015. DataTone: Man-aging Ambiguity in Natural Language Interfaces for Data Visualization. InProceedings of the 28th An-nual ACM Symposium on User Interface Software & Technology, pages 489–500. ACM.
Lars Grammel, Melanie Tory, and Margaret Anne Storey. 2010. How information visualization novices construct visualizations. IEEE Transac-tions on Visualization and Computer Graphics, 16(6):943–952.
Nancy L. Green, Giuseppe Carenini, Stephan Kerped-jiev, Joe Mattis, Johanna D. Moore, and Steven F. Roth. 2004. Autobrief: an experimental system for the automatic generation of briefings in integrated text and information graphics. Int. J. Hum.-Comput. Stud., 61(1):32–70.
Mark Hall, Eibe Frank, Geoffrey Holmes, Bernhard Pfahringer, Peter Reutemann, and Ian H. Witten. 2009. The WEKA data mining software: an update.
ACM SIGKDD Explorations Newsletter, 11(1):10– 18.
Jeffrey Heer, Frank Van Ham, Sheelagh Carpendale, Chris Weaver, and Petra Isenberg. 2008. Creation and collaboration: Engaging new audiences for in-formation visualization. In Information Visualiza-tion, pages 92–133. Springer.
Karin Kipper, Anna Korhonen, Neville Ryant, and Martha Palmer. 2008. A large-scale classification of English verbs. Language Resources and Evalua-tion, 42(1):21–40.
Zhuo Li, Matthew Stagitis, Kathleen F. McCoy, and Sandra Carberry. 2013. Towards Finding Rele-vant Information Graphics: Identifying the Inde-pendent and DeInde-pendent Axis from User-Written Queries. InProceedings of the Twenty-Sixth Inter-national Florida Artificial Intelligence Research So-ciety Conference (FLAIRS 13), pages 226–231. Babak Loni, Gijs Van Tulder, Pascal Wiggers,
David MJ Tax, and Marco Loog. 2011. Question classification by weighted combination of lexical, syntactic and semantic features. InText, Speech and Dialogue, pages 243–250. Springer.
Jock D. Mackinlay, Pat Hanrahan, and Chris Stolte. 2007. Show me: Automatic presentation for visual analysis. IEEE Transactions on Visualization and Computer Graphics, 13(6):1137–1144.
Thomas Marrinan, Jillian Aurisano, Arthur Nishimoto, Krishna Bharadwaj, Victor Mateevitsi, Luc Renam-bot, Lance Long, Andrew Johnson, and Jason Leigh. 2014. Sage2: A new approach for data intensive col-laboration using scalable resolution shared displays. In Collaborative Computing: Networking, Appli-cations and Worksharing (CollaborateCom), pages 177–186. IEEE.
Raveesh Meena, Gabriel Skantze, and Joakim Gustafson. 2014. Data-driven models for timing feedback responses in a Map Task dialogue system.
Computer Speech & Language, 28(4):903–922. Martha Palmer, Daniel Gildea, and Paul Kingsbury.
2005. The Proposition Bank: An Annotated Cor-pus of Semantic Roles. Computational Linguistics, 31(1):71–105, March.
Martha Palmer. 2009. Semlink: Linking PropBank, Verbnet and FrameNet. InProceedings of the Gen-erative Lexicon Conference, pages 9–15.
Norbert Reithinger, Dirk Fedeler, Ashwani Kumar, Christoph Lauer, Elsa Pecourt, and Laurent Romary. 2005. MIAMM - A Multimodal Dialogue Sys-tem Using Haptics. In J. van Kuppevelt, L. Dybk-jaer, and N. O. Bernsen, editors, Advances in Nat-ural Multimodal Dialogue Systems, pages 307–332. Springer.
Steven F Roth, John Kolojejchick, Joe Mattis, and Jade Goldstein. 1994. Interactive graphic design using automatic presentation knowledge. InProceedings of the SIGCHI Conference on Human Factors in Computing Systems, pages 112–117. ACM.
Yiwen Sun, Jason Leigh, Andrew Johnson, and Bar-bara Di Eugenio. 2013. Articulate: Creating Mean-ingful Visualizations from Natural Language. In Weidong Huang and Mao Lin Huang, editors, Inno-vative Approaches of Data Visualization and Visual Analytics, pages 218–235. IGI Global.
Trifacta. 2014. Vega: A Visualization Grammar. https://vega.github.io/vega/.
Fernanda B. Viegas, Martin Wattenberg, Frank Van Ham, Jesse Kriss, and Matt McKeon. 2007. ManyEyes: a Site for Visualization at Internet Scale.
IEEE Transactions on Visualization and Computer Graphics, 13(6):1121–1128.