Dynamic Performance of Fuel Cell Power Module for
Mobility Applications
Bouziane Mahmah1, Ghania Morsli1, Mounia Belacel1, Hocine Benmoussa2, Soulef Achachera3, Amina Benhamou4, Maїouf Belhamel1
1Hydrogen Renewable Energy, Centre de Développement des Energies Renouvelables (CDER), Algiers, Algeria
2Mechanical Engineering Department, Batna University, Batna, Algeria
3Photovoltaic Research Division, Algerian Centre for Renewable Energy Development (CDER), Algiers, Algeria
4Motor’s Dynamic and Vibroacoustic Laboratory, University of Boumerdes, Boumerdes, Algeria Email: [email protected], [email protected]
Received October 31,2012; revised December 10, 2012; accepted December 25, 2012
ABSTRACT
Fuel cell powered vehicles have been developed as another alternative to internal combustion engine powered vehicles for some applications including passenger cars, buses, trains, motorcycles, forklifts, electric wheelchairs, electric trolleybuses, medical carts, military engines, personal sports craft, mobility devices and other self propelled equipment. Up to now, many researches have focused on the development of the power module in the Fuel cell vehicles (FCVs) and the components of these systems such as membranes, bipolar plates, and electrodes. However, our work in this study focuses on operating the integrated fuel cell power module system efficiently for various operating conditions such as pressure, relative humidity and operating modes. In our validation we have utilized PEMFC single cell, with active area geometry 16 cm2 and of 120 cm2. Some results obtained in our study shown significant performance indica- tors for PEMFC stack (composed of 2 cells and 4 cells in a series) at different humidification levels.
Keywords: Fuel Cell Power Module; Mobility Applications; PEMFC Stack Voltage; Experimental Validation
1. Introduction
Fuel cells (FC) are electrochemical devices that convert the chemical energy of the fuel (that is, hydrogen, metha- nol, and methane) directly into electrical and thermal energy at higher efficiency than internal combustion en- gines. Fuel cell technologies have received much atten- tion in recent years owing to their high efficiencies, low emissions, and flexible modular structure, compared with conventional power generation systems [1,2].
Since the invention of the very first “gas voltaic bat- tery” by Robert Grove in 1839 [3], several different fuel cell types, which is differentiated by the electrolyte used and the operating temperature, are under investigation and have been developed [4]. The fuel cell became a real option for a wider application base in the late 1980s and early 1990s, although interest efforts increased in fuel cell systems for specific applications [5]. Currently, new Research & Development Programs focusing on large scale testing and on market introduction of fuel cell technology especially in the transport sector, can open an opportunity for fuel cell vehicles (FCVs) in the future [6].
“Over the last five years there has been a twenty-fold increase in shipments of fuel cells with year-on-year growth in both units and megawatts shipped. In 2010, total shipments of fuel cells grew by 40% compared with the previous year, approaching a new high of 230,000 units. Portable fuel cells accounted for 95% of this total but there was substantial growth in other sectors. Over 97% of fuel cells sold worldwide in 2010 used proton exchange membrane fuel cell (PEMFC) technology, and most were hydrogen-fuelled. Europe has been the leading region of adoption for fuel cells since 2009, followed by North America and Asia (including Japan), with all four regions (including the Rest of the World) seeing substan- tial increases in shipments over that time” [7].
tion, control strategies, hydrogen storage materials and many more will be necessary [6].
The performance of fuel cell power module in mobil- ity applications is affected with many additional factors (membrane humidification, cells temperature, operation pressure, reactant gas flow rate, impurities...). In this vision the explanation of the effects of operating condi- tions on the specific ability the cell active surface area, and their relationship with the PEM fuel cell stack per- formance, reported in terms of its power output per cm² of cell area, is not so widely presented in the scientific literature. Although, Srinivasan et al. (1988) have pre- sented the correlation of the electrochemically active surface area with the observed cell potential-current den- sity and also with the values of differential resistances of the cells in the linear regions [8]. After them, Carrette et al. (2001) have tried to conclude that an increase in elec- trochemically active surface area indicates an the in- crease in fuel fell performance [9], then Meyers et al. (2002) have expressed that the geometry of the cell must allow for sufficient surface area of the anode and cathode to facilitate the necessary reactions, as the kinetic losses are a function of current density, so enhancing the sur- face area of the more sluggish electrode leads to improve its performance. However, one can increase the surface area of the slower electrode, thereby attaining the same total current for a lower current density and, hence, low- ering kinetic losses for that electrode [10], Larminie and Dicks (2003) have recognized the very importance of this question, like this, the electrode area is such a vital issue that the performance of a fuel cell design is often quoted in terms of the current per cm2 [11]. After this period, the occupation of scientific research is focused on the rela- tionship between the regression in the active surface area and loading of the noble metal catalysts, Yamafuku et al. (2004) have shown that the decrease of mass activity seems to be caused by the decrease of active surface area of platinum particle with the crystal growth of platinum particle at higher concentration, they were noticed as a decrease in effective surface area of roughly 60% was found under drying conditions, and a decrease of roughly 40% was found under flooding conditions. The observed decrease in the interfacial capacitance can be converted into an equivalent decrease in the electrochemical active surface area with time, which could be due to the slow approach to steady-state operation [12]. In 2006, Dicks concluded that the ideal support should have a high sur- face area, good electrical properties, and high electro- chemical stability under harsh conditions and the elec- trocatalyst should be easily accessible to the reactants [13]. Florian Finsterwalder (2007) mentioned that, in order to minimize the surface area loss under potentio- dynamic operation the cell voltage should for this type of catalyst be kept within a small window and below ca.
mW/cm2 and 861 mW/cm2 at 400˚C and 450˚C, respect- tively [24] and in the rapport (2012) of Manufacturing Fuel Cell Manhattan Project, it is noticed that the geome- try of the cell must allow for sufficient surface area of the anode and cathode to facilitate the necessary reaction, and the current designs need to be examined for utilize- tion of membrane surface area. There is a significant opportunity to reduce the membrane surface area by de- signing and assembling the modules for maximum utili- zation of the available membrane area. Manufacturers of fuel cell systems have not invested the time and effort necessary to conduct statistically significant studies and generate empirical performance data that can be used to develop optimal designs for these modules. The limiting factor for performance is the total surface area on the air side of the heat exchanger since the heat transfer coeffi- cient is much lower on the air side than the coolant side. A folded fin structure that is brazed to the coolant loop is typically used to maximize available air side heat transfer area, much like a radiator for an automobile. They ex- amined different ways; among them for the counting to minimize scrap, one based on minimization of the sur- face area in the system available for skinning [25]. In 2012, Spernjak et al. they noticed, in the absence of a microporous layer, higher water content during potential holds will cause a faster degradation of the cathode cata- lyst layer, higher kinetic losses and faster decrease of the active surface area [26] and Nishimura et al. (2012) have noticed that particularly, at the time of stopping the fuel cell, if the fuel cell voltage is maintained at 0.8 volt per unit cell or higher under a high temperature state, sinter- ing of catalyst takes place to gather catalyst particles thereby to decrease an active surface area and lower a fuel cell voltage. In order to avoid the problem, it is nec- essary to remove hydrogen and oxygen remaining in the fuel cell [27].
So our contribution is based in an experimental work, with coupling influences of operating conditions (humidi- fication and oxygen pressure) and the increase of the cell active surface area of the PEMFC stack, in order to pro- duce more-efficient fuel cells module.
2. Fuel Cell Vehicles Configurations
A fuel cell system vehicle can be represented with three possible configurations [28]:
• Fuel Cell System Hybrid Fuel Cell Vehicles (Fuel Cell and Rechargeable Electric Storage): The hybrid power train consists of a fuel cell system, a storage de- vice for electrical energy, power electronics, and the electric machine at a minimum.
• Fuel Cells for Auxiliary Power.
• Pure Fuel Cell Vehicles (FCVs): The system of fuel cell is the only source of energy, and that can cope with the dynamic power demands of the vehicle.
In this work, our study has opted for the choice of a design of the third configuration of “Pure Fuel Cell Ve- hicles”, and based on the following baseline studies [29- 31]: SAE J 2615 Reference test procedures of fuel cell systems for automotive application, SAE J 2616 Per- formance test procedures for the fuel processor systems for automotive application, and SAE J 2617 Performance test procedures of PEM fuel cell stack subsystem for automotive application.
The Fuel Cell Vehicles (FCVs) require technologically advanced components not found in today’s conventional vehicles to operate. The major components of typical FCVs include (fuel cell system power module, Power electronics, Electric machines, Energy storage system, and Hydrogen storage system), see Figure 1. The most apparent difference is the fuel cell system power module, but many other components are needed for a complete and functional system [33].
3. Fuel Cell Power Module
The Fuel cell power module’s, which produces electric power from hydrogen and air, physical, mechanical, and electrical performance characteristics are (Voltage, Cur- rent, Power, System Efficiency, Coolant Temperature, Weight, Volume). This power module, shown in Figure 2, consists of three subsystems: stack modules, air de- livery, and cooling. The support systems for the stacks, such as the air system, water management, and cooling system.
Our objective, in this work, is the testing of fuel cell power module.
4. Experimentation Description: Materials
and Methods
4.1. Experimental System
[image:3.595.308.540.554.709.2]Two types of PEM fuel cells were used for all experi- ments in this study:
Figure 2. Block diagram of the power module [34].
4.2. Experimental Procedure
[image:4.595.310.537.275.421.2]The laboratory PEM fuel cell stack workbench, shown in
Figure 3 can control the fuel cell temperature, humidify- cation, temperatures and pressures on both the anode and cathode sides through a computer connected with Omega OM-3000 series portable data logger, that is make taking measurements and downloading them to our PC, so that with the T6V4 module allows up to six channels of tem- perature measurement ranging from (–250˚C) to (+1370˚C) depending on the thermocouple type, relative humidity (RH) and up to four channels of voltage measurement with user-selectable. In the platform tested, reactant gases are humidified by passing through external water tanks. Regulating the water temperature controls the humidify- cation of the reactant gases and the pressures are con- trolled by backpressure regulators.
Figure 3. Schematic diagram of the experimental device (P: pressure, d: gas flow, λ: humidification) [Hydrogen Labo- ratory; CDER—Algeria, 2011].
expressing the change of model parameters in semi-em- pirical equations. The output voltage expression of a sin- gle cell can be written:
5. Modeling
5.1. Mathematical Cell Model
PAC Nernst act ohm conc
E E (1)
5.1.1. Ideal Cell Model
The reversible voltage of the cell
ENernst
, The ideal performance of a fuel cell depends on the elec-trochemical reactions that occur with different fuels. It is defined by its Nernst potential, and represented as cell voltage. In reality, the output voltage of the fuel cell is defined as the function of the thermodynamic potential, the concentration overvoltage, the activation overvoltage, and the ohmic overvoltage. The fuel cell voltage is rep- resented with many models.
2
23
5 *
1.229 0.85 10 298.15
1
4.31 10 ln ln
2
Nernst
H O
E T
T P P
* (2) The activation voltage loss,
*2
1 2 3 ln 4 ln
act T T CO T IPAC
(3)
5.1.2. Empirical Cell Model
The ohmic voltage loss, In our work [35-38] based mainly on three research
works of Amphlett et al., (1993, 1994, 1996, 1997, 2000 and 2002) [39-45] developed a semi-empirical model for the Ballard Mark cell. Their model combines perform- ance losses in parametric equations based on cell operat- ing conditions and incorporated the voltage degradation into the generalized steady-state model (GSSEM) by
ohm IPAC RM RC
[image:4.595.310.543.508.686.2]M M r l R A
(5) where (L) is the membrane thickness (cm), (A) is the ac- tive surface of the fuel cell (cm2) and rM is the membrane specific resistivity for the flow of hydrated protons (Ω·cm), rM can be obtained by the following expression:
2.5 2
181.6 1 0.03 0.062
303
303
0.634 3 exp 4.18
M
PAC
PAC r
I
I T PAC
A I T A T
A
(6) The term 181.6
0.634
represents the specific resistivity
(Ω·cm) at and the temperature T = 30˚C, where (T) is the cell absolute temperature in Kelvin de- grees. From Springer et al. (1991-1993) [46-48] the (λ) term represents an empirical correction to the specific resistivity to bring in two other factors that affect the average water content of the membrane, protonic current density and cell temperature, and the parameter (λ) can have a value as high as 14 under ideal, 100% relative humidity conditions and has had reported values as high as 22 and 23 under supersaturated conditions.
0 PAC
I
From the expressions (4) to (6), the ohmic polarisation can be written as (see the Equation (7) below),
5.1.3. Polarization Global Expression
The detailed of the global polarization expression de-
scribed the electrochemical model with essential para- metric empirical coefficients, which is represented by the output voltage expression of a single cell in Equation (1), is as follows (see the Equation (8) below);
And the voltage of the module is obtained by the mul- tiplication of the number of cells by the voltage of a sin-gle cell;
FC c
E n EFC (9) 5.2. Predicting Performance Model
The mathematical model proposed to modeling the PEMFC Power Module of Fuel Cell Vehicles is based on the electrochemical work [35-38] which present a modi- fied version of a semi-empirical model developed by Mann et al., (2000), description of these input parameters is presented in the Table 1 [45] and Amphlett et al,. (1993) [40]. That they have developed a practical flexible model of prediction to calculate the cell voltage output in terms of complex relationships between current, stack temperature, and inlet partial pressure of hydrogen and oxygen. In the modified version we include a new value of empirical coefficient in the formulation of the activa- tion polarization related to the specific physical model of the laboratory.
The model utilizes an iterative computer solution which could calculate any variable in terms of the others. The use of this model can make it possible to determine and to achieve various levels of power required for different vehicle power supplies, in different applications of auto- mobiles (buses, locomotives, ships, submarines, and un- manned underwater vehicles) with large power supplies of 3 - 3000 kW.
2.5 2
181.6 1 0.03 0.062 .
303
303
0.634 3 exp 4.18
PAC PAC
PAC
ohm C
PAC
I T I
A A
I
L A R
A I T
A T
(7)
773 5 3
3 5 498 – 6 5 5 1 1
2 282 0.85 10 298 15 4 031 10 ln ln 2 86 10
2 2
1 2
2 10 ln 4 3 10 ln 10 ln
5
. . .
08 10 e 1 09
.
. 7.8
. . 10 e T
cFC anod cath
anod
cath T
E T T P P T
P P
A T T
2 3 2.5 2 max H O 4 SO181.6 1 0.03 0 062
3
1 97. 03 1
303
0.634 3 e
10 ln xp 4.1 – 8 FC FC FC FC C T A A I I
T IFC I l
I
J
R B
A T J
Table 1. Parameters of Mann electrochemical model.
Mann (2000)
M M
r l R
A
Ballard Mark—IV Ballard Mark—V
1 0.9514
1 0.944
3 2 3.12 10
3
2 3.54 10
4 3 0.74 10
4
3 0.78 10
4 4 1.87 10
4
4 1.96 10
Model: GSSEM
Generalised Steady-State Electrochemical Model
1 0.948 0.004
25 * 2 0.00286 0.0002 ln A 4.3 10 lnCH
5
3 7.6 0.2 10
4
4 1.93 0.05 10
6. Results and Discussion
The water uptake ratio
H O SO2 3
of Nafion 117 membrane as a function of relative humidity RH[49-51], is shown in Figure 4.
The produced Figures 5 and 6 will show the I-V characteristic for two typical cells of PEMFC according to the active area respectively 16 cm2 and 120 cm2.
The I-V characteristic presented in Figure 6 according to the active area of 120 cm2, showing a good perform- ance with the different water uptake ratio (), so we went opted for the assembly of cells with this surface.
Therefore Figures 7 and 8 show polarization curves obtained with two and four cells assembled in series, but we observed an anomaly with the low humidification (water uptake ratio () = 1 and = 3), where we applied equal pressure on both sides of the anode and cathode, although for ( = 23) is validated in the numerical model (Equations (8) and (9)) with input parameters presented in Table 2.
And the power density of the fuel cell module power P (W·cm−2) expressed by the formula (P = V × I), composed of 4 cells in series with an active area equal to 120 cm2, its variation is represented by the Figure 9, Our model presented with his parameters in Table 3, with different values of water uptake ratio (), was experimentally validated with various operating conditions presented in
Table 2, but with ( = 23) a numerical validation is ap- plied.
To check stability and performance with the optimal value ( = 14), we have studied in Figure 10 the pressure-gradient effect between along the two sides of stack consisting of four cells with surface active area equal to 120 cm2.
Even with the small active surface area (Figures 11
and 12); we have seen an improvement in the PEMFC
Figure 4. Water uptake ratio () of Nafion 117 membrane as a function of relative humidity (RH) [49].
Figure 5. The simulated I-V characteristics of PEMFC sin- gle cell, with active area geometry (A = 16 cm2), at different
humidification levels (Lambda).
Figure 7. The simulated I-V characteristics of PEMFC stack (composed of 2 cells in a series), with active area ge- ometry (A = 120 cm2), at different humidification levels ().
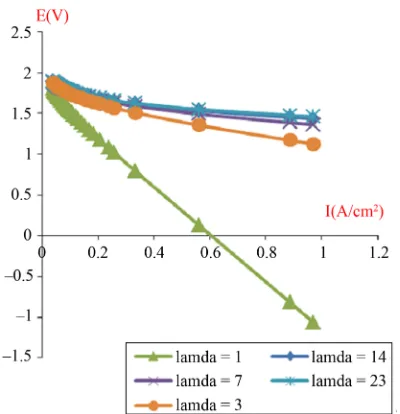
Figure 8. The simulated I-V characteristics of PEMFC stack (composed of 4 cells in a series), with active area ge- ometry (A = 120 cm2), at different humidification levels ().
performance with an application of significant pressure at the cathodic side (for oxygen) in comparison with the case of Figure 5.
In addition, we have observed an important influence of oxygen pressure on the performance of the stack; we used the best characteristic value obtained in the experi- ment as a reference and we have successively increased the pressure in the cathode-outside (Figure 13).
7. Conclusions and Outlook
[image:7.595.307.538.100.280.2]The comparisons and analyses of some results obtained
Table 2. Operating/design parameters of fuel cells.
Parameters PEM fuel cell 1 PEM fuel cell 2
A (cm2) 16 120
Membrane Nafion 117 Nafion 117
l (membrane thickness) (μm) 230 230
n (number of cells) 4 4
B (V) 0.016 0.016
T 298.15 K
Panod (atm) 0.01 - 1 0.01 - 1
Pcath (atm) 0.02 - 2 0.02 - 2
RC (Ω) 0.0003 0.0003
λ (water content)
H O2 SO3
mol mol 0 - 23 0 - 23
H2 N55 ≡ 99.999 N55 ≡ 99.999
Table 3. Parameters of Mahmah electrochemical model.
Mahmah (2012) PEMPower1-FuelCell H-TEC
A = 16 cm2
&
Laboratory PEM fuel cell stack workbench development similar of the Ballard Nexa system
A = 120 cm2 With Membrane (Nafion 117)
M M
r l R
A
1
con
mac
J B
J
1 1.053
25 * 2 0.00286 + 0.0002 ln A + 4.3 10 lnCH
5 3 7.8 10
4 4 1.97 10
[image:7.595.307.538.293.700.2]
[image:7.595.72.275.339.547.2]Figure 10. The simulated I-V characteristics of PEMFC stack (composed of 4 cells in a series), with active area ge- ometry (A = 120 cm2), with different values of pressure gra-
[image:8.595.72.278.83.262.2]dient (anode/cathode), and at the humidification level [Lambda (λ) = 14)].
Figure 11. The simulated I-V characteristics of PEMFC single cell, with active area geometry (A = 16 cm2), with
different values of the cathode pressure, and at the humidi- fication level (Lambda (λ) = 14).
in our present study for power module in the fuel-cell vehicles previously shown significant performance indi- cators:
[image:8.595.322.528.316.510.2] The advantages of operating PEMFCs at elevated pressures are often debated. The question to pressur- ize the system is in relation with certain elements (costs, size, weight, etc.). The increase of pressure is helpful to increasing the voltage of the cell, in our case, a motor powered with fuel cell power modules would be functioned with compressed intake air, which would be necessary to supply an adequate
Figure 12. Influence of the pressure gradient (anode/cath- ode) on the module power of PEMFC single cell, with active area geometry (A = 16 cm2), and humidification level
(Lambda (λ) = 14).
Figure 13. The simulated I-V characteristics of PEMFC stack (composed of 4 cells in a series), with active area ge- ometry (A = 120 cm2), with different values of the cathode
pressure, and at the humidification level [Lambda (λ) = 14].
amount of O2 and satisfy water concerns.
The humidification level of the cell is lower, thus leading to lower conductivity. The cell performance is therefore low. The higher humidification levels are best for high loads.
The output current of a fuel cell is proportional to its active area. Consequently the fuel cell power module geometry can be tailored to provide the desired output voltage, current and power characteristics.
[image:8.595.73.277.328.546.2]8. Acknowledgements
This preliminary study was conducted as part of a re- search project “Solar Fuel”. The authors acknowledge the Center for Renewable Energies Development (CDER), The General Directorate for Scientific Research and Tech- nological Development (DG-RSDT), as well as The Na- tional Observatory of the Environment and the Durable Development (ONEDD) and the Ministry of Town and Country Planning and the Environment for their sup- ports.
REFERENCES
[1] Y. Wang, K. S. Chen, J. Mishler, S. C. Cho and X. C. Adroher, “A Review of Polymer Electrolyte Membrane Fuel Cells: Technology, Applications, and Needs on Fundamental Research,” Applied Energy, Vol. 88, No. 4, 2011, pp. 981-1007. doi:10.1016/j.apenergy.2010.09.030 [2] C. Wang and M. H. Nehrir, “Load Transient Mitigation
for Stand-Alone Fuel Cell Systems,” IEEE Transactions on Energy Conversion, Vol. 22, No. 4, 2007, pp. 887-897. [3] W. R Grove, “On a Gaseous Voltaic Battery,” Philoso- phical Magazine and Journal of Science, Vol. 21, No. 140, 1842, pp. 417-420.
[4] M. L. Perry and T. F. Fuller, “A Historical Perspective of Fuel Cell Technology in the 20th Century,” Journal of the Electrochemical Society, Vol. 149, No. 7, 2002, pp. S59- S67. doi:10.1149/1.1488651
[5] S. M. J. Zaidi, “Research Trends in Polymer Electrolyte Membranes for PEMFC,” In: S. M. Javaid Zaidi and T. Matsuura, Eds., Polymer Membranes for Fuel Cells, Springer Science + Business Media, LLC., New York, 2009, pp. 7-25. doi:10.1007/978-0-387-73532-0
[6] B. Egger, P. H. Dietrich, A. Dorda and A. Pesaran, “Worldwide Promotion and Deployment of Fuel Cell Ve- hicles,” 24th International Battery, Hybrid and Fuel Cell Electric Vehicle Symposium (EVS24), Vol. 3, Stavanger, 13-16 May 2009, pp. 1864-1868.
[7] J. Matthey, “Catalyst Preparation for the 21st Century: Controlled Catalyst Synthesis to Match form to Func- tion,” Platinum Metals Review, Vol. 54, No. 3, 2010, pp. 162-165. doi:10.1595/147106710X509621
[8] S. Srinivasan, E. A. Ticianelli, C. R. Derouin and A. Redondo, “Advances in Solid Polymer Electrolyte Fuel Cell Technology with Low Platinum Loading Elec- trodes,” Journal of Power Sources, Vol. 22, No. 3-4, 1988, pp. 359-315. doi:10.1016/0378-7753(88)80030-2 [9] L. Carrette, K. A. Friedrich and U. Stimming, “Fuel Cells:
Fundamentals and Applications,” Fuel Cells, Vol. 1, No. 1, 2001, pp. 5-39.
doi:10.1002/1615-6854(200105)1:1<5::AID-FUCE5>3.0. CO;2-G
[10] J. P. Meyers and H. L. Maynard, “Design Considerations for Miniaturized PEM Fuel Cells,” Journal of Power Sources, Vol. 109, No. 1, 2002, pp. 76-88.
doi:10.1016/S0378-7753(02)00066-6
[11] J. Larminie and A. Dicks, “Fuel Cell Systems Explained,”
2nd Edition, John Wiley & Sons Ltd., Chichester, 2003. [12] T. Yamafuku, K. Totsuka, S. Hitomi, H. Yasuda and M.
Yamachi, “Optimization of Polymer Electrolyte Distribu- tion of Ultra-Low Platinum Loading Electrode for PEFC,”
Technical Report, Vol. 63, No. 1, 2004, pp. 23-37. [13] A. L. Dicks, “The Role of Carbon in Fuel Cells,” Journal
of Power Sources, Vol. 156, No. 1, 2006, pp. 128-141. doi:10.1016/j.jpowsour.2006.02.054
[14] F. Finsterwalder (DaimlerChrysler AG), “Degradation of the Active Catalyst Surface in Automotive Fuel Cells,”
Proceedings of the 212th Electrochemical Society Meet- ing, Vol. 1-3, Washington DC, October 7-12, 2007, p. 400.
[15] K. S. Dhathathreyan and N. Rajalakshmi, “Polymer Elec- trolyte Membrane Fuel Cell,” In: S. Basu, Ed., Recent Trends in Fuel Cell Science and Technology, Anamaya Publishers, New Delhi, 2007, pp. 40-115.
doi:10.1007/978-0-387-68815-2_3
[16] P. Lu and B. Ding, “Applications of Electrospun Fibers,”
Recent Patents on Nanotechnology, Vol. 2, No. 3, 2008, pp. 169-182. doi:10.2174/187221008786369688
[17] L. C. Colmenares, A. Wurth, Z. Jusys and R. J. Behm, “Model Study on the Stability of Carbon Support Materi- als under Polymer Electrolyte Fuel Cell Cathode Opera- tion Conditions,” Journal of Power Sources, Vol. 190, No. 1, 2009, pp. 14-24.
doi:10.1016/j.jpowsour.2009.01.078
[18] Y. S. Li, T. S. Zhao and Z. X. Liang, “Effect of Polymer Binders in Anode Catalyst Layer on Performance of Al- kaline Direct Ethanol Fuel Cells,” Journal of Power Sources, Vol. 190, No. 2, 2009, pp. 223-229.
doi:10.1016/j.jpowsour.2009.01.055
[19] F. C. Nart and W. Vielstich, “Normalization of Porous Active Surfaces,” In: W. Vielstich, H. A. Gasteiger, A. Lamm and H. Yokokawa, Eds., Handbook of Fuel Cells— Fundamentals, Technology and Applications, Vol. 2, John Wiley & Sons Ltd., Chichester, 2009, pp. 302-315. [20] E. A. Ticianelli and E. R. Gonzalez, “Fundamental Ki- netics/Transport Processes in MEAs,” In: W. Vielstich, H. A. Gasteiger and A. Lamm, Eds., Handbook of Fuel Cells—Fundamentals, Technology and Applications, Vol. 2, John Wiley & Sons Ltd., Chichester, 2003, pp. 490- 501.
[21] M. Ünlü, J. Zhou and P. A. Kohl, “Study of Alkaline Electrodes for Hybrid Polymer Electrolyte Fuel Cells,”
Journal of the Electrochemical Society, Vol. 157, No. 10, 2010, pp. B1391-B1396. doi:10.1149/1.3468700
[22] V. T. T. Ho, B.-J. Hwang and J.-F. Lee, “New Catalyst Support Improves Efficiency and Durability of Fuel Cells,” NSRRC Activity Report, National Synchrotron Radiation Research Center, Taiwan, 2011, pp. 44-45. [23] E. Zakrisson, “The Effect of Start/Stop Strategy on PEM
Fuel Cell Degradation Characteristics. Master of Science,” Master of Science Thesis, Chalmers University of Tech- nology, Gothenburg, 2011.
2011, pp. 899-906. doi:10.1557/mrs.2011.265
[25] The Benchmarking and Best Practices Center of Excel- lence (B2PCOE), “Manufacturing Fuel Cell—Manhattan Project,” ACI Technologies Inc., Philadelphia, 2012, 283 Pages.
[26] D. Spernjak, J. D Fairweather, T. Rockward, K. C. Rau, J. S. Spendelow, R. L. Borup, R. Mukundan and D. Hussey, “Influence of in Situ and ex Situ Aging of Gas Diffusion Layers on Fuel Cell Performance Degradation,” Confer- ence: ECS Meeting,Honolulu, 7-10 October 2012, pp. 1672- 1678.
[27] K. Nishimura, J. Imahashi, M. Komachiya and K. Taka- hashi, “Method of Stopping a Solid Polymer Type Fuel Cell System,” Patent No. US 8173313, 2012.
[28] O. Ellabban, J. Van Mierlo, P. Lataire and P. Van den Bossche, “Z-Source Inverter for Vehicular Applications,”
Vehicle Power and Propulsion Conference (VPPC), Chi- cago, 6-9 September 2011, pp. 1-6.
[29] United Nations Economic Commission for Europe, “In- formal Documents for the 53rd GRB Session,” 15-17 February 2011.
http://www.unece.org/trans/main/wp29/wp29wgs/wp29gr b/grbinf53.html
[30] G. Brusaglino, “Energy and Operation Performance of Hydrogen (H2) Fuelled Vehicles,” 16 September 2009. http://www.unece.org/fileadmin/DAM/trans/doc/2009/wp 29grpe/H2SGE-04-IP-02e.pdf
[31] Industry Standards & Regulations, Retrieved 30 August 2012.
http://www.ihs.com/products/industry-standards/org/sae/j -series/page18.aspx
[32] P. Thounthong, S. Raël and B. Davat, “Test of a PEM Fuel Cell with Low Voltage Static Converter,” Journal of Power Sources, Vol. 153, No. 1, 2006, pp. 145-150. doi:10.1016/j.jpowsour.2005.01.025
[33] J. Ryu, Y. Park and M. Sunwoo, “Electric Power Train Modeling of a Fuel Cell Hybrid Electric Vehicle and De- velopment of a Power Distribution Algorithm Based on Driving Mode Recognition,” Journal of Power Sources, Vol. 195, No. 17, 2010, pp. 5735-5748.
doi:10.1016/j.jpowsour.2010.03.081
[34] N. Romani, “Modélisation et Commande du Système d’Alimentation en Air pour le Module de Puissance d’un Véhicule à Pile à Combustible avec Reformeur Em- barqué,” Thèse de Doctorat en Physique, Faculté des Sciences d’Orsay, Université Paris-Sud, Orsay, 2007. [35] D. Haddad, H. Benmoussa, N. Bourmada, K. Oulmi, B.
Mahmah and M. Belhamel, “One Dimensional Transient Numerical Study of the Mass Heat and Charge Transfer in a Proton Exchange Membrane for PEMFC,”Interna- tional Journal of Hydrogen Energy, Vol. 34, No. 11, 2009, pp. 5010-5014. doi:10.1016/j.ijhydene.2008.12.033 [36] B. Mahmah, A. M’Raoui, M. Belhamel and H.
Ben-moussa, “Experimental Study and Modelling of a Fuel Cell PEMFC Fed Directly with Hydrogen/Oxygen,” The
16th World Hydrogen Energy Conference (WHEC 16), Lyon, 13-16 June 2006, 10 Pages.
[37] F. Amrouche, B. Mahmah, M. Belhamel and H. Ben-
moussa, “Modélisation d’une Pile à Combustible PEMFC Alimentée Directement en Hydrogène-Oxygène et Vali- dation Expérimentale,”Revue des Energies Renouvelables, Vol. 8, No. 2, 2005, pp. 109-121.
[38] B. Mahmah, A. M’Raoui, M. Belhamel and H. Ben- moussa, “Simulation Numérique Unidimensionnelle du Phénomène de Transfert de Chaleur et de Transport de Masse et Charge dans une PEMFC,” Revue des Energies Renouvelables, Special Issue, 2003, pp. 103-110. [39] M. W. Fowler, R. F. Mann, J. C. Amphlett, B. A. Peppley
and P. R. Roberge, “Incorporation of Voltage Degrada- tion into a Generalized Steady State Electrochemical Model for a PEM Fuel Cell,” Journal of Power Sources, Vol. 106, No. 1-2, 2002, pp. 274-283.
doi:10.1016/S0378-7753(01)01029-1
[40] J. C. Amphlett, R. M. Baumert, R. F. Mann, B. A. Pep- pley and P. R. Roberge, “A Performance Model for PEM Fuel Cells,” Proceedings of the 28th Intersociety Energy Conversion Engineering Conference (IECEC-93), Vol. 1, Atlanta, 8-13 August 1993, pp. 1215-1220.
[41] J. C. Amphlett, R. M. Baumert, R. F. Mann, B. A. Pep- pley, P. R. Roberge and A. Rodrigues, “Parametric Mod- elling of the Performance of a 5 kW Proton-Exchange Membrane Fuel Cell Stack,” Journal of Power Sources, Vol. 49, No. 1-3, 1994, pp. 349-356.
doi:10.1016/0378-7753(93)01835-6
[42] J. C. Amphlett, R. F. Mann, B. A. Peppley, P. R. Roberge and A. Rodrigues, “A Practical PEM Fuel Cell Model for Simulating Vehicle Power Sources,” Proceedings of the
10th AnnualBattery Conference on Applications and Ad- vances, Long Beach, 10-13 January 1995, pp. 221-226. [43] J. C. Amphlett, R. F. Mann, B. A. Peppley, P. R. Roberge
and A. Rodrigues, “A Model Predicting Transient Re- sponses of Proton Exchange Membrane Fuel Cells,”
Journal of Power Sources, Vol. 61, No. 1-2, 1996, pp. 183-188. doi:10.1016/S0378-7753(96)02360-9
[44] J. C. Amphlett, E. H. de Oliveira, R. F. Mann, P. R. Roberge, A. Rodrigues and J. P. Salvador, “Dynamic In- teraction of a Proton Exchange Membrane Fuel Cell and a Lead-Acid Battery,” Journal of Power Sources, Vol. 65, No. 1-2, 1997, pp. 173-178.
doi:10.1016/S0378-7753(97)02472-5
[45] R. F. Mann, J. C. Amphlett, M. A. I. Hooper, H. M. Jen- sen, B. A. Peppley and P. R. Roberge, “Development and Application of a Generalised Steady-State Electrochemi- cal Model for a PEM Fuel Cell,” Journal of Power Sources, Vol. 86, No. 1-2, 2000, pp. 173-180.
doi:10.1016/S0378-7753(99)00484-X
[46] T. E. Springer, T. A. Zawodzinski and S. Gottesfeld, “Polymer Electrolyte Fuel Cell Model,” Journal of The Electrochemical Society, Vol. 138, No. 8, 1991, pp. 2334- 2342. doi:10.1149/1.2085971
[47] T. E. Springer, M. S. Wilson and S. Gottesfeld, “Model- ing and Experimental Diagnostics in Polymer Electrolyte Fuel Cells,” Journal of the Electrochemical Society, Vol. 140, No. 12, 1993, pp. 3513-3526.
doi:10.1149/1.2221120
Fuel-Cell Applications,” Solid State Ionics, Vol. 60, No. 1-3, 1993, pp. 199-211.
doi:10.1016/0167-2738(93)90295-E
[49] J. Kawamura, N. Kuwata, K. Hattori and J. Mizusaki, “Ionic Transport in Nano-Heterogeneous Structured Ma- terials,” Reports of the Institute of Fluid Science, Vol. 19, 2007, pp. 67-72.
[50] C. Yang, P. Costamagna, S. Srinivasan, J. Benziger and A. B. Bocarsly, “Water Uptake and Conductivity of Com- posite Membranes Operating at Reduced Relative Hu-
midity,” Journal of Power Sources, Vol. 103, No. 1, 2001, pp. 1-9. doi:10.1016/S0378-7753(01)00812-6
![Figure 1. Fuel cell power module in the power train for a hybrid fuel cell vehicle [32]](https://thumb-us.123doks.com/thumbv2/123dok_us/1585600.704845/3.595.308.540.554.709/figure-fuel-power-module-power-train-hybrid-vehicle.webp)
![Figure 2. Block diagram of the power module [34].](https://thumb-us.123doks.com/thumbv2/123dok_us/1585600.704845/4.595.310.543.508.686/figure-block-diagram-power-module.webp)
![Figure 10. The simulated I-V characteristics of PEMFC stack (composed of 4 cells in a series), with active area ge- ometry (A = 120 cm2), with different values of pressure gra- dient (anode/cathode), and at the humidification level [Lambda (λ) = 14)]](https://thumb-us.123doks.com/thumbv2/123dok_us/1585600.704845/8.595.73.277.328.546/figure-simulated-characteristics-composed-different-pressure-humidification-lambda.webp)