Munich Personal RePEc Archive
Is Bitcoin business income or speculative
bubble? Unconditional vs. conditional
frequency domain analysis
Bouoiyour, Jamal and Selmi, Refk and Tiwari, Aviral
CATT, University of Pau, France., ESC, Tunis Business School,
Tunisia., IFHE-IBS Hyderabad, India.
September 2014
Online at
https://mpra.ub.uni-muenchen.de/59595/
Is Bitcoin Business Income or Speculative Bubble?
Unconditional vs. Conditional frequency domain analysis
Jamal Bouoiyour
University of Pau, France.
[email protected]
Refk Selmi
Business School of Tunis, Tunisia.
[email protected]
Aviral Kumar Tiwari
IFHE-IBS Hyderabad, India.
[email protected]
Abstract:
The present study addresses one of the most problematic phenomena: Bitcoinprice. We explore the Granger causality for two relationships (Bitcoin price and transactions; Bitcoin price and investors’ attractiveness) from a frequency domain perspective using Breitung and Candelon’s (2006) approach. Intuitively, this research gauges empirically the causal links between these variables unconditionally on the one hand and conditionally to the Chinese stock market and the processing power of Bitcoin network on the other hand. The observed outcomes reveal some differences with respect to the frequencies involved, highlighting the complexity of assessing what Bitcoin looks like and the difficulty to gain clearer insights into this nascent crypto-currency. Beyond the nuances of short-, medium- and long-run frequencies, this paper confirms the extremely speculative nature of Bitcoin without neglecting its usefulness in economic reasons (trade transactions). The consideration of the Chinese market index and the hash rate has led to solid and unambiguous findings connecting further Bitcoin to speculation.
Keywords:
Bitcoin price; transactions; investors’ attractiveness; unconditional frequency1.
Introduction
Over the last years, various digital currencies have emerged including Litecoin, Auroracoin, Dogecoin and Bitcoin. The latter has attracted the most substantial number of users since its creation. From 2009, Bitcoin has succeeded to win an increasingly popularity in few times. Every passing day, the increase in the number of companies which accept Bitcoin is making the perceived value of this crypto-currency real. The excessive ups and downs of Bitcoin price have led finance professionals and many interviewees to suppose that it is a speculative trap more than future currency or business income.
It is therefore crucial to be cognizant that the nascent crypto-currency has many challenges still to overcome especially its excessive fluctuations. Even though Bitcoin has been frequently criticized as a risky investment, the extremely speculative nature of this virtual money needs a deeper assessment to reach better paths. To properly understand the main characteristics of Bitcoin well known by wide price swings and declines, this study seeks to address the following question: Is Bitcoin business income, log-term promise or “a speculative bubble”? While trying to effectively answer this question, none of the few papers on the issue (Yermack (2011), Buchholz et al. (2012), Kristoufek (2013, 2014), Ciaiain et al. (2014), Glaser et al. (2014)) have yet attempted to accurately assess short-, medium- and long-run interaction dynamic between Bitcoin and trade transactions on the one hand and this digital currency and investors’ attractiveness on the other hand. The present article focuses on analyzing the link between these variables more closely by carrying out the frequency domain Granger causality approach proposed by Breitung and Candelon (2006). This method may allow reaching insightful evidences because tests are performed for well-defined frequencies. It distinguishes between long-run trends, business cycles or short-run dynamics, which may have important implications especially for the case of new money. This technique effectively captures causal links between each two variables even if the interconnection between them is non-linear. This test seems not sensitive to the presence of “volatility clustering” (Bodart and Candelon, 2009), a common characteristic of financial variables.
highlight the substantial role of the Chinese market performance in explaining the causal interaction between Bitcoin and transactions on the one hand and the focal digital money and investors’ attractiveness on the other hand. We can also add other factor that may play a determinant role on the Bitcoin price dynamic as the processing power of Bitcoin network (Kristoufek, 2014).
Our main findings are summarized as follows: Bitcoin price (BPI) Granger-causes exchange-trade ratio (ETR) in the short- and the medium-run cyclical components (the medium and the long-run time scales). The reverse link is not verified. We also found that TTR Granger-cause BPI in the long-run frequencies (unconditional causality). This link changes when accounting for SI and HASH (conditional causality), i.e. TTR causes BPI at both lower (the long-run time scales) and higher frequencies (short-run time scales). The reverse causal relationship that runs from BPI to TTR seems visible in lower frequencies. These outcomes do not change when moving from unconditional to conditional causality. Beyond the nuances of short- and long-term frequencies, we clearly show that as well as its speculative nature, Bitcoin may be also used for economic reasons (particularly in trade transactions). The consideration of the Chinese market index and the hash rate has confirmed the above findings and has led thus to “one sided” outcomes connecting further Bitcoin price to users’ interest (speculation). Interestingly, nobody knows whether this crypto-currency will still or disappear. It is crucial to mention that the different obtained results highlight: (i) the complexity of assessing what does crypto-currency look like. It seems therefore highly difficult to Gain robust and unambiguous insights into Bitcoin Phenomenon; (ii) the need to account for additional variables that may have potential influence on the focal links. The conditional frequency domain analysis seems more parsimonious than unconditional standard Granger causality. Unsurprisingly, this approach accounts for the cyclical components conditioning upon other control variables that may play determinant role in explaining these causalities and then may help practitioners and investors in their decisions-making at well-defined frequency horizons and elucidate readers’ information.
2.
Brief literature survey
Bitcoin has attracted a substantial number of users since its creation. From 2009, Bitcoin has succeeded to win an increasingly popularity in few times. The global financial crisis has sustained the investors’ attractiveness towards this currency. However, the existing studies remain mainly interested to technical and legal issues (Grinberg (2011), Barber et al. (2012), Kroll et al. (2013), Moore and Christin (2013) and Bornholdt and Sneppen (2014)) compared to works focused on economic and financial aspects which appear very scarce (Buchholz et al. (2012), Ciaian et al. (2014), Kristoufek (2014) and Bouoiyour and Selmi (2014)).
The study of Palombizio and Morris (2012) relies on the possible impacts of global macroeconomic and financial development indicators on Bitcoin price formation. They show that oil price and exchange rate may be considered as main Bitcoin’s drivers, since they lead to cost pressures and provides a potential indicator of inflation development and thus impact positively Bitcoin price. Conversely, using VECM model, Ciaian et al. (2014) find that oil price has no influence on Bitcoin price, while the demand and supply play the most important role in explaining it. The last outcome is consistent with Buchholz et al. (2012). These latter add that the Bitcoin’ attractiveness of investors affects intensely the focal time series. This variable may detect the short-run speculative behavior of Bitcoin’users.
Kristoufek (2013) investigates the relationship between Bitcoin price and the users’interest measured through the search queries on Google Trends and Wikipedia. He shows a strong bidirectional causal relationship. More precisely, he finds that if Bitcoin prices increase, the investors’ attractiveness in response will grow. Obviously, people who buy Bitcoin today do so for speculative reasons (i.e. to win money). Few of them use this money to make purchases. Therefore, it is highly expected that when the prices increase, the attractiveness of people to Bitcoin increases simultaneously. The reverse link that runs from users’interest to Bitcoin price is also highly supported. This outcome may be explained by the fact that when businesses and investors deem that there are too risky markets including that of Bitcoin and as response seeks to secure their money by withdrawing from these uncertain markets, Bitcoin prices will decrease as a result.
network and exchange. They show that the motivation of investors to Bitcoin and their intention to gather proper and additional information about this virtual currency has a significant and substantial impact on the Bitcoin exchange volume, while this influence seems insignificant when considering the volume within the Bitcoin system. They attribute these findings to the fact that exchange users prefer usually to keep their Bitcoins in their exchange wallet to avoid possible speculative effects without any intention to use them in transaction goals or in paying goods or services.
context, Aguiar-Conraria and Soares (2011) and Bouoiyour et al. (2014) argue that the findings may change intensely when we move from wavelet investigation with two variables for conditional wavelet estimation (with more than two variables or by adding other explanatory time series). This highlights an insightful evidence that the use of large-scale parameters of each two variables as the case of Kristoufek (2014)’s study may prompt inconclusive results in terms of the interaction dynamic between Bitcoin price and its main drivers. This reinforces the need to further assessment of the focal link.
The contribution of the present study is to check the robustness of the above results using unconditional frequency causality and to find new insights by applying conditional causality through two main factors (Chinese market index and hash rate).
3.
Data and Methodology
3.1. Data
The main goal of this study is to measure the causalities between Bitcoin price and business transactions on the one hand and Bitcoin and investors’ attractiveness on the other hand unconditionally and conditioning on Chinese market performance and the hash rate (technical driver of Bitcoin). The variables under consideration are therefore as follows:
- Bitcoin price: Bitcoin is a nascent crypto-currency not yet substantially accepted as a payment system across wide markets. It is an alternative currency to the fiat currencies (the US dollar, the Euro) with several advantages such as low fees and informational transparency of all transactions and various drawbacks including the lack of legal security and the speculative behavior (Kristoufek, 2014). Bitcoin does not have an underlying value derived from consumption or production process such as the precious metals such as gold. Accordingly, Bouoiyour and Selmi (2014) show that there is any sign of Bitcoin being a “safe store”.
- Business transactions: Theoretically, the price of Bitcoin is positively associated to transactions, as it increases the utility of holding the currency leading to an increase in Bitcoin price. The exchange-trade ratio (ETR) is measured as a ratio between volumes on the currency exchange market and trade, and can be considered as measure of transactions (Kristoufek, 2014).
To measure the investors’ interest to Bitcoin, we can use daily Bitcoin views from Google1 as it allows us to capture the speculative of Bitcoin’ investors. More accurately, we use the number of times a key search word search term in relation to Bitcoin is entered into the Google engine. Several researches have employed Google search volume data as proxy of users’ attractiveness. Some of them have showed a great correlation between Google search and employment (Askitas and Zimmermann, 2009). Others have linked Google views to the consumption expenditures (Vosen and Schmidt, 2011), the housing prices (Kulkarni et al. 2009), the stock trading volume (Vlastakis and Markellos, 2010).
- Chinese market index:The Chinese market index is considered as a major player in explaining the evolution or the volatility of digital currencies and particularly the nascent crypto-currency (Bitcoin). Ciaian et al. (2014) discuss this viewpoint by depicting the sharp coincidence between some decreases and price increases in the Bitcoin exchange rate and the dramatic events that have undergone the Chinese market and the Chinese regulation problems. Arguably, Kristoufek (2014) takes an important example which is the development around Baidu that may be considered as a potential determinant of the Chinese online shopping. The announcement that Baidu is accepting bitcoins in October 2013 has affected significantly and positively the price dynamic of Bitcoin.
- Hash rate: The emergence of the famous virtual money has provided new approaches
concerning Bitcoin payments. Hence, some new words have emerged such as the hash rate. It may be considered as an indicator or measure of the processing power of the Bitcoin network. For security goal, Bitcoin network must make intensive mathematical operations, leading to an increase in the hash rate itself heavily connected with an increase in cost demands for hardware. This may affect widely Bitcoin purchasers and thus expands the demand of this new currency and in turn their prices. Theoretically, the hash rate is associated positively to Bitcoin price. According to Kristoufek (2014), an increase in Bitcoin price generates the intention of market participants to invest and to mine, which prompts a higher hash rate.
1 It corresponds to the frequency of Google searches (i.e. the online Google search queries) related to this new
The daily data of Bitcoin price index (BPI) is collected from Blockchain (https://blockchain.info/) has been used in our investigation, and the data for the exchange-trade ratio (ETR) and users ‘attractiveness to Bitcoin (TTR) is accessed from quandl (http://www.quandl.com/) and via daily Bitcoin views from Wikipedia, respectively. All the time series under consideration are converted to natural logarithms in order to smooth them. The long time range of our time series data (from December 2010 to June 2014) may help practitioners and investors to reach more information about the price evolution of this new crypto-currency and assess it accurately over time.
[image:10.595.96.499.451.734.2]Figure 1 depicts the evolution of BPI, ETR and TTR and the sharp correlation between them. The excessive swings of Bitcoin price have engaged the attention of Medias and researchers. This great attention to this nascent crypto-currency may be mainly attributed to the volatile behavior that heavily characterize Bitcoin price dynamic since its creation. Figure 1 confirms the sizeable volatility closely associated to this digital money. It was 1.14 dollars on 01/06/2011 and becomes more than 900 dollars on 11/01/2014. We can argue here that GARCH effects might be present in Bitcoin process evolution. Fortunately, frequency domain analysis is not sensitive to volatility clusters or the succession of tranquil and turbulent periods (Bodart and Candelon, 2009).
Figure 1. Bitcoin price, transactions and investors attractiveness
-3 -2 -1 0 1 2 3
IV I II III IV I II
2013 2014
BPI
-6 -4 -2 0 2 4
IV I II III IV I II
2013 2014
TTR
-3 -2 -1 0 1 2 3 4
IV I II III IV I II
2013 2014
ETR
-2 -1 0 1 2 3
IV I II III IV I II
2013 2014
SI
-3 -2 -1 0 1 2
IV I II III IV I II
2013 2014
HASH
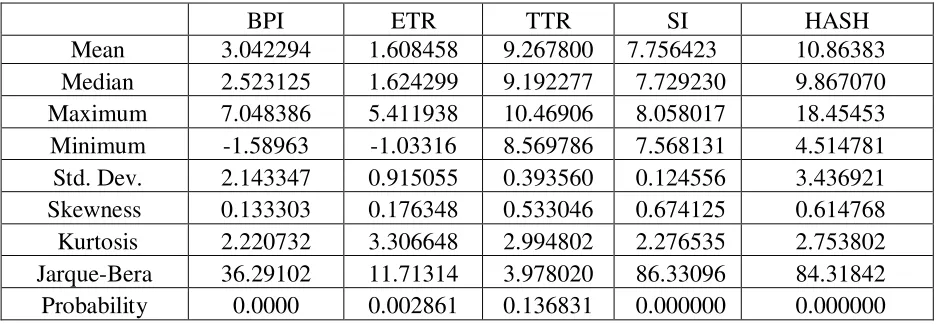
To investigate whether there is a short- or long-run causal relationship between Bitcoin price and transactions and between this digital money and investors ’attractiveness, we start by reporting the descriptive statistics (see Table 1) in order analyze the nature of data. We clearly show a substantial data variability, highlighting the very prime need to use robust models which may incorporate this nature of the data. The coefficient of kurtosis appears inferior to 3 for all the variables in question (except ETR), indicating that the distribution is less flattened than the normal distribution. The Skewness coefficient is positive for all the time series in question. This implies that the asymmetrical distribution is more plausible. The
[image:11.595.64.534.318.481.2]Jarque-Bera test revealed high and significant values (except for TTR), leading to reject the assumption of normality for the concerned variables.
Table 1. Summary of statistics
BPI ETR TTR SI HASH
Mean 3.042294 1.608458 9.267800 7.756423 10.86383
Median 2.523125 1.624299 9.192277 7.729230 9.867070
Maximum 7.048386 5.411938 10.46906 8.058017 18.45453
Minimum -1.58963 -1.03316 8.569786 7.568131 4.514781
Std. Dev. 2.143347 0.915055 0.393560 0.124556 3.436921
Skewness 0.133303 0.176348 0.533046 0.674125 0.614768
Kurtosis 2.220732 3.306648 2.994802 2.276535 2.753802
Jarque-Bera 36.29102 11.71314 3.978020 86.33096 84.31842
Probability 0.0000 0.002861 0.136831 0.000000 0.000000
3.2. Methodological framework
3.2.1. Unconditional versus conditional causality
Various researches have criticized the unconditional causality or more accurately the causality analysis between two series without accounting for other control variables that may have great influence on the studied linkage. When we take into account only two variables in the analysis, it will be difficult to capture solid findings with regard to the focal interaction dynamic since it may distort the estimate. This highlights the importance of deeper assessment of each causal relationship while considering the factors that may play a substantial role in explaining the dynamic of the studied nexus.
Considering X and Y the variables of interest and Z the conditional variable. Bi-variate
t i t i i t i i
t a X b Z
X 0
1 0 1
1 0
(3.1)t i t i i t i i
t a X bZ
Z 0
1 1 1
1 1
(3.2)
where 0t and 0tare independent and identically distributed with zero mean and variance-covariance matrix written as follows:
0 0 0 0 , , 1 à (3.3) t i t i i t i it c Y d Z
Y 0
1 0 1
1 0
(3.4) t i t i i t i it cY d Z
Z 1
1 1 1
1 1
(3.5)
where v0t and 1tare independent and identically distributed with zero mean and variance-covariance matrix written as follows:
1 0 1 1 0 , , 2 à (3.6)Then, we can explore the link that runs from X to Y and inversely by accounting for
the conditional variable by estimating trivariate equations expressed as follows:
t i t i i i t i t i i
t X Y Z
X
1 1 1
1
1 1 1(3.7) t i t i i t i i i t i i
t X Y Z
Y 1
1 2 1
1 2
1 2
(3.8) t i t i i t i i i t i it X Y Z
Z 1
1 3 1
1 "
1 3
(3.9)
1 1 1 1 1
1 1 1 1 1
1 1 1 1 1
, ,
, ,
, , 3
(3.10)
The causalities between X and Y conditionally to Z are measured based on Geweke
(1984)’s study by:
1 0 / ln
Z
Y X
F
(3.11)
And
1 0 / ln
Z
X Y
F
(3.12)
The effect of the additional control variables (i.e. the conditional variable) on the relationship between X and Y may be detected properly from the above equations (3.11) and
(3.12). If Z has no influence on the focal linkage (i.e. there is no remarkable changes in the
relationship in question), this means that
0
1and
0
1and therefore FYX/ZandZ Y X
F / are insignificant. However, if the conditional variables under consideration lead to a
modification (either slightly or heavily) on the studied relationships, this implies that FYX/Z
and FXY/Zare significant.
Both conditional and conditional causalities are estimated within frequency domain framework. This technique is well explained throughout the rest of this section.
3.2.2. Frequency domain approach
point of this last testing procedure is the Granger causality test. “A variable Yt is said to
Granger cause Xt, if Yt contains information to predict Xt that is not available otherwise”
(Lütkepohl 2005, pp.41). Obviously, this technique is restrictive since it cannot capture the studied links at different paths. It can be written as matrix notation as following:
t t t t t Y X L L L L Y X L ) ( ) ( ) ( ) ( ) ( 22 21 12 11 (3.13)
Yt does not Granger cause Xt if (12(L)0), indicating that the past values of Yt seem
not closely related to Xt. This can be tested by using an F-Test for the coefficients 12,i for
i = 1… p. To overcome the Granger (1969)’s test restrictions, we choose to apply frequency-domain Granger causality as a decomposition of the total spectral interdependence between each macroeconomic variables into a sum of instantaneous and bidirectional causality terms (Tiwari et al. 2014). Geweke (1982) put in evidence that the causality test can be performed under different frequencies without loss of explanatory power, implying that causality measure (FYX) can be decomposed as follows:
d f
FY X Y X( )
0
(3.14)
Or with a consideration of conditional variable, meaning that causality measure
(FYX) can be decomposed as follows:
d f
FY X Z Y X Z( )
0 / /
(3.15)
Various tests have been proposed to analyze the frequency domain nexus between two variables (Geweke (1982), Breitung and Candelon (2006) and Lemmens et al. 2008). In the present research, we refer to Breitung and Candelon’s (2006) study. They construct an F-test for the coefficients(L)at different frequencies to overcome the gaps of standard Granger
causality test. More precisely, to measure the causality under different frequencies, the above bivaritate and trivariate equations should be re-written as following (matrix form):
where11(0)1;221;120;210;cov(1t,2t)0;
( )
1G L
t ; G denotes the lower
triangular matrix of the Cholesky decomposition;tGt .
t t t t t t t Z Y X L L L L L L L L L L 3 2 1 33 32 31 13 22 21 13 12 11 ) ( ) ( ) ( ) ( ) ( ) ( ) ( ) ( ) ( ) (
(3.17)
where11(0)1;221;331;120;210;130;310;230;320;
( )
1G L
t ; G denotes the
lower triangular matrix of the Cholesky decomposition.
Ultimately, the null hypothesis of no Granger Causality at frequency ω can be written basedon matrix notations (3.16) and (3.17) respectively as follows:
0 ) ( ) ( :
0 R L
H (3.18)
0 ) ( ) ( :
0 R L
H (3.19)
where
) sin( )... 2 sin( ) sin( ) cos( )... 2 cos( ) cos( ) ( p p R
4.
Main findings and discussion
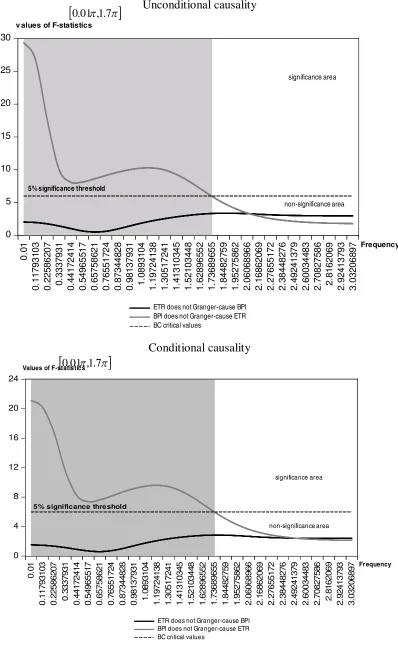
The main objective of this study is to investigate the main causes of Bitcoin price dynamic under different frequencies (the short, medium and long terms). Firstly, a bi-variate model is estimated for the nexus between exchange-trade ratio and Bitcoin to address whether Bitcoin behaves as business income (Figure 2). Secondly, the model is performed to explore the link between investors ’attractiveness and Bitcoin price (Figure 3) to find whether this new virtual currency is likely to be a “speculative bubble” rather than business transactions tool. These tests are performed within unconditional and conditional causality frameworks. The control or the conditional variables added here are the Chinese stock market index as proxy of Chinese market performance and the hash rate as indicator of Bitcoin technical difficulty.
4.1. The lead-lag relationship between exchange-trade ratio and Bitcoin
Figure 2 disentangles the short and long terms business cycle causality among two variables of interest (transactions proxied by the exchange-trade ratio and Bitcoin price). Our results clearly reveal that both time series Granger-cause each other at different frequency horizons. The frequencies range from 0 to 2 may be translated into periodicities of T days by
/ 2
T . More accurately, we show that Bitcoin price (BPI) Granger-causes exchange-trade
ratio (ETR) in the short- and the medium-run cyclical components particularly in the frequency range of 0.01 to 1.73, indicating the business cycle of 3.7 to 628.3 days. A potential explanation for this finding is the substantial role that plays the level of price in explaining exchange and trade transactions. The usage of this new crypto-currency in trade transactions and the evolution of Bitcoin prices may be emerged due to speculative attacks. It is highly expected that the greater is the number of the coins used the stronger the demand for them and the higher will be the prices. Nevertheless, if Bitcoin prices are driven by speculation, the uncertainty about the price may lead to unexpected nexus. Admittedly, the increase of prices prompts a drop in demand for the currency at exchanges. When price closely linked to one currency decreases with respect to the price of other one, the first currency will appreciate and exchange rate will increase. This implies that there is a causality running from the price to exchange rate2, affecting then trade transactions especially in extreme price periods. In addition, the null hypothesis of no Granger causality that runs from ETR to BPI is not rejected at any frequency. This result is inconsistent with Kristoufek (2014) providing evidence that
2
the increasing use of Bitcoin in ETR expands Bitcoin in the long-run and then there is a significant link that runs from ETR to BPI, which becomes stronger in the long term. But, this author adds that, this nexus changes substantially among frequency horizons to give us any solid and unambiguous conclusion. This goes without saying that these results should be treated with caution.
Figure 2. Frequency domain analysis of the link between transactions and Bitcoin price Unconditional causality 0 5 10 15 20 25 30 0 .0 1 0 .1 1 7 9 3 1 0 3 0 .2 2 5 8 6 2 0 7 0 .3 3 3 7 9 3 1 0 .4 4 1 7 2 4 1 4 0 .5 4 9 6 5 5 1 7 0 .6 5 7 5 8 6 2 1 0 .7 6 5 5 1 7 2 4 0 .8 7 3 4 4 8 2 8 0 .9 8 1 3 7 9 3 1 1 .0 8 9 3 1 0 4 1 .1 9 7 2 4 1 3 8 1 .3 0 5 1 7 2 4 1 1 .4 1 3 1 0 3 4 5 1 .5 2 1 0 3 4 4 8 1 .6 2 8 9 6 5 5 2 1 .7 3 6 8 9 6 5 5 1 .8 4 4 8 2 7 5 9 1 .9 5 2 7 5 8 6 2 2 .0 6 0 6 8 9 6 6 2 .1 6 8 6 2 0 6 9 2 .2 7 6 5 5 1 7 2 2 .3 8 4 4 8 2 7 6 2 .4 9 2 4 1 3 7 9 2 .6 0 0 3 4 4 8 3 2 .7 0 8 2 7 5 8 6 2 .8 1 6 2 0 6 9 2 .9 2 4 1 3 7 9 3 3 .0 3 2 0 6 8 9 7
ETR does not Granger-cause BPI BPI does not Granger-cause ETR BC critical values
significance area
non-significance area
5% significance threshold v alues of F-statistics
Frequency Conditional causality 0 4 8 12 16 20 24 0 .0 1 0 .1 1 7 9 3 1 0 3 0 .2 2 5 8 6 2 0 7 0 .3 3 3 7 9 3 1 0 .4 4 1 7 2 4 1 4 0 .5 4 9 6 5 5 1 7 0 .6 5 7 5 8 6 2 1 0 .7 6 5 5 1 7 2 4 0 .8 7 3 4 4 8 2 8 0 .9 8 1 3 7 9 3 1 1 .0 8 9 3 1 0 4 1 .1 9 7 2 4 1 3 8 1 .3 0 5 1 7 2 4 1 1 .4 1 3 1 0 3 4 5 1 .5 2 1 0 3 4 4 8 1 .6 2 8 9 6 5 5 2 1 .7 3 6 8 9 6 5 5 1 .8 4 4 8 2 7 5 9 1 .9 5 2 7 5 8 6 2 2 .0 6 0 6 8 9 6 6 2 .1 6 8 6 2 0 6 9 2 .2 7 6 5 5 1 7 2 2 .3 8 4 4 8 2 7 6 2 .4 9 2 4 1 3 7 9 2 .6 0 0 3 4 4 8 3 2 .7 0 8 2 7 5 8 6 2 .8 1 6 2 0 6 9 2 .9 2 4 1 3 7 9 3 3 .0 3 2 0 6 8 9 7
ETR does not Granger-cause BPI BPI does not Granger-cause ETR BC critical values
significance area
non-significance area 5% significance threshold
Values of F-statistics
Frequency
Notes: BPI and ETR denote respectively Bitcoin price index and exchange-trade ratio; Frequency (ω) = 2π/cycle length (T); the dark gray shaded area corresponds to the significance area of the null hypothesis (BPI does not Granger cause ETR).
0.01,1.7
4.2. The lead-lag relationship between investors’ attractiveness and Bitcoin
Figure 3 depicts the nexus between investors-attractiveness to the focal crypto-currency and Bitcoin price. It’s worthy to notice that TTR Granger-cause BPI in the medium- and the long-run.TTR Granger-causes BPI at higher frequencies (Graph 1, Figure 3) or more precisely when
2.23.0
. This finding appears logical since it seems obvious that if thenumber of persons interested in BPI will increase gradually, the Bitcoin prices will as response increase. The great media attention to this new digital money substantially pushes bitcoin to an all-time increase. Similar dynamic is worthy notable when Zynga3 and Overstock4 begin accepting Bitcoin from January 2014.
Besides, the reverse causal relationship that runs from BPI to TTR seems visible in lower frequencies (the long-run time scales) or accurately when
0.010.1
. One of themost substantial possible explanations of this last outcome is that people who buy Bitcoin today do so for speculative reasons (i.e. to win money). Few ones use Bitcoin to make purchases (real economy). So, we should expect that when the price increases, the TTR increases considerably. For instance, the first quarter of 2013 was marked by an extreme bubble when Bitcoin price increases intensely, moving from $13 to above $200. Bitcoin users believe that they will be able to easily reach a lot of money, in particular when prices hit a record high of 900 dollars for instance in 11/01/2014.
These outcomes change remarkably when considering HASH and SI. More precisely, we find that the causal relationship running from BPI to TTR becomes insignificant, while the reverse interaction dynamic that runs from TTR to BPI changes among the different
frequencies involved. It appears significant when
0.010.2
2.43.0
. A greatconnection is therefore sharply observed at the nascent stages and under the bubble-building up periods after hitting high price levels. This implies that the Chinese market and the Bitcoin technology play determinant roles in explaining these causalities. Unsurprisingly, the Chinese market has experienced several events that coincide with great changes in Bitcoin prices. For example, the announcement that Baidu is accepting Bitcoins has impacted significantly the behavior of businesses and users in general, affecting then positively the Bitcoin prices. Unfortunately, investors deem that these markets are too risky and seek to secure their money
3
Zynga is a recent company of social games, founded in 2007 in California. It works specifically on mobile phone platforms such as AppleiOS and Android.
4
by withdrawing from these uncertain markets, especially when darken events occur such as the great observable drop in Bitcoin after the closing of the trading platform aimed at Chinese investors after the Central Bank clampdown5, touching a record low of 120 dollars. These events and uncertainties obviously generate the volatility. Furthermore, the fact that Bitcoin’ users invest into the hardware may prompt an increase in the hash rate and in higher technical difficulty. This obviously will increase the inability of Bitcoin to offset the computational power costs, expanding as response the speculative behavior of investors. More precisely, several investors have hardly acknowledged about mathematical programs, and hence it is unknown for them how far it can go. This uncertainty creates therefore unpleasantly a great speculation.
Summing up, we have verified the speculative nature of Bitcoin, which is already obvious. We have showed also that Bitcoin may be used for economic reasons. Nevertheless, these outcomes appear counter-intuitive since it is well expected that speculation causes Bitcoin in short- and medium-run, while the usage of Bitcoin in trade transactions is likely to be observed in the long term. More importantly, nobody accurately knows the future of this nascent money, i.e. if it is risky investment or long-term promise. It seems uncertain; it can remain as it can disappear. In our case of study and as mentioned above, we have found unexpected results, highlighting the complexity of assessing what does crypto-currency look like. It seems therefore highly difficult to Gain clearer insights into Bitcoin Phenomenon.
5 It is important to mention here that China's biggest bank (ICBC) and 10 other banks have intensely banned
Figure 3.Frequency domain analysis of the link between attractiveness and Bitcoin price Unconditional causality 0 1 2 3 4 5 6 7 8 0 .0 1 0 .1 1 7 9 3 1 0 3 0 .2 2 5 8 6 2 0 7 0 .3 3 3 7 9 3 1 0 .4 4 1 7 2 4 1 4 0 .5 4 9 6 5 5 1 7 0 .6 5 7 5 8 6 2 1 0 .7 6 5 5 1 7 2 4 0 .8 7 3 4 4 8 2 8 0 .9 8 1 3 7 9 3 1 1 .0 8 9 3 1 0 4 1 .1 9 7 2 4 1 3 8 1 .3 0 5 1 7 2 4 1 1 .4 1 3 1 0 3 4 5 1 .5 2 1 0 3 4 4 8 1 .6 2 8 9 6 5 5 2 1 .7 3 6 8 9 6 5 5 1 .8 4 4 8 2 7 5 9 1 .9 5 2 7 5 8 6 2 2 .0 6 0 6 8 9 6 6 2 .1 6 8 6 2 0 6 9 2 .2 7 6 5 5 1 7 2 2 .3 8 4 8 2 7 6 2 .4 9 2 4 1 3 7 9 2 .6 0 0 3 4 4 8 3 2 .7 0 8 2 7 5 8 6 2 .8 1 6 2 0 6 9 2 .9 2 4 1 3 7 9 3 3 .0 3 2 0 6 8 9 7
TTR does not Granger-cause BPI BPI does not Granger-cause TTR BC critical values
significance area
no-significance area
5% significance threshold Values of F-statistics
Frequency Conditional causality 0 1 2 3 4 5 6 7 0 .0 1 0 .1 1 7 9 9 3 1 0 3 0 .2 2 5 8 6 2 0 7 0 .3 3 3 7 9 3 1 0 .4 4 1 7 2 4 1 4 0 .5 4 9 6 5 5 1 7 0 .6 5 7 5 8 6 2 1 0 .7 6 5 5 1 7 2 4 0 .8 7 3 4 4 8 2 8 0 .9 8 1 3 7 9 3 1 1 .0 8 9 3 1 0 4 1 .1 9 7 2 4 1 3 8 1 .3 0 5 1 7 2 4 1 1 .4 1 3 1 0 3 4 5 1 .5 2 1 0 3 4 4 8 1 .6 2 8 9 6 5 5 2 1 .7 3 6 8 9 6 5 5 1 .8 4 4 8 2 7 5 9 1 .9 5 2 7 5 8 6 2 2 .0 6 0 6 8 9 6 6 2 .1 6 8 6 2 0 6 9 2 .2 7 6 5 5 1 7 2 2 .3 8 4 4 8 2 7 6 2 .4 9 2 4 1 3 7 9 2 .6 0 0 3 4 4 8 3 2 .7 0 8 2 7 5 8 6 2 .8 1 6 2 0 6 9 2 .9 2 4 1 3 7 9 3 3 .0 3 2 0 6 8 9 7
TTR does not Granger-cause BPI BPI does not Granger-causeTTR BC critical values
significance area
5% significance threshold
non-significance area
Values of F-statistics
Frequency
Notes: BPI and TTR denote respectively Bitcoin price and investors ‘attractiveness; Frequency (ω) = 2π/cycle length (T); the light gray shaded area corresponds to the significance area of the null hypothesis (TTR does not Granger cause BPI); the dark gray shaded area corresponds to the significance area of the null hypothesis (BPI does not Granger cause TTR).
0.01,0.1
2.2,3.0
5.
Conclusions and policy implications
Due to the growing acceptance of Bitcoin as a nascent digital currency and as a new payment tool, users need to better understand this phenomenon. The present research tries to see whether Bitcoin seems a good driver of business transactions, a future promise or a “speculative bubble”. This study contributes to the existing literature on the field by assessing the lead-lag relationship between Bitcoin price and exchange-trade ratio on the one hand and BPI and investors’ attractiveness on the other hand, conditionally to the performance of Chinese market and the processing power of Bitcoin network. To this end, we decompose the causal connections between these variables into different frequency components by applying Breitung and Candelon’s (2006) method using daily data covering the period from December 2010 to June 2014. Our findings provide insightful evidences that may have important policy implications.
The aforementioned causality results appear far from stable and unambiguous.
Bitcoin price Granger-causes exchange-trade ratio in lower and medium frequencies. We do not support the reverse nexus. There is any change in the obtained results when moving from unconditional to conditional causality. Besides, the investors’ attractiveness Granger-cause Bitcoin price at higher frequencies. This link changes substantially when considering the Shangai index (proxy of the performance of Chinese market) and the hash rate. When applying conditional causality test, we provide evidence that TTR causes BPI at short- and long-run frequencies, while the reverse link running from BPI to TTR is clearly observed at lower frequencies. These results are unexpected. Normally, the speculation should cause Bitcoin in short- and medium-run, while the Bitcoin price may be used in economic reasons including business transactions in the long term. At any case, nobody have up to now any clear idea about the predictive content of Bitcoin, acknowledging the complexity of assessing what does crypto-currency look like (Bouoiyour and Selmi (2014) and Bouoiyour et al. (2014)).
of Bitcoin price dynamic in general and the causal relationships (BPI and ETR) and (BPI and TTR) in particular. The conditional frequency domain analysis appears fruitful and valuable to reach better paths since it allows us to explore the focal links over time and under different frequencies conditioning upon additional variables that may drive significantly the obtained results and then may improve substantially the decisions-making by businesses and practitioners.
The originality of this research can be viewed on the nature of link between (BTP and ETR) and (BTP and TTR), which appear bidirectional and conditional on other control variables including SI and HASH (only for the linkage between Bitcoin price and investors ’attractiveness). We can also conclude that beyond the speculative behavior. So, should businesses and investors have confidence in a currency that wins or loses more the half of its value in very few days?
Since its creation, Bitcoin has attracted a huge number of users due to its lower transactions fees and deflationary bias6. Unfortunately, the excessive volatility of Bitcoin and the rampant hacking attacks are likely to discourage users of this digital money. Even though Bitcoin’s dependency to computer algorithms, the majority of users has very little experience in mathematical programs, and hence it is unknown for them how far it can go. This structural problem may create uncertainty and then speculation, which may be aggravated by the absence of effective financial tools such as forward contracts and swaps that are routinely used to prevent external shocks for official currencies and to properly manage the risk arising from the great volatile behavior of Bitcoin.
In a nutshell, to be bidirectional and conditional on Chinese stock market and the hash rate clearly indicates that the linkage between Bitcoin price and investors’ attractiveness is more complex than it may appears. Unsurprisingly, this relationship is dominant by speculation aspect and the road seems therefore long, winding and frightening before shoring up fully confidence in this new crypto-currency.
6
References
Aguiar-Conraria, L. & Soares, M-J. (2011) The continuous wavelet transform: A primer. NIPE working paper n°16, University of Minho.
Askitas, N., Zimmermann, K. & Klaus F. (2009) Google econometrics and unemployment forecasting. Applied Economics Quarterly 55, 107–120.
Barber, S., Boyen, X., Shi, E. & Uzun, E. (2012) Bitter to Better-How to Make Bitcoin a Better Currency. In A.D. Keromytis (ed.), Financial Cryptography and Data Security. Vol.
7397 of Lecture Notes in Computer Science, 399-414, Berlin/Heidelberg: Springer.
Bodart, V. & Candelon, B., (2009) Evidence of interdependence and contagion using a frequency domain framework. Emerging Markets Review, 10 (2), 140-150.
Bornholdt, S. and Sneppen, K. (2014) Do Bitcoins make the world go around? On the dynamics of competing crypto-currencies.
https://www.researchgate.net/publication/261100860_Do_Bitcoins_make_the_world_go_rou nd_On_the_dynamics_of_competing_crypto-currencies
Bouoiyour, J. & Selmi, R. (2014) What Bitcoin looks like? Gaining insight into Bitcoin Phenomenon, working paper CATT, University of Pau.
Bouoiyour, J., Selmi, R., Tiwari, A-K. & Olayeni, O-R., (2014) Measuring Bitcoin Price: Multiscale Analysis via Empirical Mode Decomposition, working paper CATT,
University of Pau.
Breitung, J., & Candelon, B. (2006) Testing for short and long-run causality: a frequency domain approach. Journal of Econometrics 132, 363-378.
Buchholz, M., Delaney, J., Warren, J. & Parker, J. (2012) Bits and Bets, Information, Price Volatility, and Demand for Bitcoin. http://www.bitcointrading.com/pdf/bitsandbets.pdf
Ciaian, P., Rajcaniova, M. & Kancs, D. (2014) The Economics of BitCoin Price Formation. http://arxiv.org/ftp/arxiv/papers/1405/1405.4498.pdf
Geweke, J. (1982) Measurement of linear dependence and feedback between multiple time series. Journal of American Statistical Association, 77, 304-324.
Geweke, J. (1984) Inference and causality in economic time series models. Handbook
of Econometrics, in: Griliches, Z. andIntriligator, M.D. (ed.), Handbook of Econometrics,
edition 1, 2, chapter 19, 1101-1144.
Glaster, F., Kai, Z., Haferkorn, M., Weber, M. & Sieiring, M. (2014) Bitcoin - asset or currency? Revealing users’hidden intentions. Twenty Second European Conference on
Granger, C.W.J. (1969) Investigation causal relations by econometric models and cross-spectral methods. Econometrica, 37, 424-438.
Grinberg, R. (2011) BitCoin: An Innovative Alternative Digital Currency. Hastings
Science & Technology Law Journal, 4, 159-208.
Kristoufek, L. (2013), BitCoin meets Google Trends and Wikipedia: Quantifying the relationship between phenomena of the Internet era. Scientific Reports, 3 (3415), 1-7.
Kristoufek, L. (2014) What are the main drivers of the Bitcoin price? Evidence from wavelet coherence analysis. http://arxiv.org/pdf/1406.0268.pdf
Kroll, J., Davey, I. & Felten, E. (2013) The Economics of Bitcoin Mining, or Bitcoin in the Presence of Adversaries.
http://weis2013.econinfosec.org/papers/KrollDaveyFeltenWEIS2013.pdf
Kulkarni, R., Haynes, K., Stough, R. & Paelinck, J.H.P., (2009) Forecasting housing prices with Google econometrics. Unpublished working paper.
Lemmens, A., Croux, C. & Dekimpe, M.G. (2008) Measuring and Testing Granger causality over the spectrum: An Application to European Production Expectation Surveys.
International Journal of Forecasting, 24, 414-431.
Moore, T. & Chitristin, N. (2013) Beware the Middleman: Empirical Analysis of Bitcoin-Exchange Risk. Financial Cryptography and Data Security, 7859, 25-33.
Ng, E.K. & Chan, J.C. (2012) Geophysical Applications of Partial Wavelet Coherence and Multiple Wavelet Coherence. American Meteological Society, December.
DOI: 10.1175/JTECH-D-12-00056.1
Palombizio E. and Morris, I. (2012) Forecasting Exchange Rates using Leading Economic Indicators. Open Access Scientific Reports,1 (8), 1-6.
Piskorec, P., Antulov-Fantulin, N., Novak, P.K., Mozetic, I., Grcar, M., Vodenska, I. & Šmuc, T. (2014) News Cohesiveness: an Indicator of Systemic Risk in Financial Markets. http://arxiv.org/pdf/1402.3483v1.pdf
Tiwari, A.K., Arouri, M. & Teulon, F. (2014) Oil prices and trade balance: A frequency domain analysis for India. Economics Bulletin, 34(2), 663-680.
Vlastakis, Nikolaos, Markellos & Raphael N., (2010) Information demand and stock market volatility. Journal of Banking and Finance, 36 (6), 1808-1821.
Vosen, S. & Schmidt, T. (2011) Forecasting private consumption: survey-based indicators vs. Google Trends. Journal of Forecasting 30, 565–578.
Yermack, D. (2011) Is Bitcoin a Real Currency? An economic appraisal. NBER