S Bandyopadhyay, D S Sharma and R Sangal. Proc. of the 14th Intl. Conference on Natural Language Processing, pages 476–484, Kolkata, India. December 2017. c2016 NLP Association of India (NLPAI)
Predicting User Competence from Linguistic Data
Yonas Demeke Woldemariam
Dep. Computing Science Umeå University
Sweden
Suna Bensch
Dep. Computing Science Umeå University
Sweden [email protected]
Henrik Björklund
Dep. Computing Science Umeå University
Sweden
Abstract
We investigate the problem of predicting the competence of users of the crowd-sourcing platform Zooniverse by analyz-ing their chat texts. Zooniverse is an online platform where objects of differ-ent types are displayed to volunteer users to classify. Our research focuses on the Zoonivers Galaxy Zoo project, where users classify the images of galaxies and discuss their classifications in text. We ap-ply natural language processing methods to extract linguistic features including syn-tactic categories, bag-of-words, and punc-tuation marks. We trained three supervised machine-learning classifiers on the result-ing dataset: k-nearest neighbors, decision
trees (with gradient boosting) and naive Bayes. They are evaluated (regarding ac-curacy and F-measure) with two different but related domain datasets. The perfor-mance of the classifiers varies across the feature set configurations designed during the training phase. A challenging part of this research is to compute the com-petence of the users without ground truth data available. We implemented a tool that estimates the proficiency of users and an-notates their text with computed compe-tence. Our evaluation results show that the trained classifier models give results that are significantly better than chance and can be deployed for other crowd-sourcing projects as well.
1 Introduction
The science crowd sourcing platform Zooniverse hosts a large number of different projects where volunteers/users (in this paper, the term “volun-teer” is used interchangeably with “user”) help
sci-entists by classifying various kinds of data. In or-der to make the experience as positive as possible for the volunteers, so that they are more likely to stay on and contribute to the projects, the Zooni-verse team is very interested in anything that can help them understand their volunteers better.
In this article, we explore how much the text comments left by volunteers in the chat rooms ac-companying the project Galaxy Zoo can help us in determining their level of proficiency or com-petence in classifying images. Proficiency is only one among many interesting qualities, and the text data is only one tool for measuring it. The output from the machine learning algorithms we use can be combined with other measures to learn more about user proficiency. Here, though, we focus on the following main question: Does the linguis-tic data from the chats contain useful information about the volunteers, in particular about the qual-ity of their classifications?
The reason for focusing on Galaxy Zoo, rather than one of the many other projects run by Zooni-verse, is that it is one of the oldest and largest projects, which means that there is quite a lot of data available – many users, many classifications, many text comments.
There are several challenges that have to be ad-dressed when trying to answer our question. The hardest one is how to measure the quality of users’ classifications. The problem is that there is no ground truth data available. For most of the galaxy photos that volunteers have classified, we do not know the correct answer. No expert in the field has studied and classified them, since the whole point of using volunteers is that the experts do not have the time to do so.
detail and provide some justification for it in Sec-tion 3.
Once a quality measure for each user that has also provided sufficiently many textual comments has been computed, we employ three different ma-chine learning algorithms to the data in order to see whether the values can be predicted from text. Each algorithm is tested on six different sets of features of the textual data. The algorithms we use arek-Nearest Neighbors, Naive Bayesian
Classi-fication, and Decision Trees (with gradient boost-ing).
The results achieved are not spectacular, but they show that analysis of the textual data gives a significantly better than chance prediction of the quality of a users classifications. As mention above, this can be combined with other measures to get better predictions.
To investigate how well our methods generalize to other settings we also test them on data from the Zooniverse Snapshot Serengeti project. The results are encouraging in that they are comparable to the results for Galaxy Zoo.
We discuss related work in Section 2, the cal-culation of majority votes in Section 3, the experi-mental setup in Section 4, the experiexperi-mental results in Section 5 and, finally, the discussion in Sec-tion 6.
2 Related work
In the literature a users’ competence refers to var-ious kinds of competence. Automated essay scor-ing, for instance, assesses an author’s writing com-petence or capabilities by analyzing the author’s text. An author’s competence can also refer to competence or expertise in a specific topic that he/she demonstrates by, for example, his/her writ-ten argumentation in a chat discussing the topic. An author’s competence can also be related to the author’s competence in performing a specific task (e.g. classifying galaxy images) and the au-thor’s written text about the task performance can be used to investigate whether there exist correla-tions. We are interested in the correlation between an author’s task performance competence (i.e. cor-rect classification of galaxy images) and his/her chat entries, where the text in the chat entries is not necessarily about the task at hand.
Researchers have intensively investigated meth-ods for automated essay scoring by statistical anal-ysis of linguistic features extracted from text.
Au-tomated essay scoring is the process of automat-ically analyzing text and grading it according to some predefined evaluation criteria. In McNamara et al. (2008), for instance, the authors investigate to what degree high- and low-proficiency essays can be predicted by linguistic features including syntactic complexity (e.g. number of words before the main verb). Their results indicate that high-proficiency writers use a more complex syntax in terms of the mean number of higher level con-stituents per word and the number of words before the main verb, than low-proficiency writers. In addition, the results indicate that high-proficiency writers use words that occur less frequently in lan-guage. Chen and He (2013) improve automated essay scoring by incorporating the agreement be-tween human and machine raters. The feature set to indicate essay quality includes lexical, syntac-tic, and fluency features. The syntactic features include sentence length, the mean number of sub-clauses in each sentence, the sum of the depth of all nodes in a parse tree as well as the height of the parse tree. In Pérez et al. (2005), students’ essays are assessed by combining an algorithm that in-cludes syntactic analysis and latent semantic anal-ysis.
Linguistic features in written text (e.g. chat) have also been used to predict how competent the authors are with respect to learning and un-derstanding discussed chat topics. Dascalu et al. (2014), for instance, assess the competences of chat participants. To this end, they consider the number of characters written by a chat user, speech acts, keywords and the topics. In addi-tion, social factors are taken into account. The au-thors generate a social network graph that repre-sents participants’ behaviors and participants can be characterized as knowledgeable, gregarious or passive. The social network is used to compute metrics such as closeness, graph centrality, be-tweenness, stress, and eigenvector.
(2008) a term-based approach is used to investi-gate the user and message attributes in the context of vocabulary use and a style-based approach is used to investigate the chat messages according to the variations in the authors’ writing styles.
Another kind of author-specific attribute is the self-confidence of an author. In Fu et al. (2017) the authors investigate how confidence and com-petence of discussion participants effect the dy-namics and outcomes of group discussions. The results show that more confident participants have a larger impact on the group’s decision and that the language they use is more predictive of their con-fidence level than of their competence level. The authors use bag of words, number of introduced ideas, use of hedges (i.e. expressions of uncer-tainty or lack of commitment) and expressions of agreement as indicators for confidence.
Berry and Broadbent (1984) investigate the re-lationship between task performance and the ex-plicit and reportable knowledge about the task per-formance (i.e. concurrent verbalization). The re-sults indicate that practice significantly improves task performance but has no effect on the ability to answer related questions. Verbal instructions of how to do the task significantly improves the ability to answer questions but has no effect on task performance. Verbal instructions combined with concurrent verbalization does lead to a signif-icant improvement in task performance, whereas verbalization alone has no effect on task perfor-mance or question answering. The authors Berry and Broadbent (1984) use statistical comparisons of questionnaires.
In Chen et al. (2014), the authors use ma-chine learning techniques (e.g. logistic regression, SVM) to assesss medical students’ competencies in six geriatric competency domains (i.e. medica-tion management, cognitive and behavioral disor-ders, falls, self-care capacity, palliative care, hos-pital care for elders). The medical students’ clini-cal notes are analyzed and the used linguistic fea-tures include bag of words, concepts, negation and semantic type. The authors also use non-linguistic features such as the number of clinical notes for the competence assessment.
3 Computing majority votes
Schwamb et al. (2005) assess how competently a volunteer can identify planetary transits in images.
This is done within the Planet Hunter project1 which is a crowd sourcing project for which volun-teers classify planet images. A decision tree helps volunteers in identifying light curves in the im-ages and the volunteers then mark transit features visible in the light curve which results in a so-called transit box. The classifications are stored in a database and for each entry question in the deci-sion tree, the time stamp, user identification, light curve identifier, and response are stored. In addi-tion, the position of the transit box center, its width and height are stored. As a gold standard synthetic transit light curves are used (i.e. labelled images) where these synthetic transits are mixed into the images that are not labelled for the volunteers to classify. In order to identify the most competent volunteers a weight is assigned based on their ten-dency to agree with the majority opinion and in case they classified synthetic light curves on their performance of identifying transit events. The user weights’ are assigned in two stages. First, all users start out equal and then the results of identifying the synthetic light curves are used to obtain an initial weighting. For every synthetic light curve and volunteer classifier it is evaluated how well the user identified the transit events. If a volun-teer identified transits correctly her weight is in-creased and if a volunteer did not mark any syn-thetic transits (transit box) her weight is decreased. For all the volunteers who classified non-synthetic images the competence evaluation is based on ma-jority opinion. A volunteer’s weight increases if the volunteer is in line with the majority weighted vote and is decreased if the volunteer is not in line with the majority opinion.
One of the major obstacles to our investigation was that there is no gold standard data available for the Galaxy Zoo subjects. (A subject is the Zooni-verse term for a unit that is presented to volunteers for classification. In the case of Galaxy Zoo, this is one photo taken by a telescope.) In other words, we do not know what the correct classification for the images are. This, in turn, means that there is no way of computing a gold standard for the com-petence level of the volunteers, since we cannot with certainty determine whether they have classi-fied an image correctly or not.
For these reasons, we had to find a way of es-timating the competence levels. How best to do this is not at all obvious. The one approach that
1planethunters.org
we have judged possible is to use majority votes, in essence trusting that most classifications are correct. This assumption is at least in part justi-fied by the fact that if it were not true, the whole Galaxy Zoo project would be pointless. The lack of gold standard data prevented us from using a more sophisticated model, where the volunteers performance on classification tasks with a known answer is used as an initial weighting, which is then reinforced by considering majorities on other classification tasks. Such an approach has been used in Planet Hunters, another Zooniverse project (Schwamb et al. (2005)).
In order to explain our approach in detail, we must first say something about the structure of the classification tasks the volunteers are presented with. Each subject is associated with a decision tree based flow chart of questions. The exact chart varies slightly depending on which sub-project of Galaxy Zoo the subject belongs to, but generally, the volunteers are asked three to five questions for each subject, where each of the questions follow-ing the first one depends on the answers to the previous questions. Since most subjects in the database have between 10 and 20 classifications, we determined that computing the majority votes for a whole subject classification, including all the questions from the flow chart, would not be ad-visable, since the answers to the questions after the first one vary to a surprising degree. We thus made the pragmatic decision to only consider the answers to the first question for each subject.
When a volunteer is presented with a subject, the first question, irrespective of which sub-project the subject belongs to, is whether the object in the middle of the photo is a smooth galaxy, a galaxy with features (a disc, spiral arms, etc.), or looks like a star or some other artifact. There are thus three possible answers to the first question. The first step was therefore to calculate, for each sub-ject, how many volunteers had given answers 1, 2, and 3, respectively. In order to have a reason-able amount of data for each subject, we disregard subjects with fewer than 10 classifications.
The next step was computing a competence value for each volunteer that had done at least 10 classifications. Here, we again had some design choices to make. The easiest approach would have been to simply say that for each subject, the cor-rect answer is the one that has gotten the most votes, and then count, for each volunteer, how
many times they had given the correct answer and dividing this number by the number of classifica-tions the volunteer had performed. This approach, however, has serious drawbacks. In the data set, it is not uncommon to find subjects where no answer has a clear majority. Consider a case where answer 1 has 12 votes, answer 2 has 10, and answer 3 has 4. Here, it is not clear which answer is actually correct, and it would be bad to give a “full score” to the volunteers that had given answer 1 and no points at all to those that had given answer 2.
Instead, we decided to go by the assumption that the more other volunteers agree with you, the more reasonable your answer is. We thus calcu-lated the competence score for a volunteer as fol-lows. For each subject that the volunteer has clas-sified, we divide the number of votes that agree with the volunteer by the total number of votes, getting a number in the interval [0,1]. The score
for the volunteer is then the average of these num-bers over all subjects the volunteer has classified. This approach has the benefit of “punishing” a vol-unteer more severely for an incorrect answer to an “easy” question, where most other volunteers have voted for another answer, while being lenient to-wards false answers to “hard” questions. On the downside, the users answering the hard questions correctly, get less credit for this than they deserve.
4 Experimental setup
4.1 Text Analysis and Feature Extraction
We extracted text comments written by 7,839 vol-unteer. We only targeted those users who clas-sified at least 10 subjects and discussed at least one of their classifications in chat text. The users were divided into three categories of equal size based on their computed competence levels on a scale ranging from 0 to 1: low ([0,0.52]),
medium ((0.52,0.59]) and high ((0.59,1]).
Hav-ing an equal number of users in each category helps to achieve balanced data and in eliminating bias during the machine learning phase. The raw data was obtained from Zooniverse Galaxy Zoo as a database dump. The entire text data contains around 26,617 sentences with average sentence length of 5.02. We extracted three types of lin-guistic features out of the text data: bag-of-words, syntactic and punctuation marks. The number of classifications is also included in each feature set as special feature or meta data.
4.1.1 Syntactic feature set
To extract syntactic features the Stanford proba-bilistic context-free grammar (PCFG) parser was used Klein and Manning (2003). These features provide a lot of information about the complexity of the syntactic structures used by the volonteers. For each syntactic category, we made a correla-tion analysis with classificacorrela-tion competence. To this end, we implemented a Java-based program that reads user texts from the database stored on the Mongodb server running on a local machine and makes use of the PCFG model to construct a syntactic parse or phrase-structured tree for the texts. The program counts the frequency of syn-tactic categories/constituent tags occurring within the tree and then annotates the text with these tag count information.
The non-leaf nodes in the resulting tree has three major syntactical categories: lexical cat-egories, functional categories and phrasal cate-gories. The lexical categories are the part-of-speech tags of the leaf nodes that represent con-tent words that make up the parsed text, for ex-ample, NN (noun), JJ (adjective), VB (verb), etc. As the Stanford parser has been trained on the Penn Treebank, we use the part-of-speech tags and their notations used in the tree bank to label the non-leaf nodes as well as to identify categories. The functional categories contain items responsi-ble for linking syntactic units, for example, DT (determiner), IN (preposition), MD (modal), etc. The phrasal categories represent different type of phrases within a sentence for which the parse tree is built, for example, NP (noun phrase), VP (verb phrase) and AP (adjective phrase), etc. In the syn-tactic feature set there are 66 numerical attributes representing the frequency count of syntactic cat-egories.
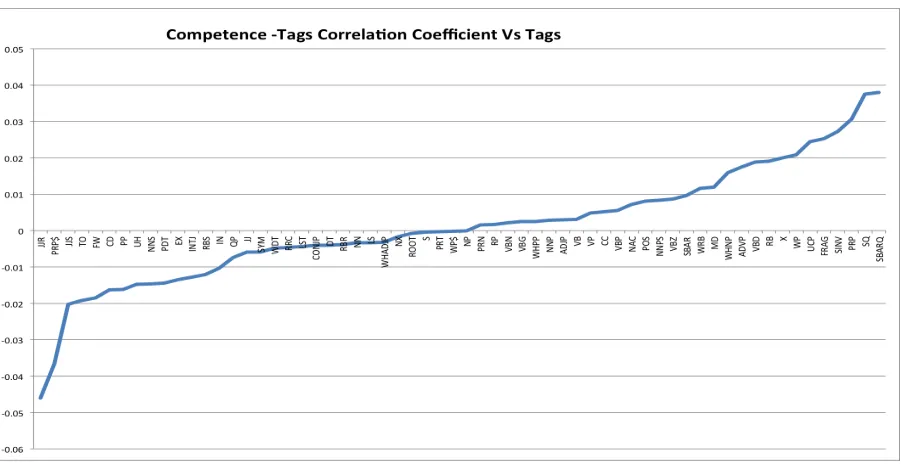
We attempted to analyze the correlation be-tween the syntactic categories count with com-puted competence values by looking at the corre-lation coefficient(CC) calculated for each syntac-tic category as summarized and shown in Figure 1. The calculated CC values range[−0.05,0.04], sta-tistically speaking these values do not show that there is a strong relationship. The Figure basi-cally shows three types of relationships between the syntactic categories and competence according to the observed CC values: the first type of rela-tionship is exhibited by the categories laid over the left-hand side of the X-axis such as JJR (adjective,
comparative), PRP$ (possessive pronoun) and JJS (adjective, superlative) they are negatively corre-lated with competence, those concentrated around the center such as S (simple declarative clause), PRT (particle) and WP$ (possessive wh-pronoun), do not seem to have a correlation with competence and the third type of relationship is exhibited by the categories close to the right-hand side of the X-axis such as PRP (personal pronoun), SQ (in-verted yes/no question) and SBARQ (direct ques-tion introduced by a wh-word).
4.1.2 Punctuation mark feature set
We also extracted the frequency count of punctu-ation marks including question mark, period, and exclamation mark. Special characters such as # and @ were also included. We also tried to per-form a correctional analysis between each feature in the set with competence as we did for the syn-tactic feature set and we got quite similar results in terms of the strength of their relationship. In the punctuation mark feature set there are 7 nu-merical attributes, that correspond to the selected punctuation marks.
4.1.3 Bag-of-Words feature set
We used the text analysis package of Rapidminer2 and text-processing Java libraries to extract the Bag-of-Words (BoW) and punctuation marks fea-tures respectively. The text analysis involves split-ting text into sentences, each sentence is further split into words followed by stemming and part-of-speech tagging. In the Bag-of-Words feature set there are 19,689 attributes excluding the tar-get (label) attribute, i.e competence. Each attribute has a numerical value that represents the frequency count of any token in a text.
By taking both an individual feature set and combination of them, we came up with 6 feature set configurations: Bag-of-Words (BoW),punctuation marks (Pun), punctuation marks with Bag-of-Words (Pun+BoW), syntactic, syntactic with Bag-of-Words (Syn+BoW), and the combination of BoW, punctuation mark and syn-tactic (BoW+Pun+Syn).
4.2 Training, Validation and Evaluation
We trained and evaluated three machine learn-ing classifiers: Decision Trees (DT) with gradient boosting, Naive Bayes (NB) andk-Nearest
Neigh-bor (KNN). These three methods were also used in
2rapidminer.com
Figure 1: The correlation between frequency of the extracted syntactic categories and computed competence values
a previous study Woldemariam (2017) using Snap-shot Serengeti data (another Zooniverse project). As the implementation of these classifiers is avail-able in Rapidminer Studio, we trained them on the Galaxy Zoo data set after configuring the model parameters associated with each classifier.
We adopted the best practices of the machine learning life cycle that includes randomly sam-pling and dividing the data into a training set, a validation (development) set and a test (evalua-tion) set, deciding the size of each set and bal-ancing the proportion of examples in each class of users. According to this, the classifiers are trained on 80% of the entire text corpus with the selected feature sets. The remaining 20% is used to eval-uate the trained models. We set aside 10% of the training set as a development data set to optimize model parameters.
4.2.1 Training
The classifiers were trained with the different feature sets. The feature sets are applied for each classifier as shown and denoted in the Ta-ble 1, first, Bag-of-Words (BoW), second, punc-tuation marks (Pun), third, puncpunc-tuation marks with Bag-of-Words (Pun+BoW), fourth, syntactic, fifth, syntactic with Bag-of-Words (Syn+BoW), and sixth, the combination of BoW, punctuation mark and syntactic (BoW+Pun+Syn). Each clas-sifier is trained 6 times with these 6 feature set configurations. Thus, in total, 18 (3*6) classifiers
models are produced for the subsequent validation phase. The training set contains texts from 6,262 unique users.
4.2.2 Validation
As a part of the training phase, we attempted to answer whether the trained classifiers are statis-tically significant before we evaluate them. We performed a null-hypothesis (H0) test, aiming at
checking that the prediction made by the mod-els is not likely just by random chance. In the null-hypothesis we assume that the mean accuracy value before and after testing the models is the same. However, in principle any effective model must have a greater mean accuracy after the test-ing and rejectH0.
In statistics there are different ways of testing the null hypothesis and the most widely used ap-proach for machine-learning problems associated with models significance test is a T-test. Basically, there are two important parameters in the T-test, a t-value and a p-value. The t-value indicates that how far the mean of the test sample is from the known mean (µ0), for example, the accuracy mean
before testing a model, depends on the size(n),
mean (x¯) and the standard deviation(s) of a test
sample as shown in the Equation 1. The p-value shows how likely the two means are to be equal. Once the t-value is calculated, the p-value can be obtained from a T-table by using degrees of free-dom (df).
t= x¯−sµ0 √
n
(1)
So, we performed the t-test for each model with the development set. We found that all the models scored a p-value below 0.001.
4.2.3 Evaluation
The models were evaluated with two equal size test sets by using accuracy and F-measure metrics. The first set is from the same domain as the train-ing set, and the second one is from the Zooniverse Snapshot Serengeti forum discussion posts.
To be able to use the Snapshot Serengeti data, we had to overcome the mismatch of the intervals of the competence scales of the two domains. We had to use a strategy that allows adapting the way that the competence scale for the Galaxy Zoo is divided to label its users to the Snapshot Serengeti users. In Woldemariam (2017), there are two scales used to divide the Snapshot Serengeti users, the first scale divides the user into three groups (Low, Medium and High) and the calibrated scale divides the users into five groups (very Low, Low, Medium, High, very High). Thus, we decided to use the first scale, as it is closer to the Galaxy Zoo scale in terms of the number of divisions, though the intervals between the groups are not exactly the same.
5 Results
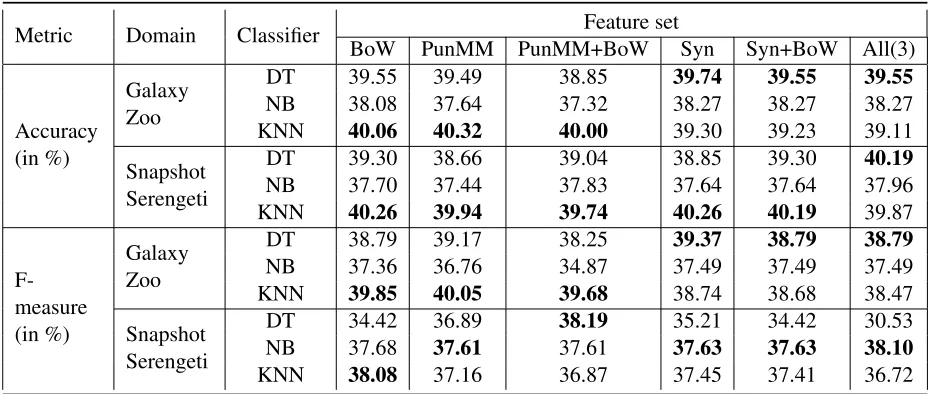
The results of the trained classifiers on the test sets are summarized in Table 1. We consider two per-formance metrics: accuracy and F-measure. To calculate accuracy we take the fraction of true pos-itive and true negative instances (correctly clas-sified instances) among the test instances, while the overall F-measure is computed by macro-averaging the F-measure values over classes. That means the harmonic mean of precision and recall of each class, i.e. the local F-measure of each class, is calculated, then we take the average value over classes as an overall F-measure.
The first thing to notice is that the accuracy scores are low. Since there are three classes in our data (Low, Medium, and High), a random clas-sifier would be expected to have an accuracy of 33%. In our tests, the best classifiers achieve an accuracy of just over 40%. There are, however, reasons why this is not as negative a result as it might seem. First, we work with relatively little
data, since most Galaxy Zoo users do not write comments, and no gold standard data is available. There is therefore reason to hope that the approach would yield better results in similar settings, but where more data is available. Second, for the in-tended use case, Zooniverse, any result that is sta-tistically certain to be better than random is useful. Zooniverse needs a better understanding of their volunteers, both when evaluating the results from classification tasks and in order to learn how to en-courage and educate the volunteers. Our classifi-cation methods can be combined with other user data to generate such knowledge.
Another interesting aspect is that the results for Snapshot Serengeti are not significantly worse than those for Galaxy Zoo, which indicates that the approach generalizes and can be deployed for other projects as well.
Analyzing the data in more detail, thek-Nearest
Neighbors (KNN) classifier performs best over-all and in particular when syntax is not involved. When using syntax, it is slightly worse and is sometimes outperformed by the Decision Trees (DT) classifier. It is also interesting that on the Galaxy Zoo data, the best performance (KNN on BoW and PunMM and DT on Syn) are seen when classifiers use only one of the three feature sets. Combining the sets seem to muddy the waters. A partial explanation for this could be that BoW has so many more features than the other two sets.
We also note that the performance of DT and KNN are so similar that we cannot, based on our tests, confidently say that one is a better choice than the other for this task.
The Naive Bayesian (NB) classifiers generally performed the poorest. One potential reason for this is that KNN and DT have flexible model pa-rameters, such askfor KNN and the number and
depth of the trees for DT. These values were noted to greatly impact the prediction accuracy during the validation phase. For example, by varying the value ofkof KNN model, we achieved about 5%
increase in accuracy. Varying the values of the pa-rameters of the kernel-based NB did not help very much in the improvement of its performance.
Table 1: Models Evaluation and Comparison Results, theAll(3)column is equivalent with BoW+PunMM+Syn
Metric Domain Classifier BoW PunMM PunMM+BoWFeature setSyn Syn+BoW All(3)
Accuracy (in %)
Galaxy Zoo
DT 39.55 39.49 38.85 39.74 39.55 39.55
NB 38.08 37.64 37.32 38.27 38.27 38.27
KNN 40.06 40.32 40.00 39.30 39.23 39.11
Snapshot Serengeti
DT 39.30 38.66 39.04 38.85 39.30 40.19
NB 37.70 37.44 37.83 37.64 37.64 37.96
KNN 40.26 39.94 39.74 40.26 40.19 39.87
F-measure (in %)
Galaxy Zoo
DT 38.79 39.17 38.25 39.37 38.79 38.79
NB 37.36 36.76 34.87 37.49 37.49 37.49
KNN 39.85 40.05 39.68 38.74 38.68 38.47
Snapshot Serengeti
DT 34.42 36.89 38.19 35.21 34.42 30.53 NB 37.68 37.61 37.61 37.63 37.63 38.10
KNN 38.08 37.16 36.87 37.45 37.41 36.72
used in study can be put in this order based on their relative influence on the prediction of com-petence from text: PunMM, BoW, PunMM+BoW, Syn, Syn+BoW or BoW+PunMM+Syn. The rank-ing changes a bit when the Snapshot Serengeti test set is used for the evaluation i.e. BoW, Syn, Syn+ BoW or BoW+PunMM+Syn, PunM, PunM+BoW. This ranking style compares the fea-ture sets based on their impact on a single best classifier among the three (DT, KNN and NB). There are other ways of ranking the feature sets that consider the average performance of all the three instead concerning both accuracy and F-measure.
We also tried to analyze how the Punctuation mark, the syntactic features and their combination affect of the performance of the classifiers over the Bag of Words features. Regardless the domains of the test sets involved in the evaluations, we ob-serve that the performance of NB (BoW based) is improved by adding syntactic and punctuation marks features. Likewise, the DT (BoW based) is affected by adding syntactic and the combination of syntactic and punctuation mark features.
6 Discussion
The approaches used in this study, from user com-petence calculation to machine learning tasks, can be improved or possibly yield different results with alternative strategies proposed in the follow-ing paragraphs.
The most obvious approach is to use data
la-beled by domain experts. For Galaxy Zoo, such data is not available, but we could consider other possibilities, such as a semi-supervised bootstrap-ping method if we had a small amount of la-beled data. Semi-supervised bootstrapping meth-ods have been effective in various text analysis problems, such as topic and sentiment-based text classification Zhou et al. (2013). In competence estimation, to reduce dependency on majority vot-ing, we train a classifier on a small dataset labeled by experts sampled from the training corpus. We then use the classifier to label the remaining un-labeled samples in the training corpus and retrain the classifier iteratively until we reach certain stop criteria.
Feature wise, in addition to the selected feature sets, we could use more features such as univer-sal dependencies, character n-gram, bag-of-topics. The syntactic feature set extracted can be further enriched with features extracted using a depen-dency parsing to describe and represent the syntac-tic structure of users text better. Dependency pars-ing captures the dependency relationships between syntactic units/words and has been used to im-prove the accuracy of text classification tasks Nas-tase et al. (2006). As a part of improving our re-search results, we have also carried out prelimi-nary experiments on a character n-gram and bag-of-topic features, where we describe a user text with topic words extracted using a topic modeling technique. We found that both types of features improve the accuracy of the trained models to a certain degree.
Finally, using multiple metadata information about users from other external data sources, for example, capturing their participations in either other seasons of the Galaxy Zoo project or other projects of Zooniverse, may help to better model the users competence.
References
D. C. Berry and D. E. Broadbent. 1984. On the re-lationship between task performance and as-sociated verbalizable knowledge.The Quar-terly Journal of Experimental Psychology, Section A. 36(2):209–231.
H. Chen and B. He. 2013. Automated essay scor-ing by maximizscor-ing human-machine agree-ment. In Proceedings of the 2013 Con-ference on Empirical Methods in Natural Language Processing, EMNLP 2013, 1741– 1752.
Y. Chen, J. Wrenn, H. Xu, A. Spickard, R. Haber-mann, J. Powers, and J. D. Denny. 2014. Automated assessment of medical students? clinical exposures according to aamc geri-atric competencies. In AMIA Annual Sym-posium Proceedings Archive, 375–384. M. Dascalu, E-V. Chioasca, and S. Trausan-Matu.
2008. ASAP–an advanced system for as-sessing chat participants. In AIMSA: Inter-national Conference on Artificial Intelli-gence: Methodology, Systems and Appli-cations, volume 5253 of Lecture Notes in Computer Science. Springer. 58–68. Y. Woldemariam 2017. Predicting competence
from text.In Proceedings of The 21st World Multi-Conference on Systemics, Cybernet-ics and InformatCybernet-ics (WMSCI), 147–152. L. Fu, L. Lee, and C. Danescu-Niculescu-Mizil.
2008. When confidence and competence collide: Effects on online decision-making discussions. In Proceedings of the 26th In-ternational Conference on World Wide Web,
WWW ?17, 1381–1390.
D. Klein and C.D. Manning. 2003. Accurate un-lexicalized parsing. In Proceedings of the 41st Meeting of the Association for Compu-tational Linguistics, 423–430.
T. Kucukyilmaz, B. Cambazoglu, C. Aykanat, and F. Can. 2008. Predicting user and message attributes in computer-mediated communi-cation. Information Processing and Man-agement, 44(4):1448–1466.
D.S. McNamara, S.A. Crossley, and P. M. Mc-Carthy. 2010. Linguistic features of writing quality. Written Communication, 27(1):57– 86.
D. Pérez, A. M. Gliozzo, C. Strapparava, E. Alfon-seca, P. Rodríguez, and B. Magnini. 2005. Automatic assessment of students? free-text answers underpinned by the combina-tion of a bleu-inspired algorithm and latent semantic analysis. In Proceedings of the Eighteenth International Florida Artificial Intelligence Research Society Conference, Clearwater Beach, Florida, USA, 358–363. M. E. Schwamb, C. J. Lintott, D. A. Fischer, M.
J. Giguere, S. Lynn, A. M. Smith, J. M. Brewer, M. Parrish, K. Schawinski, and R. J. Simpson. 2012. Planet hunters: Assessing the kepler inventory of short-period planets.
The Astrophysical Journal, 754(2):129. V. Nastase, J. Shirabad, and M. Caropreso. 2006.
Using Dependency Relations for Text Clas-sification. Proceedings of the 19th Cana-dian Conference on Artificial Intelligence, 12–25
Y.Haralambous, Y. Elidrissi, and P. Lenca. 2014. Arabic Language Text Classification Using Dependency Syntax-Based Feature Selec-tion. Proceedings of the 19th Canadian Conference on Artificial Intelligence
G. Zhou, J. Li, D. Zhao, and Y. Feng. 2013. Semi-supervised Text Categorization by Consid-ering Sufficiency and Diversity . Natural Language Processing and Chinese Comput-ing., 105–115.