Health Research and
Information Division
Acknowledgements
The collection and analysis of national perinatal data is a large undertaking, and the compilation of an accurate and comprehensive database on a timely basis is greatly dependent on the commitment and support of those at the forefront of collecting the data. Principal among these are the staff of the maternity hospitals and units as well as the many independent midwives involved in practice. We would like to express our sincere appreciation to all who contribute to the accurate recording and timely notification of statistical information for all births nationally.
Data on 65,810 births were analysed for this report. For each of these records additional information, apart from that required to register each birth, had to be collected in each hospital and by each independent midwife. This National Perinatal Reporting System (NPRS) within the Health Research and Information Division at the ESRI is responsible for collecting, coding, inputting and validating these data to create a national database which has been analysed for the production of this report of perinatal events for 2006.
In addition to financing the NPRS, the Department of Health and Children and the Health Service Executive continues to provide essential support for the operation and development of this system. We would like to acknowledge, in particular, the advice and assistance provided by Hugh Magee and Alan Cahill for his comments on an earlier draft of this report.
Table of Contents
List of Tables. . . ii
List of Figures. . . v
Executive Summary . . . vi
SeCTion 1
introduction 1 Introduction . . . 2Completeness and Reliability . . . 6
Trends and International Comparisons . . . 8
SeCTion 2
Selected Trends 15 Introduction . . . 16Selected Trends. . . 17
SeCTion 3
General Characteristics 23 Introduction . . . 24Part 1: Singleton Births . . . 25
Part 2: Multiple Births . . . 39
SeCTion 4
Perinatal Care 51 Introduction . . . 52Part 1: Singleton Births . . . 53
Part 2: Multiple Births . . . 61
SeCTion 5
Perinatal outcomes 67 Introduction . . . 68Part 1: Singleton Births . . . 69
Part 2: Multiple Births . . . 76
APPendiCeS
Appendix A: Definitions . . . 82Appendix B: Copy of Part 3 of the Birth Notification Form . . . 87
Appendix C: Classification of Occupation . . . 88
Appendix D: Cause of Death Classification . . . 89
Appendix E: Classification of County of Residence . . . 93
Appendix F: Classification of Nationality. . . 94
Appendix G: Cross-Tabulations of Selected Variables: 2006 . . . 98
Appendix H: Domiciliary Births: 1999–2006 . . . 125
List of Tables
2.1 Trends in Vital Events, 1999–2006 17
2.2 Trends in Selected Statistics, 1999–2006 18
Live Births, Stillbirths, early Neonatal Deaths, and Mortality Rates for Singleton Births for the year 2006 for the following variables:
3.1 Age of Mother 25
3.2 Maternal Parity 25
3.3 Mother’s Marital Status 27
3.4 Father’s Occupation 28
3.5 Mother’s Occupation 30
3.6 Number of Previous Stillbirths 31
3.7 Birthweight – All Singleton Births 32
3.8 Birthweight – Males 33
3.9 Birthweight – Females 33
3.10 Gestational Age at Delivery 35
3.11 Interval in Years Since Last Birth 36
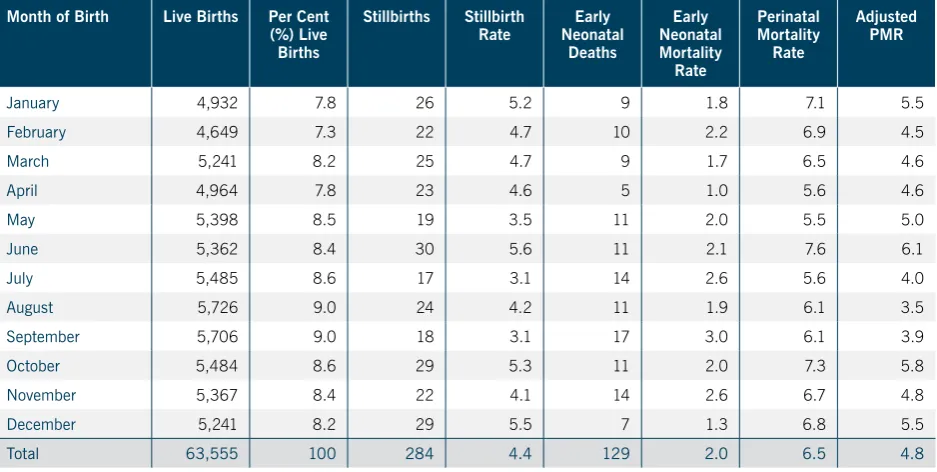
3.12 Month of Birth 36
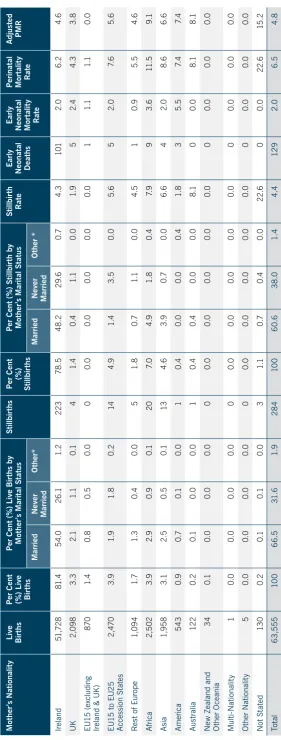
3.13 Mother’s Nationality 37
3.14 Father’s Nationality 38
Live Births, Stillbirths, early Neonatal Deaths, and Mortality Rates for Multiple Births for the year 2006 for the following variables:
3.15 Maternities, Twins, Triplets, Quadruplets, and Twinning Rate 39
3.16 Age of Mother 39
3.17 Maternal Parity 40
3.18 Mother’s Marital Status 40
3.19 Father’s Occupation 41
3.20 Mother’s Occupation 42
3.21 Number of Previous Stillbirths 42
3.22 Birthweight – All Multiple Births 43
3.23 Birthweight – Males 44
3.24 Birthweight – Females 44
3.25 Gestational Age at Delivery 45
3.26 Interval in Years Since Last Birth 45
3.27 Month of Birth 46
3.28 Mother’s Nationality 48
Live Births, Stillbirths, early Neonatal Deaths, and Mortality Rates for Singleton Births for the year 2006 for the following variables:
4.1 Type of Antenatal Care 53
4.2 Mother’s Length of Stay in Hospital Prior to Delivery 53
4.3 Mother’s Length of Stay in Hospital After Delivery 54
4.4 Method of Delivery 55
4.5 Advance Hospital Bookings 55
4.6 Size of Maternity Unit (number of live births and stillbirths annually) 56
4.7 Inter-Hospital Transfer of Infants 57
4.8 Rubella: Immune Status of Mother, Numbers and Percentages 57
4.9 Age of Mother by Infant’s Type of Feeding, Numbers and Percentages 58
Live Births, Stillbirths, early Neonatal Deaths, and Mortality Rates for Multiple Births for the year 2006 for the following variables:
4.10 Type of Antenatal Care 61
4.11 Mother’s Length of Stay in Hospital Prior to Delivery 61
4.12 Mother’s Length of Stay in Hospital After Delivery 62
4.13 Method of Delivery 63
4.14 Advance Hospital Bookings 63
4.15 Inter-Hospital Transfer of Infants 63
4.16 Rubella: Immune Status of Mother, Numbers and Percentages 64
4.17 Age of Mother by Infant’s Type of Feeding, Numbers and Percentages 64
the following tables are based on Singleton Births for the year 2006 for the following variables:
5.1 Live Births, Antepartum and Intrapartum Stillbirths, Early Neonatal Deaths, and Mortality Rates by Birthweight 69
5.2 Stillbirths, Early Neonatal Deaths and Mortality Rates by Cause of Death 70
5.3 Perinatal Mortality, Numbers and Rates by Birthweight and Cause of Death 72
5.4 Age at Death, Early Neonatal Deaths 74
5.5 Percentage Distribution of Live Births by Infant’s Length of Stay in Hospital 74
5.6 Percentage of Stillbirths and Early Neonatal Deaths undergoing Post-Mortem Examinations 75
the following tables are based on Multiple Births for the year 2006 for the following variables:
5.7 Live Births, Antepartum and Intrapartum Stillbirths, Early Neonatal Deaths, and Mortality Rates by Birthweight 76
5.8 Stillbirths, Early Neonatal Deaths and Mortality Rates by Cause of Death 77
5.9 Numbers of Perinatal Deaths by Birthweight and Cause of Death 78
5.10 Age at Death, Early Neonatal Deaths 79
5.11 Percentage Distribution of Live Births by Infant’s Length of Stay in Hospital 79
D1 Cause of Death Coding Rules 91
D2 ICD-10, Cause of Death Codes 92
the following tables are based on selected variables for the year 2006:
G1 Age of Mother by Maternal Parity, Singleton Live Births and Stillbirths 99
G2 Method of Delivery by Maternal Parity, Singleton Live Births and Stillbirths 100
G3 Mother’s Marital Status by Age of Mother, Singleton Live Births and Stillbirths 101
G4 Mother’s Marital Status by Age of Father, Singleton Live Births and Stillbirths 102
G5 Gestational Age at Delivery by Maternal Parity, Singleton Live Births and Stillbirths 103
G6 Age of Mother by Gestational Age at Delivery, Singleton Live Births and Stillbirths 104
G7 Method of Delivery by Age of Mother, Singleton Live Births and Stillbirths 105
G8 Birthweight by Gestational Age at Delivery, Singleton Live Births and Stillbirths 106
G9 Method of Delivery by Mother’s Length of Stay in Hospital After Delivery, Singleton Live Births and Stillbirths 107 G10 Maternal Parity by Mother’s Length of Stay in Hospital After Delivery, Singleton Live Births and Stillbirths 108
G11 Father’s Occupation by Infant’s Birthweight, Singleton Live Births and Stillbirths 109
G12 Mother’s Occupation by Infant’s Birthweight, Singleton Live Births and Stillbirths 111
G13 Father’s Occupation by Interval in Years Since Last Birth, Singleton Live Births and Stillbirths 113 G14 Mother’s Occupation by Interval in Years Since Last Birth, Singleton Live Births and Stillbirths 115
G15 Father’s Occupation by Infant’s Type of Feeding, Singleton Live Births 117
G16 Mother’s Occupation by Infant’s Type of Feeding, Singleton Live Births 118
G17 Infant’s Type of Feeding by Maternal Parity, Singleton Live Births 119
G18 Mother’s County of Residence by Mother’s Marital Status, Singleton and Multiple Live Births and Stillbirths 120 G19 Mother’s County of Residence by Infant’s Type of Feeding, Singleton and Multiple Live Births 122 G20 Mother’s County of Residence, Live Births, Stillbirths, Early Neonatal Deaths, and Mortality Rates, Singleton and
Multiple Births
124
the following tables are based on Domiciliary Births:
H1 Trends in Selected Statistics, Domiciliary Births, 1999–2006 126
H2 Age of Mother by Maternal Parity, 2006 127
H3 Age of Mother by Gestational Age at Delivery, 2006 128
H4 Birthweight by Gestational Age at Delivery, 2006 129
H5 Mother’s Occupation by Birthweight, 2006 130
H6 Mother’s Marital Status by Age of Mother, 2006 131
H7 Father’s Occupation by Infant’s Type of Feeding, Live Births, 2006 132
H8 Mother’s Occupation by Infant’s Type of Feeding, Live Births, 2006 133
the following tables are based on the variable timing of First Antenatal Care Visit for the year 2006:
I1 Time of First Visit to Doctor or Hospital During Pregnancy, Live Births, Stillbirths, Early Neonatal Deaths, and Mortality Rates, Singleton Births
135
I2 Time of First Visit to Doctor or Hospital During Pregnancy, Live Births, Stillbirths, Early Neonatal Deaths, and Mortality Rates, Multiple Births
135
I3 Mother’s Marital Status by Gestational Age at Time of First Visit to Doctor or Hospital During Pregnancy, Singleton Live Births and Stillbirths
136
I4 Interval in Years Since Last Birth by Gestational Age at Time of First Visit to Doctor or Hospital During Pregnancy, Singleton Live Births and Stillbirths
List of Figures
1.1 National Perinatal Reporting System, Diagrammatic View 3
1.2 Perinatal Mortality Rate, Ireland: 1999-2006 8
1.3 Perinatal Mortality Rates for Selected EU Countries: 2006 9
1.4 Trends in Birth Rates for Selected EU Countries: 1999-2006 10
1.5 Birth Rates per 1,000 Population for EU Countries: 2006 11
1.6 Age-Specific Fertility Rates (ASFRs) and Total Period Fertility Rates (TPFRs), Ireland: 1999-2006 12
1.7 Total Period Fertility Rates for Selected EU Countries: 2006 13
2.1 Percentage of Single Mothers, 1999-2006 19
2.2 Percentage of Births to Single Mothers by Age of Mother, Singleton Births, 1999-2006 20
2.3 Low Birthweight Babies as a Percentage of Total Live Births, 1999-2006 20
2.4 Average Length of Stay in Days for Mothers and Infants, 1999-2006 21
2.5 Caesarean Births as a Percentage of Total Live Births, 1999-2006 21
2.6 Percentage of Mothers Breastfeeding, 1999-2006 22
3.1 Perinatal Mortality Rates by Age of Mother, Singleton Births, 2006 26
3.2 Percentage Distribution of Parity by Age of Mother, Singleton Births, 2006 26
3.3 Mother’s Age: Percentage Distribution of Births for Married and Single Status, Singleton Births, 2006 27
3.4 Perinatal Mortality Rates by Father’s Occupation, Singleton Births, 2006 29
3.5 Perinatal Mortality Rates by Mother’s Occupation, Singleton Births, 2006 31
3.6 Percentage Distribution of Live Births across Birthweight Groups, Singleton Births, 2006 32 3.7(A) Perinatal Mortality Rates for Males and Females by Birthweight (500-2499 grams), Singleton Births, 2006 34 3.7(B) Perinatal Mortality Rates for Males and Females by Birthweight (2500-4500 grams and over), Singleton Births, 2006 34
3.8 Perinatal Mortality Rates by Gestational Age, Singleton Births, 2006 35
3.9 Birthweights: Cumulative Percentages of Singleton and Multiple Live Births, 2006 43
3.10 Percentage of Total Births to Single Mothers by Mother’s County of Residence, Singleton and Multiple Live Births and Stillbirths, 2006
47
4.1 Mother’s Postnatal Length of Stay: Cumulative Percentages by Method of Delivery, Singleton Births, 2006 54
4.2 Percentage of Live Births by Size of Maternity Unit, 2006 56
4.3 Percentage of Mothers Breastfeeding by Father’s Occupation, Singleton Births, 2006 59
4.4 Percentage of Mothers Breastfeeding by Mother’s Occupation, Singleton Births, 2006 59
4.5 Percentage of Mothers Breastfeeding by Age of Mother, Singleton Births, 2006 60
4.6 Percentage Distribution of Births by Mother’s Postnatal Length of Stay in Days, 2006 62
4.7 Percentage Distribution of Breastfed Infants by Mother’s County of Residence, Singleton and Multiple Live Births, 2006
executive Summary
The principal aim of the National Perinatal Reporting System (NPRS) is the provision of national statistics on perinatal events in Ireland. Since 1999, The Economic and Social Research Institute (ESRI) has been contracted by the Department of Health and Children to oversee the collection, processing, management and reporting of data submitted to the NPRS. In this report, data on pregnancy outcomes, with particular reference to perinatal mortality and important aspects of perinatal care, are presented for 2006. In addition, descriptive social and biological characteristics of mothers giving birth and babies born in 2006 are recorded.
In 2006, 65,810 births were notified to the NPRS, an increase of 6.5 per cent since 2005 and 8.1 per cent since 2002. The significant growth in births reflects the increase in singleton live births between 2005 and 2006 (reported at 59,621 and 63,555 respectively). In 2006 there were 308 stillbirths, giving a stillbirth rate of 4.7 per 1,000 live births and stillbirths in 2006. The stillbirth rate was slightly higher in previous years: 5.0 per 1,000 live births and stillbirths in 2005 and 5.6 per 1,000 live births and stillbirths in 2002. There were 152 early neonatal deaths resulting in an early neonatal death rate of 2.3 per 1,000 live births in 2006. This rate is the same as the rate per 1,000 live births in 2005, but lower than that reported in 2002 (2.8 per 1,000 live births) and still lower than that reported in earlier years. The perinatal mortality rate was 7.0 per 1,000 live births and stillbirths in 2006, a decrease of 0.2 per 1,000 from 2005. The 2006 perinatal mortality rate was also lower than that reported in 2002 (8.4 per 1,000 live births and stillbirths), and is at its lowest since this series of reports started in 1999.
The average birthweight of babies born in 2006 was estimated at just over 3,473 grams, marginally higher than that reported in 2005. The average gestational age at delivery in 2006 of 39.4 weeks has remained fairly constant since 2002. Low birthweight babies (weighing less than 2,500 grams) accounted for 5.0 per cent of total births in 2006. The twinning rate for 2006 was 14.8 per 1,000 maternities, and comprised 958 sets of twin births, 17 sets of triplet births, and 1 set of quadruplet births.
In 2006, single mothers accounted for 31.5 per cent of all women giving birth. This represents an increase of almost 1 percentage point since 2005 and an increase of just over 1.5 percentage points since 2002. Mother’s average age has increased slightly from 30.4 years in 2002 to 31.0 years in 2006. There has also been a small increase in the average age of single mothers, which was 25.7 years in 2002 and 26.8 years in 2006. The average maternal parity fell slightly from 1.06 previous births in 2002 to 1.02 previous births in 2006. The breastfeeding rate of 44.4 per cent of maternities with live births in 2006 represents a marginal change from 44.1 per cent reported in 2005.
Delivery by caesarean section was estimated at 25.4 per cent of total live births in 2006 compared with 25.9 per cent in 2005 and 22.4 per cent in 2002. In 2006, 24.3 per cent of singleton births were delivered by caesarean section. While the comparable rate for 2002 was 21.6 per cent. The percentage of multiple births delivered by caesarean section in 2006 was 59.8 per cent, which is over 10 percentage points higher than that reported in 2002.
Average lengths of stay for both mother and infant continued to decline in 2006. Infant’s length of stay decreased from an average of 3.9 days in 2002 to 3.7 days in 2006, while mother’s average total length of stay fell from 4.1 days in 2002 to 3.7 days in 2006.
SeCtioN
introduction
AimS
This report of the National Perinatal Reporting System (NPRS) has as its principal aim the provision of national statistics on perinatal events for the year 2006. More specifically, the report aims to describe the fundamental social and biological characteristics of mothers and their babies, to report on pregnancy outcomes with particular reference to perinatal mortality, and to highlight important aspects of perinatal care. Although great strides have been made in reducing infant and perinatal mortality during the past twenty years, the perinatal period continues to be a time of relatively high mortality. Set in this context, the importance of monitoring variables related to perinatal health becomes evident.
This report presents what might be considered as a minimum national data set, and is intended to serve as a foundation for the development of basic time series analyses and allow for the possible addition of further variables and more extensive analysis in future years. In mid-2003 the birth notification form (BNF01/2003) was revised to facilitate a number of new fields that were required by the General Register Office (GRO) for birth registrations (part 1). These changes have resulted in the collection of two new variables by the NPRS: nationality and country of residence for both the mother and father. These variables were reported on for the first time in 2004. It is hoped that the publication of the data reported to the NPRS will stimulate a wider interest in research in the area of perinatal epidemiology and promote a general recognition of the importance of having an accurate and complete perinatal reporting system at a national level. For background information on the development of the perinatal reporting system please see previous reports (HIPE & NPRS Unit, Report on Perinatal Statistics for 2002, The Economic and Social Research Institute, 2005). The definitions for parameters estimated in this report are contained in Appendix A.
dATA CoLLeCTion And ProCeSSinG
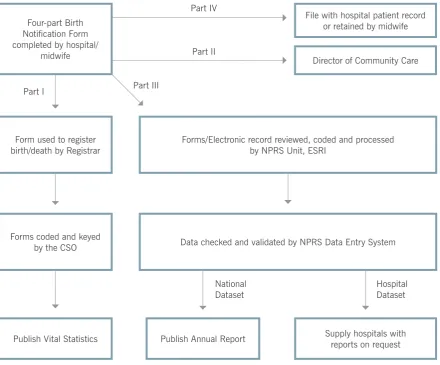
Figure 1.1
National Perinatal Reporting System, Diagrammatic View
Four-part Birth notification Form completed by hospital/
midwife
File with hospital patient record or retained by midwife
director of Community Care
Forms/electronic record reviewed, coded and processed by nPrS Unit, eSri
Form used to register birth/death by registrar
data checked and validated by nPrS data entry System Forms coded and keyed
by the CSo
Publish Vital Statistics Publish Annual report Supply hospitals with reports on request Part iV
Part i Part iii
national dataset
Hospital dataset Part ii
The data collected by the NPRS can be grouped logically into demographic, clinical and administrative data. The data collected by the NPRS for 2006 include:
demoGrAPHiC dATA
Date of infant’s birth, sex of infant, multiple birth indicator
•
Date of father’s birth, father’s county and country of residence, father’s occupation,
•
father’s nationality
Date of mother’s birth, mother’s county and country of residence, mother’s occupation,
•
mother’s nationality
Marital status of mother and date of present marriage
CLiniCAL dATA
Infant’s birthweight and period of gestation, and mother’s obstetric history (including parity)
•
Autopsy indicator – whether stillbirth occurred before or during labour
•
Main cause of death and one secondary cause of death for infant
•
Maternal immunity to rubella, method of delivery
•
Infant’s BCG vaccination
•
Main maternal disease or condition and one secondary maternal disease or condition affecting
•
the infant or foetus
Main disease or congenital malformation and one secondary disease or congenital malformation
•
affecting the infant or foetus
AdminiSTrATiVe dATA
Hospital number, case number (unique to hospital of birth)
•
Type of birth indicator, place of birth
•
Date of last birth (live birth or stillbirth)
•
Type of death indicator, place of death
•
Type of antenatal care received, date of first visit to doctor and hospital during pregnancy
•
Type of feeding, pre-booked admission indicator, dates of mother’s admission and discharge,
•
date of infant’s discharge
Infant transfer indicator, hospital number for hospital to which infant was transferred.
•
Occupations are coded according to the CSO system of socio-economic group classification (see Appendix C). Since 2005, diseases and cause of death are coded using the Tenth Revision of the
International Classification of Diseases (ICD-10)1 and according to the guidelines set out by the World
Health Organisation (WHO) (see Perinatal Statistics Report 2005 for further details on updating from
ICD-9 to ICD-10). On completion of data entry, the NPRS Unit in The Health Research and Information Division at the ESRI undertakes checks for data coverage and feasibility.
The NPRS data set collects morbidity and mortality data on mothers giving birth and their babies. The NPRS coders are trained in ICD-10 coding practices, with particular focus on chapters
Pregnancy, childbirth and the puerperium, Certain conditions originating in the perinatal period, and
Congenital malformation, deformations and chromosomal abnormalities (Chapters XV–XVII)2.
The CSO commenced using ICD-10 from 1 January 2007. See Appendix D for a detailed description on cause of death classification and coding rules applied by coders in the NPRS Unit at the ESRI.
1 World Health Organisation, 2005, International Statistical Classification of Diseases and Related Health Problems, 10th Revision. Vols. 1–3.
Geneva: World Health Organisation.
2 World Health Organisation, 2005, International Statistical Classification of Diseases and Related Health Problems, 10th Revision. Vols. 1–3.
FormAT And ConTenTS
This report presents a set of national tabulations for perinatal events for 2006 indicating frequencies, stillbirth rates, early neonatal death rates, and perinatal mortality rates set out for a number of the most important social, biological and health care variables. The data are presented in four main sections covering selected trends, general characteristics, perinatal care, and perinatal outcomes. The definitions for parameters reported in these sections are contained in Appendix A.
Section 2 (Selected Trends) documents significant trends in the principal variables for the years 1999–2006.
Section 3 (General Characteristics) contains tables relating to the following variables: maternal age, parity, marital status, socio-economic group of mother and father (derived from collection of data on occupations), distribution of previous stillbirths, birthweight (by sex), twinning rate, gestational age, interval since last birth, month of birth, and nationality of mother and father.
Section 4 (Perinatal Care) deals with variables which fall more naturally into the category of use of health care facilities and type of antenatal care received, and deals with the following distributions: type of antenatal care received, length of mother’s antenatal and postnatal stay, mother’s immunity to rubella, method of delivery, whether hospital admission was booked or not, type of feeding, transfer of infants between hospitals, and classification of outcome according to size of maternity unit.
Completeness and reliability
CoVerAGe
The NPRS covers all live births and stillbirths occurring in Ireland. However, there are differences in the vital statistics published by the CSO and the data presented in this report. The reasons for these differences are outlined here.
miSSinG VALUeS
No attempt has been made to assign values to missing data, and they are included as a separate category in each table. In each year, the proportion of cases with the value ‘not stated’ continues to decline. This is a positive outcome arising from continued effort on the part of the NPRS staff, hospital administrators, and independent midwives to reduce the number of missing values for all variables collected in the data set. This improves the completeness of the reported data, which is a key objective for the NPRS.
The majority of variables were largely complete in the 2006 data set with birthweight and method of delivery missing for only 7 records. Mother’s age was missing for only 44 records and type of feeding was missing for 19 records. For 2006, missing data on information on time of first visit to doctor or hospital during pregnancy remains the same as 2005 and was not recorded for 3.9 per cent of births (see also section on Delivery of Antenatal Care below).
Father’s nationality was missing for 11.3 per cent and 2.6 per cent of total births where mother’s marital
status was recorded as married3 in 2004 and 2005 respectively. For 2006 father’s nationality was missing
for only 1.4 per cent of total births where mother’s marital status was recorded as married. Mother’s nationality was missing for 2.9 per cent and 0.7 per cent of total births in 2004 and 2005 respectively and was missing for only 0.2 per cent of all births in 2006. For 2006, father’s date of birth was missing for 10.2 per cent of births where mother’s marital status was married. Missing values for mother’s occupation remained very low: only 0.4 per cent of births in 2006 did not have this information recorded. Notwithstanding improvements in the completeness of returns, the elimination of ‘missing values’ for all variables continues to be an important objective for the development of the NPRS.
deLiVery oF AnTenATAL CAre
Changing models of antenatal care are being experienced by mothers in Ireland, and it is intended that the data collected by the NPRS should reflect these changes. The data collected with regard to ‘Mother’s Health’ is intended to describe the mother’s first contact with the health services. The data currently collected in this section include the following:
Type of antenatal care this pregnancy (Hospital/Obstetrician=1, G.P. only=2, Combined=3,
•
None=4, Midwife Only=5) Date of first visit to doctor
•
Date of first visit to hospital.
•
Where antenatal care in this pregnancy is indicated as ‘combined care’, it is expected that the dates of first visits to each health professional are recorded. While over 79 per cent of all births in 2006 were recorded as receiving combined antenatal care, almost half of these births recorded date of first visit to doctor as ‘not known’. Regrettably, the absence of these data means that the timing of first contact with health professionals within this category may be recorded as the date of the first hospital visit, even though this is likely to have been later than the first visit to the doctor. The proportion of mothers attending antenatal care during the first 12 weeks in 2006 is, therefore, estimated at around 53 per cent of all births, which is low by European standards. Consequently, caution should be exercised in interpreting the data on the timing of the first visit to health services (see also Appendix I).
AreA oF reSidenCe
In the interests of safeguarding patient confidentiality the copy of the notification form received by the NPRS unit at the ESRI does not contain the mother’s full address, but only the county designation (see Appendix E). As there is no way of verifying this information, mother’s area of residence has been analysed at county level in this report.
dATA QUALiTy
The NPRS seeks to compile an accurate, complete and up-to-date database on perinatal events over a specified time period. As some of the indicators collected by the NPRS are also reported by the CSO, comparisons of both data sets provide an option for checking on data quality. In the past, some discrepancies between data reported by NPRS and the CSO have been attributed to differences in data
definitions – see previous reports on Perinatal Statistics 1999–2005, Health Research and Information
Division, The Economic and Social Research Institute. At the time of finalising the preparation of
this report, data on stillbirths and perinatal mortality for 2006 were not available from the CSO. For a discussion of comparisons between NPRS and CSO for these indicators in previous years,
see Reports on Perinatal Statistics for the years 1999–2005 for further details.
For 2006, the CSO report a provisional twinning rate of 15.4 per 1,000 maternities4 and the NPRS
report a twinning rate of 14.8 per 1,000 maternities. The differences in these rates may be partly attributable to differences in definition applied in each system. The NPRS data set excludes all births where weight is under 500 grams. In the case of a multiple birth where one or more births from the set weighs under 500 grams, the birth/s weighing under 500 grams is/are removed from the national data set. Any birth/s weighing over 500 grams in the multiple birth set is/are retained in the national
data set as a multiple birth/s.5 This may result in incomplete sets of multiple births in the national
data set and a lower number of multiple births recorded for reporting purposes (see also Table 3.15). There is a single field on the birth notification form that identifies a multiple birth. If these data were not recorded then the NPRS has no way of identifying multiple births. It would be assumed, however, that the additional personal identification data available to the CSO would ensure a more comprehensive estimate of the number of multiple births.
4 Provisional data obtained from the Vital Statistics section, CSO, (personal communication, 28 October 2008).
Trends and international Comparisons
This section presents data on three key indicators that are influential in determining the structure of the Irish population. At a national level, the data presented in this section show how these parameters have changed in Ireland over time. International comparisons then allow the most recent statistics for Ireland to be compared with those for other European countries. The indicators for Ireland were
estimated using data from the NPRS for the period 1999 to 2006.6
PerinATAL morTALiTy
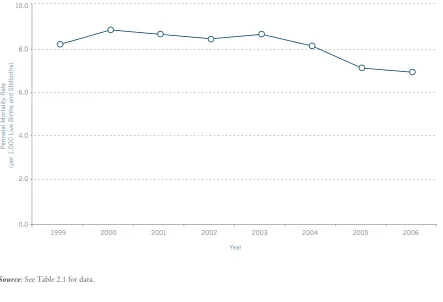
[image:20.595.73.517.482.784.2]Figure 1.2 shows the perinatal mortality rate in Ireland from 1999 to 2006. The perinatal mortality rate is the ratio of total stillbirths and early neonatal deaths to total live births and stillbirths, and is expressed as the rate per 1,000 live births and stillbirths. In 1999 the perinatal mortality rate was 8.2 per 1,000 live births and stillbirths. This rate peaked at 8.8 per 1,000 live births and stillbirths in 2000 and declined to 8.6 and 8.4 per 1,000 live births and stillbirths in 2001 and 2002 respectively. For 2003, the perinatal mortality rate increased marginally to 8.6 per 1,000 live births and stillbirths, resuming its decline once again to 8.1 and 7.2 per 1,000 live births and stillbirths in 2004 and 2005 respectively. Over the entire period reported in Figure 1.2, the lowest perinatal mortality rate was recorded in 2006 (7.0 per 1,000 live births and stillbirths).
Figure 1.2
Perinatal Mortality Rate, Ireland: 1999–2006
Year
P
er
in
at
al M
or
ta
lit
y R
at
e
(p
er 1
,0
0
0 L
iv
e B
ir
th
s a
nd S
til
lb
ir
th
s)
1999 2000 2001 2002 2003 2004 2005 2006
0.0 6.0 8.0 10.0
2.0 4.0
Source: See Table 2.1 for data.
The factors impacting on the level of perinatal mortality are complex and encompass a wide range of environmental and biological variables. Birthweight, parity, mother’s age, social status, and type of antenatal care, as well as many other variables have a bearing on perinatal risk. Data, presented in the subsequent sections of this report, indicate levels of perinatal mortality for the principal variables associated with risk.
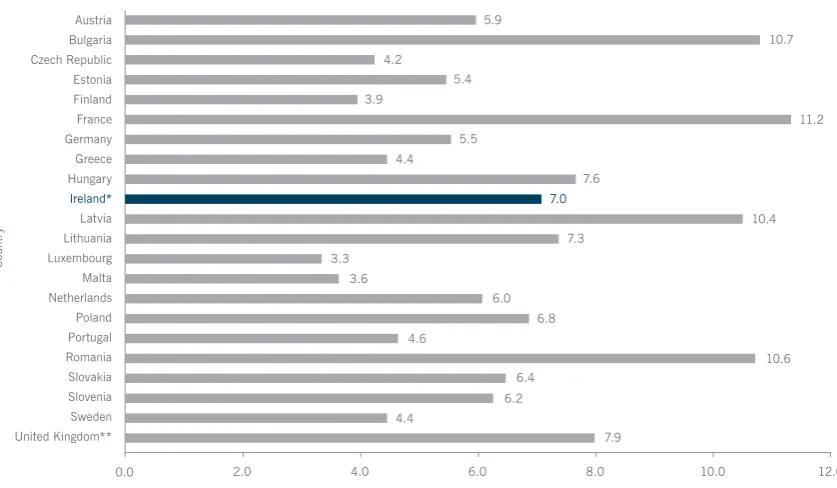
[image:21.595.91.510.448.692.2]Ireland’s standing in the European Union (EU) in relation to perinatal mortality is shown in Figure 1.3. For the 22 countries for which 2006 data were available, the highest perinatal mortality rate was recorded in France at 11.2 per 1,000 live births and stillbirths. The country with the lowest perinatal mortality rate was Luxembourg at 3.3 per 1,000 live births and stillbirths. Considering the countries in ascending order of their perinatal mortality rate, Ireland had a comparatively high perinatal mortality rate, ranking 15th out of the 22 countries listed in Figure 1.3. In contrast, the perinatal mortality rates of the United Kingdom (7.9 per 1,000 live births and stillbirths, ranked 18th) and France (11.2 per 1,000 live births and stillbirths, ranked 22nd) were higher still. When countries are compared it should be remembered that rates are affected by national policies on abortion, availability of services related to fertility treatment, differences in the comprehensiveness and accuracy of registration and notification systems, and variations in definitions employed (for example, for stillbirth).
Figure 1.3
Perinatal Mortality Rates for Selected EU Countries: 2006
Austria Bulgaria Czech Republic Estonia Finland France Germany Greece Hungary
Ireland*
Latvia Lithuania Luxembourg Malta Netherlands Poland Portugal Romania Slovakia Slovenia Sweden United Kingdom**
Perinatal Mortality Rate (per 1,000 Live Births and Stillbirths)
Countr
y
0.0 2.0 4.0 6.0 8.0 10.0 12.0
5.9
4.2
3.9
3.3 3.6
5.4
5.5 4.4
7.6
7.3
6.0
4.6
6.8
10.6 10.4
7.0
10.7
11.2
6.4 6.2 4.4
7.9
Source: ‘Population and Social Conditions’, Eurostat, Data Navigation Tree, date consulted September 2008, http://epp.eurostat.ec.europa.eu
BirTH rATe
The birth rate is based on the total number of live births per 1,000 population.7 Figure 1.4 shows
trends in birth rates for selected EU countries since 1999. For the countries reviewed, Ireland has consistently had the highest birth rate over the period. While Ireland’s birth rate was closer to that of other European countries in 1999, since 2000 the gap has grown between Ireland and France, the European country closest to Ireland in terms of birth rates. Ireland’s birth rate peaked at 15.5 per 1,000 population in 2002 and 2003 declining to 14.9 per 1,000 population in 2005. Returning to 15.4 per 1,000 population in 2006, Ireland continued to have the highest birth rate of
any of the 27 EU countries (Figure 1.5).8
Figure 1.4
Trends in Birth Rates for Selected EU Countries: 1999–2006
Ireland* France Greece Italy Netherlands United Kingdom 16.0
15.0
14.0
13.0
12.0
11.0
10.0
9.0
8.0
1999 2000 2001
Year
Live Bir
ths per 1,000 P
opulation
2002 2003 2004 2005 2006
Source: ‘Population and Social Conditions’, Eurostat, Data Navigation Tree, date consulted September 2008, http://epp.eurostat.ec.europa.eu
* Data for Ireland are based on NPRS data on live births from 1999 onwards. Population estimates were obtained from Ireland and Northern Ireland’s Population Health Observatory (INIsPHO) PHIS (Online) Indicators System, http://www.inispho.org/ phis/indicators. Population estimates for 2006 were obtained from Census 2006.
7 The population estimates used in the denominator of the birth rate were calculated by the Department of Health and Children and obtained from Ireland and Northern Ireland’s Population Health Observatory (INIsPHO) PHIS (Online) Indicators System, http://www.inispho.org/phis/indicators, date consulted September 2008. For the Census year 2002, population data from PHIS concur with the Census. Population estimates for 2006 were obtained from Census 2006.
Figure 1.5 presents the birth rate for EU countries in 2006. Apart from Ireland (15.4), the country with the next highest birth rate is France (13.1) followed by the United Kingdom (12.4). In 2006, Germany (8.2) and Lithuania (9.2) had the lowest birth rate followed by Slovenia and Austria (9.4).
Figure 1.5
Birth Rates per 1,000 Population for EU Countries: 2006
Austria Belgium Bulgaria Cyprus Czech Republic Denmark Estonia Finland France Germany Greece Hungary
Ireland*
Italy Latvia Lithuania Luxembourg Malta Netherlands Poland Portugal Romania Slovakia Slovenia Spain Sweden United Kingdom**
Live Births per 1,000 Population
Countr
y
0.0 2.0 4.0 6.0 8.0 10.0 12.0 14.0 16.0 18.0 12.0
11.1 11.2
13.1 8.2
9.4
11.5 9.6
11.3 10.3
10.1 9.9
15.4
9.5 9.7 9.2
11.7 9.6
11.3 9.8 10.0
10.2 10.0 9.4
10.9 11.7
12.4
Source: ‘Population and Social Conditions’, Eurostat, Data Navigation Tree, date consulted September 2008, http://epp.eurostat.ec.europa.eu
* Data for Ireland are based on NPRS data on live births. Population estimates for 2006 were obtained from Census 2006.
FerTiLiTy
Figure 1.6 shows the trend in the total period fertility rate (TPFR) in Ireland from 1999 to 2006. The TPFR for a given year indicates the number of children a woman could expect to have if the age-specific fertility rates for that year applied throughout her fertile years. The Irish TPFR has increased overall from an average of 1.91 in 1999 to 1.94 in 2006, reaching a high of 1.98 in the
intervening years 2002 and 2003.9 The age-specific fertility rates (ASFRs), used in the calculation of
the TPFR and also shown in Figure 1.6, indicate differences in fertility patterns between younger and older age groups. While the number of live births per 1,000 women aged in the lower age group categories (15 to 19, 20 to 24 and 25 to 29 years) has been declining, women in the higher age group categories (30 to 34, 35 to 39, 40 to 44 and 45 to 49 years) recorded an increasing number of live births over the period 1999–2006. In all years the 30 to 34 year age group recorded the highest ASFR. Both the 35 to 39 and 40 to 44 year age groups have recorded increasing ASFRs each year from 1999, with the ASFR for the 35 to 39 year age group remaining above the 25 to 29 year age group for a second year in 2006. Notably, while the number of live births per 1,000 women in the 20 to 24 and 25 to 29 age groups were declining up to 2005, these have both increased for 2006 but still are lower than levels reported in earlier years. It is interesting also that the ASFR for 40 to 44 year age group is now greater than that reported for the 15 to 19 year age group in 2006.
Figure 1.6
Age-Specific Fertility Rates (ASFRs) and Total Period Fertility Rates (TPFRs), Ireland: 1999–2006
160.0
140.0
120.0
100.0
80.0
60.0
40.0
20.0
0.0
2.5
2.0
1.5
1.0
0.5
0.0 1999 2000 2001
Year
ASFR (A
verage Number of Live Bir
ths per 1,000 W
omen)
TPFR (A
verage Number of Children per W
oman)
2002 2003 2004 2005 2006 15–19 20–24 25–29 30–34 35–39 40–44 45–49 TPFR 15–19 20–24 25–29 30–34 35–39 40–44 45–49 TPFR
Note: Total period fertility rates (TPFRs) and age-specific fertility rates (ASFRs) are calculated using NPRS data from 1999 onwards. ASFR is the number of live births to women in a particular age group divided by the female population in that age group, multiplied by 1,000. The TPFR is compiled by summing the ASFRs for the relevant five-year age groups, dividing by 1,000 and multiplying by 5. Female population estimates for the years 1999 to 2005 were obtained from Ireland and Northern Ireland’s Population Health Observatory (INIsPHO) PHIS (Online) Indicators System, http://www.inispho.org/phis/indicators, date consulted September 2008. For the Census year 2002, population data from PHIS concur with the Census. Population estimates for 2006 were obtained from Census 2006.
As in all EU countries for which data are available, the TPFR for Ireland remains below the level required for the long-term replacement of the population (TPFR of 2.1) in the absence of any net inward migration. Using data from Eurostat and the NPRS, Figure 1.7 shows that, for 2006, Ireland had the second highest TPFR in the EU at 1.9, just behind France with a TPFR of 2.0. For 2006, Slovakia had the lowest TPFR (1.2) of the EU countries for which data were available.
Figure 1.7
Total Period Fertility Rates for Selected EU Countries: 2006
Austria Bulgaria Cyprus Czech Republic Denmark Estonia Finland France Germany Greece Hungary
Ireland*
Latvia Lithuania Luxembourg Malta Netherlands Poland Portugal Romania Slovakia Slovenia Spain Sweden United Kingdom
Total Period Fertility Rate
Countr
y
0.0 0.5 1.0
TPFR 2.1
1.5 2.0 2.5
1.3
1.8 1.6
1.8 2.0 1.4
1.4 1.5
1.3 1.4 1.3
1.9
1.4 1.3
1.7 1.4
1.7 1.3
1.4 1.3 1.2
1.3 1.4
1.9 1.8
Source: ‘Population and Social Conditions’, Eurostat, Data Navigation Tree, date consulted September 2008, http://epp.eurostat.ec.europa.eu
SeCtioN
introduction
Ta bl e 2 .1 Tr en ds i n V ita l E ve nt s, 1 99 9– 20 06 Si ng le to n a nd M ul tip le B irt hs , N um be rs a nd R at es ( pe r 1 ,0 00 ) f or L iv e B irt hs , S til lb irt hs , E ar ly N eo na ta l D ea th s, a nd P er in at al D ea th s V it al ev en ts Ye ar 1999 2 000 2 0 01 20 0 2 20 0 3 20 0 4 20 0 5 20 0 6 N um be r Ra te N um be r Ra te N um be r Ra te N um be r Ra te N um be r Ra te N um be r Ra te N um be r Ra te N um be r Ra te Li ve Bi rt hs : Si ng le to n 52, 55 6 -5 3, 42 9 -5 6, 11 5 -5 8,7 52 -59 ,8 37 -6 0, 18 6 -59 ,62 1 -6 3, 555 -m ulti ple 1, 4 6 3 -1, 42 9 -1, 8 07 -1, 77 0 -1, 79 5 -1, 8 81 -1, 8 59 -1, 9 47 -To ta l 5 4, 01 9 -5 4, 8 5 8 -57, 92 2 -6 0, 52 2 -61, 6 32 -62, 0 67 -61, 4 8 0 -65, 5 02 -St ill bi rt hs : Si ng le to n 274 5. 2 28 8 5.4 307 5.4 31 9 5.4 327 5.4 31 3 5. 2 281 4.7 28 4 4. 4 m ulti ple 14 9. 5 20 13 .8 32 17. 4 24 13 .4 30 16 .4 26 13 .6 25 13 .3 24 12 .2 To ta l 28 8 5. 3 30 8 5.6 3 39 5. 8 3 43 5.6 357 5. 8 3 39 5.4 30 6 5.0 30 8 4.7 ear ly Si ng le to n 13 0 2. 5 15 3 2. 9 13 6 2. 4 14 9 2. 5 15 6 2. 6 14 0 2. 3 10 9 1. 8 12 9 2. 0 n eo na ta l m ulti ple 27 18 .5 23 16 .1 24 13 .3 21 11 .9 21 11 .7 28 14 .9 30 16 .1 23 11 .8 d ea th s: To ta l 15 7 2. 9 17 6 3. 2 16 0 2. 8 17 0 2. 8 17 7 2. 9 16 8 2.7 13 9 2. 3 15 2 2. 3 Pe rin at al Si ng le to n 40 4 7. 6 4 41 8. 2 4 43 7. 9 46 8 7. 9 48 3 8.0 45 3 7. 5 39 0 6. 5 41 3 6. 5 d ea th s: m ulti ple 41 27. 8 43 29 .7 56 30. 5 45 25 .1 51 27 .9 54 28 .3 55 29 .2 47 23. 8 To ta l 4 45 8. 2 48 4 8.8 49 9 8.6 51 3 8.4 5 3 4 8.6 5 07 8.1 4 45 7. 2 46 0 7. 0 A dj us te d Si ng le to n 30 1 5.7 317 5.9 311 5. 5 35 3 6.0 3 36 5.6 3 36 5.6 287 4. 8 30 6 4. 8 Pe rin at al m ulti ple 37 25 .1 31 21. 4 45 24 .5 43 24 .0 48 26 .3 46 24 .2 43 23. 0 39 19 .9 d ea th s*: To ta l 3 38 6. 2 3 4 8 6. 3 35 6 6.1 39 6 6. 5 38 4 6. 2 3 82 6.1 3 30 5.4 3 45 5. 3 N ot e: * In t hi s a nd s ub se qu en t t ab le s, ‘ A dj us te d P er in at al M or ta lit y R at e’ g iv
es a p
Table 2.2
Trends in Selected Statistics, 1999–2006
Selected Statistics 1999 2000 2001 2002 2003 2004 2005 2006
General Characteristics
Average Age of mother in
years 1 30.06 30.18 30.27 30.41 30.58 30.79 31.02 31.04
Average maternal Parity 1 1.10 1.09 1.07 1.06 1.05 1.05 1.05 1.02
Single mothers (%) 1,2 29.73 30.09 30.14 30.01 30.20 30.63 30.71 31.53
Average Age of Single
mothers in years 1,2 24.74 24.98 25.36 25.72 26.10 26.38 26.63 26.82
Average number of Previous Stillbirths per 1,000 maternities 1
14.03 13.06 13.57 12.43 12.02 12.60 12.79 10.57
Average Weight in grams 3
Singleton Births 3,505.35 3,517.27 3,509.36 3,503.73 3,500.64 3,507.96 3,503.23 3,503.93
multiple Births 2,467.24 2,509.85 2,470.41 2,489.72 2,487.13 2,471.20 2,469.18 2,464.77
Total Births 3,477.19 3,491.05 3,476.96 3,474.07 3,471.11 3,476.56 3,471.97 3,473.04
Low Birthweight <2500 grams (%) 3
Singleton Births 3.80 3.84 3.84 3.76 3.87 3.71 3.76 3.74
multiple Births 47.71 43.35 46.46 44.18 45.07 45.56 45.62 46.38
Total Births 4.99 4.87 5.17 4.94 5.07 4.98 5.02 5.01
Average Gestational Age
at delivery in weeks 1 39.48 39.46 39.47 39.45 39.44 39.38 39.42 39.40
Average interval since last birth in years 1
3.82 3.84 3.81 3.85 3.78 3.72 3.76 3.84
perinatal Care
Hospital & GP combined
antenatal care (%) 1 72.53 72.43 73.29 74.07 75.86 77.29 77.47 79.01
mother’s Average Length
of Stay in days 4 4.71 4.54 4.38 4.09 3.95 3.85 3.84 3.72
immunity to rubella (%) 1 89.63 87.76 86.84 86.49 87.30 90.49 90.26 92.21
method of delivery (%) 5
Singleton Births
Spontaneous 65.35 64.56 64.29 63.27 62.24 60.54 60.05 59.80
Caesarean 19.69 20.55 21.05 21.61 23.14 24.23 24.86 24.33
Forceps 6 4.27 3.78 3.21 3.19 2.89 2.48 2.85 3.04
Multiple Births
Spontaneous 32.33 33.73 29.83 33.62 26.30 28.23 25.51 25.83
Caesarean 47.23 50.31 52.74 49.49 58.33 55.82 60.44 59.78
Forceps 6 3.08 2.52 2.71 2.99 1.56 2.34 1.67 2.47
total Births
Spontaneous 64.46 63.76 63.22 62.41 61.20 59.56 59.00 58.79
Caesarean 20.43 21.32 22.04 22.43 24.17 25.19 25.93 25.39
Forceps 6 4.24 3.74 3.20 3.18 2.85 2.48 2.82 3.02
Booked Hospital
Admissions (%) 1 96.57 96.49 98.17 97.59 97.47 98.14 98.41 98.96
mothers Breastfeeding
(%) 7 36.16 38.41 39.13 41.14 41.32 42.46 44.13 44.45
infant’s Average Length of Stay in days 8
Singleton Births 4.17 4.08 3.89 3.68 3.62 3.55 3.52 3.47
multiple Births 10.68 10.73 11.45 10.16 10.09 10.59 10.14 9.85
Total Births 4.34 4.25 4.12 3.87 3.80 3.76 3.72 3.66
Post-mortems for early
Notes: These selected statistics are set out according to the order in which they appear in subsequent sections of this report. Further details for each statistic, including mortality rates, are given in these sections.
‘Not Stated’ or ‘Not Known’ values are not included in the calculation of percentages.
1 Based on maternities.
2 Data recording marital status as ‘never married’ are classified as ‘single’ marital status in this report. 3 Based on live births.
4 Based on maternities with live births.
5 Based on live births. These figures were not based on total maternities but on total births, to give a more accurate picture as
each infant in a multiple pregnancy can have a different method of delivery. See Tables 4.4 and 4.13 for data on all Methods of Delivery.
6 Excludes breech deliveries.
7 Based on maternities with live births. Excludes early neonatal deaths. 8 Based on live births. Excludes early neonatal deaths.
9 Based on early neonatal deaths.
Figure 2.1
Percentage of Single Mothers, 1999–2006
P
er
ce
nt
ag
e (
%
)
Year
29.73 30.09 30.14 30.01 30.20 30.63 30.71 31.53
0.0 5.0 10.0 15.0 20.0 25.0 30.0 35.0 40.0
1999 2000 2001 2002 2003 2004 2005 2006
Figure 2.2
Percentage of Births to Single Mothers by Age of Mother, Singleton Births, 1999–2006
P
er
ce
nt
ag
e (
%
)
Year
0.0 10.0 20.0 30.0 40.0 50.0 60.0 70.0 80.0 90.0 100.0
1999 2000 2001 2002 2003 2004 2005 2006
<20 Years 20–24 Years 25–29 Years 30–34 Years 35–39 Years 40+ Years
Source: Reports on Perinatal Statistics for 1999–2002, The Economic & Social Research Institute, Appendix E, Tables E3 Reports on Perinatal Statistics for 2003 and 2004, The Economic & Social Research Institute, Appendix F, Table F3 Report on Perinatal Statistics for 2005, The Economic & Social Research Institute, Appendix G, Table G3
Notes: See Appendix G, Table G3 for data on 2006.
Data recording marital status as ‘never married’ are classified as ‘single’ marital status in this report.
Figure 2.3
Low Birthweight Babies as Percentage of Total Live Births, 1999–2006
P
er
ce
nt
ag
e (
%
)
Year
4.99 4.87 5.17 4.94 5.07 4.98 5.02 5.01
0.0 1.0 2.0 3.0 4.0 5.0 6.0
Figure 2.4
Average Length of Stay in Days for Mothers and Infants, 1999–2006
P
er
ce
nt
ag
e (
%
)
Year
4.71
4.34 4. 54
4.25 4. 38
4.12 4.09
3.87 3.95 3.80 3.85 3.76 3.84
3.72 3.72 3.66
Mother
0.0 1.0 2.0 3.0 4.0 5.0
1999 2000 2001 2002 2003 2004 2005 2006
Infant
Note: Data on mother’s length of stay are based on maternities with live births only. Data on infant’s length of stay are based on live births, excluding early neonatal deaths.
Figure 2.5
Caesarean Births as a Percentage of Total Live Births, 1999–2006
P
er
ce
nt
ag
e (
%
)
Year
20.43 21.32
22.04 22.43
24.17 25.19 25.39
25.93
0.0 5.0 10.0 15.0 20.0 25.0 30.0
Figure 2.6
Percentage of Mothers Breastfeeding, 1999–2006
P
er
ce
nt
ag
e (
%
)
Year
36.16
38.41 39.13
41.14 41.32
44.45 42.46 44.13
0.0 5.0 10.0 15.0 20.0 25.0 30.0 35.0 40.0 45.0 50.0
1999 2000 2001 2002 2003 2004 2005 2006
SeCtioN
introduction
Table 3.1
Age of Mother
Live Births, Stillbirths, Early Neonatal Deaths, and Mortality Rates, 2006 Singleton Births
Age of
Mother Live Births per Cent (%) Live Births
Stillbirths Stillbirth
Rate Neonatal early Deaths
early Neonatal Mortality
Rate
perinatal Mortality
Rate
Adjusted pMR
Under 15
years 11 0.0 0 0.0 0 0.0 0.0 0.0
15–19 years 2,297 3.6 18 7.8 6 2.6 10.4 9.1
20–24 years 8,248 13.0 44 5.3 17 2.1 7.4 5.6
25–29 years 14,768 23.2 53 3.6 38 2.6 6.1 4.5
30–34 years 21,661 34.1 78 3.6 40 1.8 5.4 4.3
35–39 years 13,835 21.8 59 4.2 23 1.7 5.9 3.8
40–44 years 2,607 4.1 25 9.5 5 1.9 11.4 7.6
45 years and
over 90 0.1 1 11.0 0 0.0 11.0 11.0
not Stated 38 0.1 6 136.4 0 0.0 136.4 136.4
Total 63,555 100 284 4.4 129 2.0 6.5 4.8
Table 3.2
Maternal Parity
Live Births, Stillbirths, Early Neonatal Deaths, and Mortality Rates, 2006 Singleton Births
Maternal
parity Live Births per Cent (%) Live Births
Stillbirths Stillbirth
Rate Neonatal early Deaths
early Neonatal Mortality
Rate
perinatal Mortality
Rate
Adjusted pMR
0 26,141 41.1 149 5.7 57 2.2 7.8 6.1
1 20,294 31.9 60 2.9 34 1.7 4.6 2.9
2 10,792 17.0 38 3.5 18 1.7 5.2 3.6
3 4,046 6.4 22 5.4 10 2.5 7.9 6.4
4 1,370 2.2 9 6.5 5 3.6 10.2 8.7
5 489 0.8 4 8.1 3 6.1 14.2 12.2
6 221 0.3 0 0.0 0 0.0 0.0 0.0
more than 6 188 0.3 2 10.5 2 10.6 21.1 15.9
not Stated 14 0.0 0 0.0 0 0.0 0.0 0.0
Total 63,555 100 284 4.4 129 2.0 6.5 4.8
Figure 3.1
Perinatal Mortality Rates by Age of Mother, 2006 Singleton Births
Perinatal Mor
tality R
ate (P
er 1,000 Live Bir
ths and Stillbir
ths)
Age of Mother
0.0 2.0 4.0 6.0 8.0 10.0 12.0
15–19 Years 20–24 Years 25–29 Years 30–34 Years 35–39 Years 40–44 Years Perinatal Mortality Rate Adjusted PMR
Notes: See Table 3.1 for data. The adjusted rate excludes all deaths due to congenital anomalies. Categories where rates would be based on <100 live births are not included in this graph.
Figure 3.2
Percentage Distribution of Parity by Age of Mother, 2006 Singleton Births
Percentage (%)
Age of Mother
0% 20% 40% 60% 80% 100%
Under 15
Years 15–19Years 20–24Years 25–29Years 30–34Years 35–39Years 40–44Years 45 Yearsand Over More than 6
6 5 4 3 2 0 1
Table 3.3
Mother’s Marital Status
Live Births, Stillbirths, Early Neonatal Deaths, and Mortality Rates, 2006 Singleton Births
Mother’s Marital Status
Live Births per Cent (%) Live Births
Stillbirths Stillbirth
Rate Neonatal early Deaths
early Neonatal Mortality
Rate
perinatal Mortality
Rate
Adjusted pMR
married 42,253 66.5 172 4.1 83 2.0 6.0 4.3
never married 20,106 31.6 108 5.3 45 2.2 7.6 5.9
Widowed 102 0.2 1 9.7 0 0.0 9.7 9.7
Separated 693 1.1 3 4.3 1 1.4 5.7 4.3
divorced 365 0.6 0 0.0 0 0.0 0.0 0.0
not Stated 36 0.1 0 0.0 0 0.0 0.0 0.0
Total 63,555 100 284 4.4 129 2.0 6.5 4.8
Note: Data recording marital status as ‘never married’ are classified as ‘single’ marital status in this report.
Figure 3.3
Mother’s Age: Percentage Distribution of Births for Married and Single Status, 2006 Singleton Births
Percentage (%)
Age of Mother
Married Single
0.0 10.0 20.0 30.0 40.0 50.0
< 20 Years 20–24 Years 25–29 Years 30–34 Years 35–39 Years 40+ Years
Table 3.4
Father’s Occupation
Live Births, Stillbirths, Early Neonatal Deaths, and Mortality Rates, 2006 Singleton Births
Father’s occupation Live
Births per Cent (%) Live Births
Stillbirths Stillbirth
Rate Neonatal early Deaths
early Neonatal Mortality
Rate
perinatal Mortality
Rate
Adjusted pMR
Farmers & Farm managers 2,077 3.3 7 3.4 2 1.0 4.3 2.4
other Agricultural occupations
& Fishermen 813 1.3 3 3.7 3 3.7 7.4 3.7
Higher Professional 4,676 7.4 25 5.3 11 2.4 7.7 5.1
Lower Professional 2,879 4.5 9 3.1 5 1.7 4.8 3.5
employers & managers 5,039 7.9 13 2.6 9 1.8 4.4 3.4
Salaried employees 1,267 2.0 3 2.4 1 0.8 3.1 1.6
intermediate non-manual Workers 4,857 7.6 23 4.7 10 2.1 6.8 4.3
other non-manual Workers 5,444 8.6 26 4.8 9 1.7 6.4 5.9
Skilled manual Workers 14,155 22.3 54 3.8 30 2.1 5.9 4.3
Semi-Skilled manual Workers 2,498 3.9 9 3.6 5 2.0 5.6 4.8
Unskilled manual Workers 609 1.0 6 9.8 0 0.0 9.8 9.8
Unemployed 1,843 2.9 8 4.3 12 6.5 10.8 8.7
not Classifiable 1,422 2.2 8 5.6 0 0.0 5.6 3.5
not Applicable 15,283 24.0 80 5.2 28 1.8 7.0 5.3
Home duties 123 0.2 0 0.0 0 0.0 0.0 0.0
not Stated 570 0.9 10 17.2 4 7.0 24.1 19.1
Total 63,555 100 284 4.4 129 2.0 6.5 4.8
Figure 3.4
Perinatal Mortality Rates by Father’s Occupation, 2006 Singleton Births
Perinatal Mortality Rate (Per 1,000 Live Births and Stillbirths)
Fa
th
er
’s O
cc
up
at
io
n
0.0 2.0 4.0 6.0 8.0 10.0 12.0
Farmers & Farm Managers
Other Agricultural Occupations & Fishermen
Higher Professional
Lower Professional
Employers & Managers
Salaried Employees
Intermediate Non-Manual Workers
Other Non-Manual Workers
Skilled Manual Workers
Semi-Skilled Manual Workers
Unskilled Manual Workers
Unemployed
Not Classifiable
Not Applicable
Perinatal Mortality Rate Adjusted PMR
Table 3.5
Mother’s Occupation
Live Births, Stillbirths, Early Neonatal Deaths, and Mortality Rates, 2006 Singleton Births
Mother’s occupation Live
Births per Cent (%) Live Births
Stillbirths Stillbirth
Rate Neonatal early Deaths
early Neonatal Mortality
Rate
perinatal Mortality
Rate
Adjusted pMR
Farmers & Farm managers 66 0.1 0 0.0 0 0.0 0.0 0.0
other Agricultural occupations &
Fishermen 130 0.2 0 0.0 0 0.0 0.0 0.0
Higher Professional 3,726 5.9 20 5.3 5 1.3 6.7 3.7
Lower Professional 8,364 13.2 23 2.7 16 1.9 4.7 2.7
employers & managers 4,479 7.0 16 3.6 5 1.1 4.7 3.8
Salaried employees 1,006 1.6 3 3.0 4 4.0 6.9 6.0
intermediate non-manual Workers 14,579 22.9 54 3.7 30 2.1 5.7 3.9
other non-manual Workers 7,615 12.0 30 3.9 12 1.6 5.5 4.3
Skilled manual Workers 1,168 1.8 1 0.9 1 0.9 1.7 0.9
Semi-Skilled manual Workers 2,254 3.5 14 6.2 4 1.8 7.9 6.2
Unskilled manual Workers 6 0.0 0 0.0 0 0.0 0.0 0.0
Unemployed 2,643 4.2 14 5.3 5 1.9 7.2 6.0
not Classifiable 2,689 4.2 23 8.5 4 1.5 10.0 8.5
Home duties 14,600 23.0 81 5.5 43 2.9 8.4 6.6
not Stated 230 0.4 5 21.3 0 0.0 21.3 21.3
Total 63,555 100 284 4.4 129 2.0 6.5 4.8
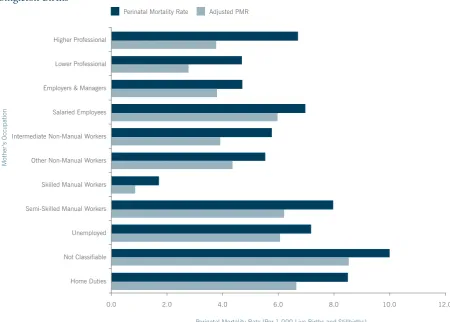
Figure 3.5
Perinatal Mortality Rates by Mother’s Occupation, 2006 Singleton Births
Perinatal Mortality Rate (Per 1,000 Live Births and Stillbirths)
Mother
’s Occupation
Perinatal Mortality Rate Adjusted PMR
0.0 2.0 4.0 6.0 8.0 10.0 12.0
Higher Professional
Lower Professional
Employers & Managers
Salaried Employees
Intermediate Non-Manual Workers
Other Non-Manual Workers
Skilled Manual Workers
Semi-Skilled Manual Workers
Unemployed
Not Classifiable
Home Duties
[image:43.595.86.537.152.474.2]Notes: See Table 3.5 for data. The adjusted rate excludes all deaths due to congenital anomalies. Categories where rates would be based on <100 live births are not included in this graph.
Table 3.6
Number of Previous Stillbirths (for women having second and subsequent births) Live Births, Stillbirths, Early Neonatal Deaths, and Mortality Rates, 2006 Singleton Births
previous Stillbirths Live Births per Cent (%) Live Births
Stillbirths Stillbirth
Rate Neonatal early Deaths
early Neonatal Mortality
Rate
perinatal Mortality
Rate
Adjusted pMR
0 36,814 98.4 129 3.5 70 1.9 5.4 3.7
1 536 1.4 6 11.1 2 3.7 14.8 14.8
2 34 0.1 0 0.0 0 0.0 0.0 0.0
3 and over 17 0.0 0 0.0 0 0.0 0.0 0.0
not Stated 13 0.0 0 0.0 0 0.0 0.0 0.0
Total 37,414 100 135 3.6 72 1.9 5.5 3.9
Table 3.7
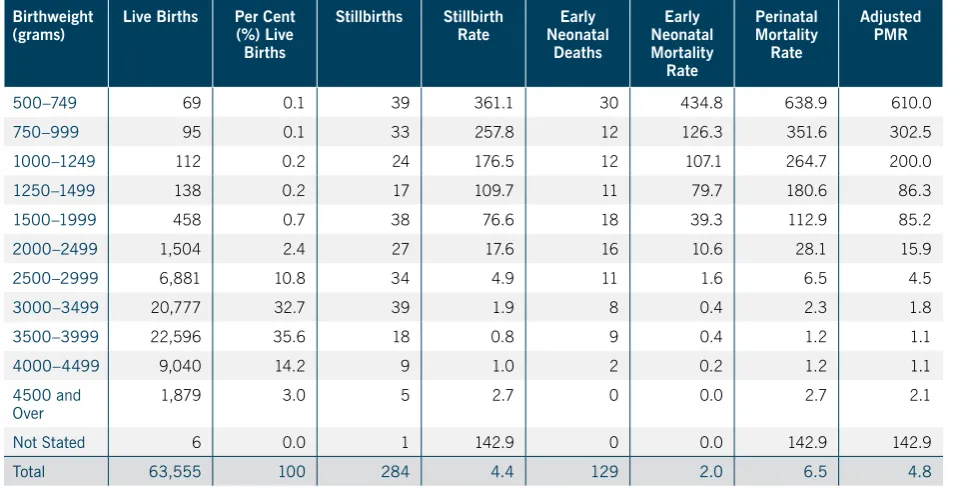
Birthweight – All Singleton Births
Live Births, Stillbirths, Early Neonatal Deaths, and Mortality Rates, 2006
Birthweight
(grams) Live Births per Cent (%) Live Births
Stillbirths Stillbirth
Rate Neonatal early Deaths
early Neonatal Mortality
Rate
perinatal Mortality
Rate
Adjusted pMR
500–749 69 0.1 39 361.1 30 434.8 638.9 610.0
750–999 95 0.1 33 257.8 12 126.3 351.6 302.5
1000–1249 112 0.2 24 176.5 12 107.1 264.7 200.0
1250–1499 138 0.2 17 109.7 11 79.7 180.6 86.3
1500–1999 458 0.7 38 76.6 18 39.3 112.9 85.2
2000–2499 1,504 2.4 27 17.6 16 10.6 28.1 15.9
2500–2999 6,881 10.8 34 4.9 11 1.6 6.5 4.5
3000–3499 20,777 32.7 39 1.9 8 0.4 2.3 1.8
3500–3999 22,596 35.6 18 0.8 9 0.4 1.2 1.1
4000–4499 9,040 14.2 9 1.0 2 0.2 1.2 1.1
4500 and
over 1,879 3.0 5 2.7 0 0.0 2.7 2.1
not Stated 6 0.0 1 142.9 0 0.0 142.9 142.9
[image:44.595.75.512.516.724.2]Total 63,555 100 284 4.4 129 2.0 6.5 4.8
Figure 3.6
Percentage Distribution of Live Births across Birthweight Groups, 2006 Singleton Births
Birthweight Groups (grams)
Percentage (%)
Females Males
0.0 10.0 20.0 30.0 40.0
500– 749
750– 999
1000–
1249 1250–1499 1500–1999 2000–2499 2500–2999 3000–3499 3500–3999 4000–4499 and over4500
Notes: See Tables 3.8 and 3.9 for data.
Table 3.8
Birthweight – Males
Live Births, Stillbirths, Early Neonatal Deaths, and Mortality Rates, 2006 Singleton Births
Birthweight
(grams) Live Births per Cent (%) Live Births
Stillbirths Stillbirth
Rate Neonatal early Deaths
early Neonatal Mortality
Rate
perinatal Mortality
Rate
Adjusted pMR
500–749 34 0.1 16 320.0 20 588.2 720.0 681.8
750–999 58 0.2 16 216.2 9 155.2 337.8 279.4
1000–1249 64 0.2 14 179.5 5 78.1 243.6 191.8
1250–1499 68 0.2 10 128.2 8 117.6 230.8 142.9
1500–1999 234 0.7 13 52.6 11 47.0 97.2 59.1
2000–2499 712 2.2 13 17.9 12 16.9 34.5 18.2
2500–2999 2,988 9.1 15 5.0 5 1.7 6.7 4.3
3000–3499 9,679 29.6 20 2.1 5 0.5 2.6 2.1
3500–3999 12,154 37.1 11 0.9 7 0.6 1.5 1.3
4000–4499 5,491 16.8 5 0.9 2 0.4 1.3 1.1
4500 and over 1,243 3.8 4 3.2 0 0.0 3.2 2.4
not Stated 4 0.0 1 200.0 0 0.0 200.0 200.0
Total 32,729 100 138 4.2 84 2.6 6.8 4.8
Note: The 2006 data set includes four singleton births for which the sex was recorded as ‘indeterminate’. These births are excluded from Tables 3.8 and 3.9.
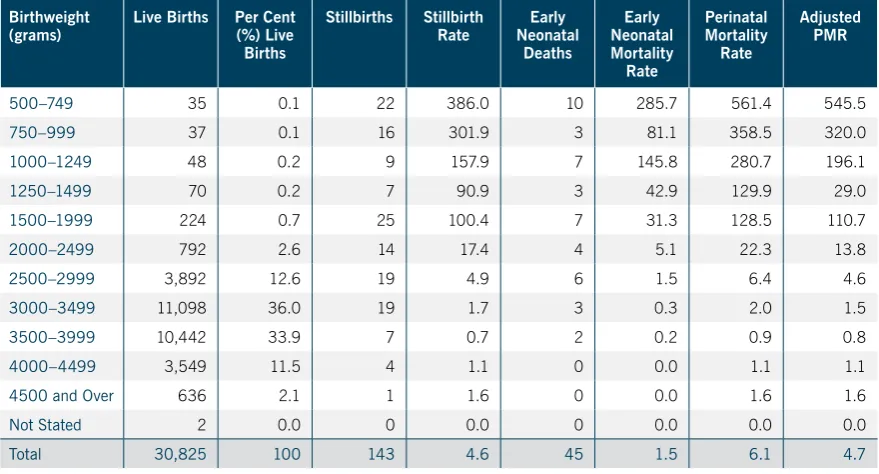
Table 3.9
Birthweight – Females
Live Births, Stillbirths, Early Neonatal Deaths, and Mortality Rates, 2006 Singleton Births
Birthweight
(grams) Live Births per Cent (%) Live Births
Stillbirths Stillbirth
Rate Neonatal early Deaths
early Neonatal Mortality
Rate
perinatal Mortality
Rate
Adjusted pMR
500–749 35 0.1 22 386.0 10 285.7 561.4 545.5
750–999 37 0.1 16 301.9 3 81.1 358.5 320.0
1000–1249 48 0.2 9 157.9 7 145.8 280.7 196.1
1250–1499 70 0.2 7 90.9 3 42.9 129.9 29.0
1500–1999 224 0.7 25 100.4 7 31.3 128.5 110.7
2000–2499 792 2.6 14 17.4 4 5.1 22.3 13.8
2500–2999 3,892 12.6 19 4.9 6 1.5 6.4 4.6
3000–3499 11,098 36.0 19 1.7 3 0.3 2.0 1.5
3500–3999 10,442 33.9 7 0.7 2 0.2 0.9 0.8
4000–4499 3,549 11.5 4 1.1 0 0.0 1.1 1.1
4500 and over 636 2.1 1 1.6 0 0.0 1.6 1.6
not Stated 2 0.0 0 0.0 0 0.0 0.0 0.0
Total 30,825 100 143 4.6 45 1.5 6.1 4.7
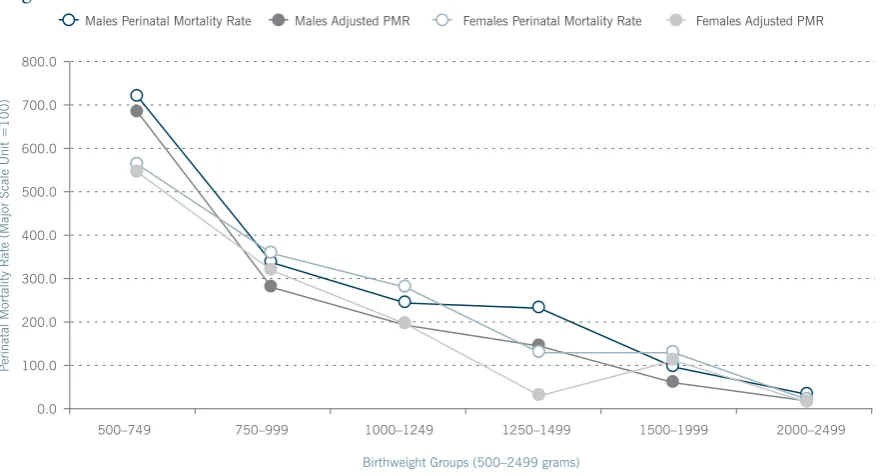
[image:45.595.85.525.556.793.2](A) Figure 3.7
Perinatal Mortality Rate for Males and Females by Birthweight (500–2499 grams), 2006 Singleton Births
Birthweight Groups (500–2499 grams)
Perinatal Mor
tality R
ate (Major Scale Unit =100)
Males Perinatal Mortality Rate Males Adjusted PMR Females Perinatal Mortality Rate Females Adjusted PMR
0.0 100.0 200.0 300.0 400.0 500.0 600.0 700.0 800.0
500–749 750–999 1000–1249 1250–1499 1500–1999 2000–2499
Notes: See Tables 3.8 and 3.9 for data.
Figure 3.7(A) does not include four singleton births for which sex was recorded as ‘indeterminate’.
Figure 3.7 (B)
Perinatal Mortality Rate for Males and Females by Birthweight (2500–4500 grams and over), 2006 Singleton Births
Birthweight Groups (2500–4500 grams and over)
Perinatal Mor
tality R
ate (Major Scale Unit =1)
Males Perinatal Mortality Rate Males Adjusted PMR Females Perinatal Mortality Rate Females Adjusted PMR
0.0 1.0 2.0 3.0 4.0 5.0 6.0 7.0
2500–2999 3000–3499 3500–3999 4000–4499 4500 and Over
Notes: See Tables 3.8 and 3.9 for data.
Table 3.10
Gestational Age at Delivery
Live Births, Stillbirths, Early Neonatal Deaths, and Mortality Rates, 2006 Singleton Births
Gestational
Age (weeks) Live Births per Cent (%) Live Births
Stillbirths Stillbirth
Rate Neonatal early Deaths
early Neonatal Mortality
Rate
perinatal Mortality
Rate
Adjusted pMR
Less than 22 4 0.0 2 333.3 3 750.0 833.3 833.3
22–27 151 0.2 43 221.6 44 291.4 448.5 421.6
28–31 317 0.5 56 150.1 17 53.6 195.7 154.9
32–36 2,336 3.7 76 31.5 34 14.6 45.6 27.5
37–41 58,299 91.7 101 1.7 29 0.5 2.2 1.7
42 and over 2,424 3.8 4 1.6 2 0.8 2.5 1.2
not Stated 24 0.0 2 76.9 0 0.0 76.9 76.9
Total 63,555 100 284 4.4 129 2.0 6.5 4.8
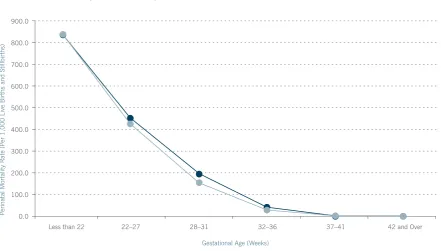
Figure 3.8
Perinatal Mortality Rates by Gestational Age, 2006 Singleton Births
Gestational Age (Weeks)
Perinatal Mor
tality R
ate (P
er 1,000 Live Bir
ths and Stillbir
ths)
Perinatal Mortality Rate Adjusted PMR
0.0 100.0 200.0 300.0 400.0 500.0 600.0 700.0 800.0 900.0
Less than 22 22–27 28–31 32–36 37–41 42 and Over