Original Article
Serum betatrophin level increased in subjects with
nonalcoholic fatty liver disease
Jinzhou Zhu1*, Chunxiao Li1*, Yining Dai1, Zhiyun Fang1, Dejian Zhao2, Huatuo Zhu1, Xingyong Wan1, Yuming Wang1, Chaohui Yu1, Youming Li1
Departments of 1Gastroenterology, 2Laboratory Medicine, The First Affiliated Hospital, College of Medicine,
Zhe-jiang University, Hangzhou, China. *Equal contributors.
Received December 1, 2015; Accepted February 29, 2016; Epub March 15, 2016; Published March 30, 2016
Abstract: Background: Betatrophin is a novel adipokine/hepatokine that promotes pancreatic β-cell proliferation and regulates lipid metabolism. Aims: This study is to evaluate the role of serum betatrophin in nonalcoholic fatty liv-er disease (NAFLD). Methods: A hospital-based age-/gendliv-er-/Body Mass Index-matched case-control study of 194 subjects was conducted in Hangzhou, China. Serum level of Betatrophin was measured and validated by enzyme-linked immunosorbent assay and western blotting. The serum levels of 12 adipokines were evaluated by commer-cial Adipokine Magnetic Bead Panel kits. Statistical analyses included receiver operating characteristic (ROC) curve, bivariate correlation, and multivariate stepwise linear regression. Results: Serum Betatrophin witnessed a higher level in NAFLD patients (1094.98 ± 541.31 pg/mL, P < 0.001), compared with controls (730.03 ± 431.10 pg/mL). Compared with the lowest tertile of serum Betatrophin level, the highest tertile indicated an association with higher odds of NAFLD (adjusted Odds Ratio = 2.012, 95% Confidence interval [CI] [1.285-3.148], P = 0.002). ROC curve of Betatrophin was developed to predict the presence of NAFLD (Area under ROC = 0.702 [95% CI 0.628-0.777t, P < 0.001). Furthermore, Betatrophin correlated with several parameters, including age, Waist-to-hip ratio, Fasting plasma glucose, Haemoglobin A1C, Homeostasis model assessment of insulin resistance, and Fasting C Peptide, and various adipokines, including Resistin, Interleukin-8, and tumor necrosis factor-α. Conclusions: Serum Betatro-phin level increased in subjects with NAFLD and was associate with parameters of β-cell function and inflammation.
Keywords: Betatrophin, angiopoeitin-like 8 (ANGPTL8), adipokine, nonalcoholic fatty liver disease (NAFLD), case-control
Introduction
The global prevalence of obesity-related meta-bolic disorders is mounting to epidemic propor-tions [1-3]. Obesity, insulin resistance (IR), hyperglycemia, dyslipidemia and hypertension are often coincident in one individual, a disor-der known as Metabolic Syndrome (MetS) [4]. As one of the most prevalent chronic liver dis-eases in the world now, nonalcoholic fatty liver disease (NAFLD), regarded as the hepatic mani-festation of IR and MetS, is best characterized by aberrant lipid deposition in the hepatocytes [5].
In 2013, Yi et al. [6] identified Betatrophin, encoded by Gm6484 in mice/C19 or f80 in human and also known as angiopoeitin-like 8 (ANGPTL8)/Lipasin/refeeding-induced fat and
liver protein (RIFL), is a 22-kDa novel hormone provokes a significant pancreatic beta cells pro-liferation and expand beta cells mass in a IR mice model. Meanwhile, more evidences sup-port a close association between Betatrophin and lipid metabolism. Quagliarini et al. [7] revealed that Betatrophin (named ANGPTL8) regulates postprandial triglyceride (TG) and fatty acid metabolism, associated with a higher activity of lipoprotein lipase (LPL) and a reduced secretion of Very Low-density lipoprotein (VLDL) [8]. Furthermore, Zhang et al. showed that the expression of Betatrophin in brown adipose dramatically increased when exposed to the cold environment or high-fat diet, however downregulated in fasting [9].
inves-tigate the role of Betatrophin in obesity-related metabolic disorders, e.g. diabetes and over-weight/obesity [10-14]. This hospital-based case-control study was conducted, for the first time, to evaluate the role of serum Betatrophin in NAFLD.
Subjects and methods
Subjects
A total of 92 NAFLD patients were consecutive-ly recruited from the subjects who attended to the outpatient department of the First Affiliated Hospital, Zhejiang University from January to May 2015. Based on a principle of age-, gen-der- and Body Mass Index (BMI)-match, 92 con-trols were selected from the annual health examination during the same period. Partici- pants were excluded if they had malignant tumor, severe cardiopulmonary disorders, renal/thyroid dysfunction, severe inflammatory diseases, viral/drug-induced/autoimmune liver diseases, pregnancy, or excessively alcoholic consumption. All subjects gave written informed consent before participation. This study was approved by the Ethics Committee of the First Affiliated Hospital, Zhejiang University, in accor-dance with the Helsinki Declaration in 1975.
Anthropometric and biochemical examinations and ultrasonography
Anthropometric and biochemical examinations as well as upper abdominal ultrasonography, were performed as described before [15].
Measurement of serum betatrophin
Serum Betatrophin was evaluated using a com-mercial enzyme-linked immunosorbent assay (ELISA) (Catalogue No. E11644h; N-terminus; Wuhan Eiaab Science, Wuhan, China; Intra-assay coefficient of variation (CV) < 4.8%; Interassay CV < 7.2%) [12]. Serum levels were validated by another ELISA kit (Catalogue No. SEW803Hu; USCN Life science Inc., Wuhan, China; Intra-assay CV < 10%; Interassay CV < 12%) [14] and western blotting (Anti-C19 or f80, N-terminus, Catalogue No. ab180915; Abcam Ltd., Cambridge, UK and β-Actin Rabbit mAb, Catalogue No. 8457; Cell Signaling Technology, Inc., Danvers, MA) [16].
MILLIPLEX® human adipokine magnetic bead
panel kits
The MILLIPLEX® Human Adipokine Magnetic Bead Panels were performed to evaluate twelve serum adipokines, according to the manufac-turer’s protocol (Cat. # HADK1MAG-61K and Cat. # HADK2MAG-61K).
Definition of NAFLD
NAFLD was diagnosed base on the guidelines for diagnosis and treatment of NAFLD issued by Fatty Liver and Alcoholic Liver Disease Study Group of the Chinese Liver Disease Association [17, 18].
Statistical methods
Heinrich-Heine-Universität Düsseldorf, Germany) [19]. A two-sided P < 0.05 was considered statistically significant.
Results
Validation of ELISA
The validation of Betatrophin levels presented a fine consistency (r = 0.8155, P < 0.001) be- tween two ELISA kits (Supplementary Figure 1). Representative western blot detection of Betatrophin in four serum samples revealed a consistent trend with the ELISA result (Supplementary Figure 2).
Power of sample size
Given the serum Betatrophin concentrations and the numbers of the case and the control, the power of the sample size was 0.999 (Effect size d = 0.746, Critical t = 1.973, Supplementary Figure 3).
Characteristics of all subjects
The characteristics of 184 participants (92 cases and 92 age-/gender-/BMI-matched con-trols) are presented in Table 1.
Serum Betatrophin witnessed a higher level in NAFLD patients (1094.98 ± 541.31 pg/mL, P < 0.001), compared with controls (730.03 ± 431.10 pg/mL, Table 1; Figure 1A). Further-
more, there was no difference of serum Betatrophin level between female (840.24 ± 433.18 pg/mL) and male (951.05 ± 556.23 pg/mL, P = 0.170, Figure 1B).
Betatrophin tertiles
All 184 subjects were divided into 3 groups, according to the tertiles of serum Betatrophin concentrations. The frequency of NAFLD showed an upward trend (T1: 31.1%, T2: 50.8%, and T3: 67.7%, P < 0.001), as Betatrophin con-centration increased among its tertiles (Figure 1C).
Odds ratios of NAFLD
Table 2 reveals that compared with the 1st ter-tile, the 2nd of Betatrophin indicated no associa-tion with the presence of NAFLD (adjusted OR = 2.218, 95% CI [0.933-5.271], P = 0.071), after controlling age, gender, BMI, Waist-to-hip ratio (WHR), and parameters of liver enzymes and lipid metabolism. However, the 3rd tertile revealed its association with higher odds of NAFLD (adjusted OR = 2.012, 95% CI [1.285-3.148], P = 0.002), in comparison with the 1st tertile.
ROC curve of Betatrophin
ROC curve of Betatrophin was developed to predict the presence of NAFLD (Figure 1D). Area under ROC was 0.702 ([95% CI 0.628-Table 1. Characteristics of subjects according to NAFLD
Parameters Control NAFLD P value
No. of subjects 92 92
Age (years) 53.10 ± 10.06 55.07 ± 12.02 0.230
Male, n (%) 60, 65.2% 60, 65.2% 1.000
Overweight & Obesity, n, n (%, %) 35, 2 (38.0%, 2.2%) 27, 9 (29.3%, 9.8%) 0.64
Type 1 Diabetes, n, (%) 0, 0% 71, 77.2% < 0.001#
BMI (kg/m2) 24.40 ± 3.00 24.70 ± 3.88 0.552
WHR 0.892 ± 0.087 0.925 ± 0.062 0.004#
Betatrophin (pg/ml) 730.03 ± 431.10 1094.98 ± 541.31 < 0.001#
FPG (mmol/L) 5.02 (4.64-5.54) 7.09 (5.67-9.56) < 0.001#
HbA1c (%) 5.75 (5.40-6.20) 8.55 (6.83-10.50) < 0.001#
FINS (μU/mL) 12.25 (9.54-16.40) 13.10 (8.88-19.90) 0.383
HOMA-IR 2.67 (2.08-3.91) 4.12 (2.59-6.72) < 0.001#
Fasting C Peptide (ng/ml) 0.940 (0.580-1.355) 1.005 (0.670-1.648) 0.256
AFP (μg/L) 2.50 (1.80-3.50) 2.40 (1.80-3.10) 0.434
Data are mean ± SD or median (interquartile range) for continuous variables; AFP, Alpha-fetoprotein; FINS, Fasting insulin; #P
[image:3.629.100.535.92.293.2]0.777], P < 0.001), with the sensitivity of 78.26%, the specificity of 55.43% and the accuracy of 66.85%, when cut-off value of Betatrophin was 690.33 pg/mL.
Correlations with anthropometric/biochemical parameters and adipokines
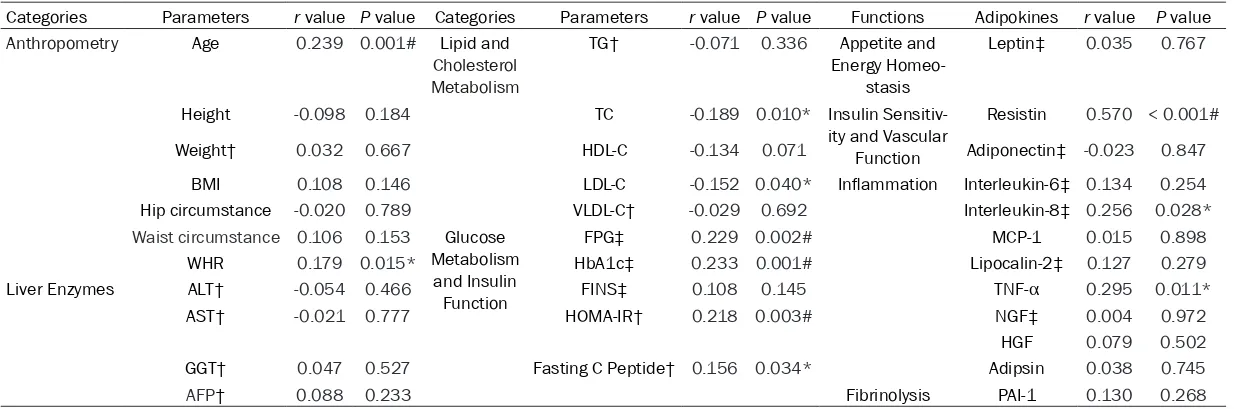
In Table 3, all subjects witnessed positive asso-ciations of Betatrophin with age (r = 0.239, P = 0.001) and WHR (r = 0.179, P = 0.015).
[image:4.629.103.526.84.382.2]In terms of lipid and cholesterol metabolism, Betatrophin presented inverse associations with Total cholesterol (TC) (r = -0.189, P = 0.010) and LDL cholesterol (LDL-C) (r = -0.152, P = 0.040), whereas Betatrophin correlated positively with Fasting plasma glucose (FPG) (r = 0.229, P = 0.002), Haemoglobin A1C (HbA1c) (r = 0.233, P = 0.001), Homeostasis model assessment of insulin resistance (r = 0.218, P = 0.003), and Fasting C Peptide (r = 0.156, P = Figure 1. A: Comparisons of serum betatrophin levels (pg/ml, mean ± SD) between Control (730.03 ± 431.10) and NAFLD (1094.98 ± 541.31), P < 0.001; B: Comparisons of serum betatrophin levels (pg/ml, mean ± SD) between female (840.24 ± 433.18) and male (951.05 ± 556.23), P = 0.170; C: Frequency (%) of NAFLD according to betatro-phin tertiles (T1: 31.1%, T2: 50.8%, and T3: 67.7%, P < 0.001). D: ROC curve of betatrobetatro-phin to predict the presence of NAFLD (AUROC 0.702 [95% CI 0.628-0.777], P < 0.001).
Table 2. ORs and 95% CIs of the presence of NAFLD by betatrophin tertiles
Tertile 1 Tertile 2 P for trend Tertile 3 P for trend
NAFLD Model 1 Reference 2.284 (1.091-4.781) 0.028* 2.155 (1.474-3.150) < 0.001# Model 2 Reference 2.304 (1.089-4.875) 0.029* 2.090 (1.408-3.102) < 0.001#
Model 3 Reference 1.976 (0.906-4.308) 0.087 1.955 (1.303-2.934) 0.001#
Model 4 Reference 2.223 (0.980-5.043) 0.056 1.963 (1.291-2.985) 0.002#
Model 5 Reference 2.218 (0.933-5.271) 0.071 2.012 (1.285-3.148) 0.002#
[image:4.629.97.533.480.561.2]Table 3. Correlations of serum betatrophin with various anthropometric/biochemical parameters and adipokines
Categories Parameters r value P value Categories Parameters r value P value Functions Adipokines r value P value
Anthropometry Age 0.239 0.001# Lipid and
Cholesterol Metabolism
TG† -0.071 0.336 Appetite and
Energy Homeo-stasis
Leptin‡ 0.035 0.767
Height -0.098 0.184 TC -0.189 0.010* Insulin
Sensitiv-ity and Vascular Function
Resistin 0.570 < 0.001#
Weight† 0.032 0.667 HDL-C -0.134 0.071 Adiponectin‡ -0.023 0.847
BMI 0.108 0.146 LDL-C -0.152 0.040* Inflammation Interleukin-6‡ 0.134 0.254
Hip circumstance -0.020 0.789 VLDL-C† -0.029 0.692 Interleukin-8‡ 0.256 0.028*
Waist circumstance 0.106 0.153 Glucose Metabolism
and Insulin Function
FPG‡ 0.229 0.002# MCP-1 0.015 0.898
WHR 0.179 0.015* HbA1c‡ 0.233 0.001# Lipocalin-2‡ 0.127 0.279
Liver Enzymes ALT† -0.054 0.466 FINS‡ 0.108 0.145 TNF-α 0.295 0.011*
AST† -0.021 0.777 HOMA-IR† 0.218 0.003# NGF‡ 0.004 0.972
HGF 0.079 0.502
GGT† 0.047 0.527 Fasting C Peptide† 0.156 0.034* Adipsin 0.038 0.745
AFP† 0.088 0.233 Fibrinolysis PAI-1 0.130 0.268
†lg(x) transformation was performed because of a skewed distribution; ‡Spearman correlation analysis; AFP, Alpha-fetoprotein; ALT, Alanine transaminase; AST, Aspartate transami
0.034), which are parameters of glucose metabolism and insulin sensitivity.
Table 3 also reveals the associations between Betatrophin and adipokines, including Resistin (r = 0.570, P < 0.001), Interleukin-8 (r = 0.256, P = 0.028), and Tumor necrosis factor-α (r = 0.295, P = 0.011).
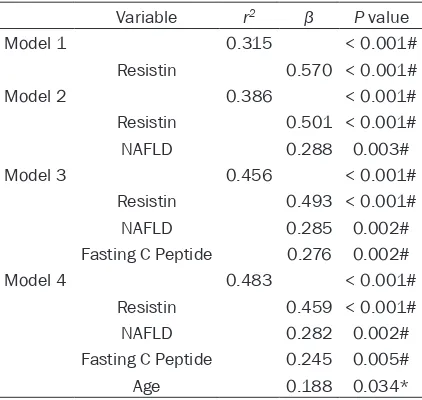
Multivariate linear regression
In the multiple linear regression analysis (Table 4), the model (corrected r2 = 0.483, P < 0.001) that best predicted Betatrophin levels included Resistin, age, fasting C peptide and NAFLD as predictive variables.
Discussion
This case-control study found that there was a higher serum level of Betatrophin in subjects with NAFLD, compared with controls. Further- more, serum Betatrophin levels presented a positive association with the presence of NAFLD. Additionally, Betatrophin correlated a series of parameters concerned glucose and lipid metabolism. It also reveals the correla-tions between Betatrophin and three adipo-kines, i.e.Resistin, Interleukin-8, and TNF-α. Lastly, it found serum level of Betatrophin was dependent on age, Fasting C Peptide, Resistin and NAFLD.
NAFLD is regarded as the hepatic manifesta-tion of IR and dyslipidemia [5], while Betatro- phin is identified as an adipokine/hepatokine related to the function of pancreatic islets and the regulation of lipid metabolism [6, 7, 20, 21]. Thus, we conducted a case-control study to evaluate the hypothesis that serum Betatrophin related to NAFLD.
First of all, we found that serum Betatrophin presented a higher level in subjects with NAFLD, in comparison with controls. Meanwhile, a high-er level of Betatrophin was found to be associ-ated with the presence of NAFLD.
[image:6.629.99.310.104.304.2]Interestingly, our results revealed a positive association between age and serum Beta- trophin level. Even though evidence supports a declined rate of beta cells replication with age in both rodent and human [22], an autopsy study of 167 non-diabetic subjects with a large age spectrum by Saisho et al. [23] revealed that the mean nuclear diameter of beta cells increased with age and the amount of apoptot-ic beta cells was constant. The correlation between age and circulating Betatrophin level, thus, may represent a compensatory mecha-nism in response to aging. Besides, serum level of Betatrophin witnessed a correlation with WHR that is a widely accepted parameter of central obesity and an indicator of NAFLD risk [24, 25].
In terms of glucose metabolism and insulin sensitivity, the correlations were observed between Betatrophin and multipleparameters, i.e. FPG, HbA1c, HOMA-IR and Fasting C Peptide, besides Resistin, a well-studied adipo-kines related toIR [26]. Higher serum levels of Betatrophin in subjects with NAFLD may be attributable to a defensive regulation, which might lead to an adaption to hepatic IR or ele-vated plasma glucose, via promoting beta cells proliferation and insulin secretion [13].
More evidence supports that Betatrophin involved in lipid metabolism, possibly via regu-lating VLDL secretion and LPL activity [7, 21, 27-29]. Our study also suggests close associa-tions of Betatrophin with serum TC and LDL-C, however, not TG or High-density lipoprotein cholesterol.
As higher nutrient concentrations in whole body, inflammation can be observed in all tis-Table 4. Multiple linear regression analyses with
betatrophin as dependent variable
Variable r2 β P value
Model 1 0.315 < 0.001#
Resistin 0.570 < 0.001#
Model 2 0.386 < 0.001#
Resistin 0.501 < 0.001#
NAFLD 0.288 0.003#
Model 3 0.456 < 0.001#
Resistin 0.493 < 0.001#
NAFLD 0.285 0.002#
Fasting C Peptide 0.276 0.002#
Model 4 0.483 < 0.001#
Resistin 0.459 < 0.001#
NAFLD 0.282 0.002#
Fasting C Peptide 0.245 0.005#
Age 0.188 0.034*
Values are corrected r2 (r2), standardized coefficients (β) and
sues of energy homeostasis, including muscle, liver, fat, and islets [30-34]. It has been proven that hepatic tissue was associated with a remarkable accumulation of immune cells dur-ing obesity [34]. In this study, the serum adipo-kines of inflammation, i.e. TNF-α andInterleu-kin-8, witnessed significant correlations with serum Betatrophin [26, 35]. Lastly, multiple linear regression analysis indicated a predict-ing model, includpredict-ing age, Resistin, NAFLD and Fasting C Peptide, explained 48.3% of the total variability of serum Betatrophin levels.
In terms of the strengths, to begin with, it is the first clinical study to assess the role of serum Betatrophin in NAFLD. Moreover, to validate the reliability, we measured serum Betatrophin level with ELISA kits from two providers and performed western blotting detection. Lastly, the serum concentrations of 12 adipokines related to inflammation and insulin sensitivity were measured, using Human Adipokine Magnetic Bead Panel kits.
Some limitations of the study merit comment. Firstly, the case-control design makes it diffi-cult to determine the role of serum Betatrophin in the development of NAFLD. In the future, a long-term cohort study with a larger population is required. Secondly, the golden standard of NAFLD is liver pathological examination, rather than ultrasonography that evaluatedthe degrees of NAFLD (mild, moderate and severe) in this study [36]. Thirdly, the parameters of inflammation, e.g. C-reactive protein, erythro-cyte sedimentation rate failed to be included in our study. Lastly, due to lack of information con-cerned physical activity, diet, economic status and etc., the impact of these factors was not taken into consideration.
In summary, our study found a higher serum level of Betatrophin in subjects with NAFLD, compared with controls. Serum Betatrophin presented an association with higher odds of NAFLD. Furthermore, circulating Betatrophin correlated with anthropometric parameters, i.e. age, WHR, and biochemical parameters, i.e. TC, LDL-C, HbA1c, HOMA-IR, FPG, and Fasting C Peptide. Lastly, Betatrophin presented correla-tions with several adipokines of inflammation and insulin sensitivity, including TNF-α, Resistin, and Interleukin-8. It suggests that serum Betatrophin is a potential biomarker and thera-peutic target for NAFLD, possibly related to the
regulation of inflammation and insulin sen- sitivity.
Acknowledgements
This work was supported by National Key Basic Research Development Program (No. 2012CB524905), National Science and Tech- nology Support Plan Project (No. 2012BAI 06B04), National Natural Science Foundation of China (No. 81170378 and No. 81230012).
Disclosure of conflict of interest
None.
Address correspondence to: You-Ming Li, Depart- ment of Gastroenterology, The First Affiliated Hospital, College of Medicine, Zhejiang University, Hangzhou 310003, China. Tel: 86-15665170166; Fax: 86-571-87080565; E-mail: ymli.zju@live.com
References
[1] Zhu JZ, Zhou QY, Wang YM, Dai YN, Zhu J, Yu CH and Li YM. Prevalence of fatty liver disease and the economy in China: A systematic re-view. World J Gastroenterol 2015; 21: 5695-5706.
[2] Chitturi S, Wong VW and Farrell G. Nonalco-holic fatty liver in Asia: Firmly entrenched and rapidly gaining ground. J Gastroenterol Hepatol 2011; 26 Suppl 1: 163-172.
[3] Zhu JZ, Dai YN, Wang YM, Zhou QY, Yu CH and Li YM. Prevalence of nonalcoholic fatty liver disease and economy. Dig Dis Sci 2015; 60: 3194-202.
[4] Kassi E, Pervanidou P, Kaltsas G and Chrousos G. Metabolic syndrome: definitions and contro-versies. BMC Med 2011; 9: 48.
[5] Mendez-Sanchez N, Arrese M, Zamora-Valdes D and Uribe M. Current concepts in the patho-genesis of nonalcoholic fatty liver disease. Liv-er Int 2007; 27: 423-433.
[6] Yi P, Park JS and Melton DA. Betatrophin: a hor-mone that controls pancreatic beta cell prolif-eration. Cell 2013; 153: 747-758.
[7] Quagliarini F, Wang Y, Kozlitina J, Grishin NV, Hyde R, Boerwinkle E, Valenzuela DM, Murphy AJ, Cohen JC and Hobbs HH. Atypical angiopoi-etin-like protein that regulates ANGPTL3. Proc Natl Acad Sci U S A 2012; 109: 19751-19756. [8] Wang Y, Quagliarini F, Gusarova V, Gromada J,
[9] Fu Z, Yao F, Abou-Samra AB and Zhang R. Lipa-sin, thermoregulated in brown fat, is a novel but atypical member of the angiopoietin-like protein family. Biochem Biophys Res Commun 2013; 430: 1126-1131.
[10] Chen X, Lu P, He W, Zhang J, Liu L, Yang Y, Liu Z, Xie J, Shao S, Du T, Su X, Zhou X, Hu S, Yuan G, Zhang M, Zhang H, Liu L, Wang D and Yu X. Circulating betatrophin levels are increased in patients with type 2 diabetes and associated with insulin resistance. J Clin Endocrinol Metab 2015; 100: E96-100.
[11] Barja-Fernandez S, Folgueira C, Seoane LM, Casanueva FF, Dieguez C, Castelao C, Aguera Z, Banos R, Botella C, de la Torre R, Fernandez-Garcia JC, Fernandez-Real JM, Fruhbeck G, Gomez-Ambrosi J, Jimenez-Murcia S, Tina-hones FJ, Estivill X, Fernandez-Aranda F and Nogueiras R. Circulating betatrophin levels are increased in anorexia and decreased in mor-bidly obese women. J Clin Endocrinol Metab 2015; 100: E1188-96.
[12] Espes D, Lau J and Carlsson PO. Increased cir-culating levels of betatrophin in individuals with long-standing type 1 diabetes. Diabetolo-gia 2014; 57: 50-53.
[13] Hu H, Sun W, Yu S, Hong X, Qian W, Tang B, Wang D, Yang L, Wang J, Mao C, Zhou L and Yuan G. Increased circulating levels of betatro-phin in newly diagnosed type 2 diabetic pa-tients. Diabetes Care 2014; 37: 2718-2722. [14] Wawrusiewicz-Kurylonek N, Telejko B, Kuzmicki
M, Sobota A, Lipinska D, Pliszka J, Raczkowska B, Kuc P, Urban R, Szamatowicz J, Kretowski A, Laudanski P and Gorska M. Increased mater-nal and cord blood betatrophin in gestatiomater-nal diabetes. PLoS One 2015; 10: e0131171. [15] Zhu JZ, Zhu HT, Dai YN, Li CX, Fang ZY, Zhao DJ,
Wan XY, Wang YM, Wang F, Yu CH and Li YM. Serum periostin is a potential biomarker for non-alcoholic fatty liver disease: a case-control study. Endocrine 2016; 51: 91-100.
[16] Gomez-Ambrosi J, Pascual E, Catalan V, Rodri-guez A, Ramirez B, Silva C, Gil MJ, Salvador J and Fruhbeck G. Circulating betatrophin con-centrations are decreased in human obesity and type 2 diabetes. J Clin Endocrinol Metab 2014; 99: E2004-2009.
[17] Su W, Cao H and Fan J. [Diagnosis and treat-ment of non-alcoholic fatty liver disease]. Zhonghua Gan Zang Bing Za Zhi 2014; 22: 705-707.
[18] Zeng MD, Fan JG, Lu LG, Li YM, Chen CW, Wang BY, Mao YM; Chinese National Consensus Workshop on Nonalcoholic Fatty Liver Disease. Guidelines for the diagnosis and treatment of nonalcoholic fatty liver diseases. J Dig Dis 2008; 9: 108-112.
[19] Faul F, Erdfelder E, Buchner A and Lang AG. Statistical power analyses using G*Power 3.1:
tests for correlation and regression analyses. Behav Res Methods 2009; 41: 1149-1160. [20] Haridas PA, Soronen J, Sadevirta S, Mysore R,
Quagliarini F, Pasternack A, Metso J, Perttila J, Leivonen M, Smas CM, Fischer-Posovszky P, Wabitsch M, Ehnholm C, Ritvos O, Jauhiainen M, Olkkonen VM and Yki-Jarvinen H. Regula-tion of angiopoietin-like proteins (ANGPTLs) 3 and 8 by insulin. J Clin Endocrinol Metab 2015; 100: E1299-307.
[21] Zhang R. Lipasin, a novel nutritionally-regulat-ed liver-enrichnutritionally-regulat-ed factor that regulates serum triglyceride levels. Biochem Biophys Res Com-mun 2012; 424: 786-792.
[22] Kushner JA. The role of aging upon beta cell turnover. J Clin Invest 2013; 123: 990-995. [23] Saisho Y, Butler AE, Manesso E, Elashoff D,
Rizza RA and Butler PC. Beta-cell mass and turnover in humans: effects of obesity and ag-ing. Diabetes Care 2013; 36: 111-117. [24] Ammar KA, Redfield MM, Mahoney DW,
John-son M, Jacobsen SJ and Rodeheffer RJ. Cen-tral obesity: association with left ventricular dysfunction and mortality in the community. Am Heart J 2008; 156: 975-981.
[25] Zheng RD, Chen ZR, Chen JN, Lu YH and Chen J. Role of body mass index, waist-to-height and waist-to-hip ratio in prediction of nonalcoholic fatty liver disease. Gastroenterol Res Pract 2012; 2012: 362147.
[26] Hajer GR, van Haeften TW and Visseren FL. Adipose tissue dysfunction in obesity, diabe-tes, and vascular diseases. Eur Heart J 2008; 29: 2959-2971.
[27] Ren G, Kim JY and Smas CM. Identification of RIFL, a novel adipocyte-enriched insulin target gene with a role in lipid metabolism. Am J Physiol Endocrinol Metab 2012; 303: E334-351.
[28] Tseng YH, Ke PY, Liao CJ, Wu SM, Chi HC, Tsai CY, Chen CY, Lin YH and Lin KH. Chromosome 19 open reading frame 80 is upregulated by thyroid hormone and modulates autophagy and lipid metabolism. Autophagy 2014; 10: 20-31.
[29] Guo T, Yin RX, Wu J, Lin QZ, Shi GY, Shen SW, Sun JQ, Li H, Lin WX and Yan Z. Association of the angiopoietin-like protein 8 rs2278426 polymorphism and several environmental fac-tors with serum lipid levels. Mol Med Rep 2015; 12: 3285-96.
[30] Wellen KE and Hotamisligil GS. Inflammation, stress, and diabetes. J Clin Invest 2005; 115: 1111-1119.
[32] Boni-Schnetzler M, Thorne J, Parnaud G, Mar-selli L, Ehses JA, Kerr-Conte J, Pattou F, Halban PA, Weir GC and Donath MY. Increased inter-leukin (IL)-1beta messenger ribonucleic acid expression in beta -cells of individuals with type 2 diabetes and regulation of IL-1beta in human islets by glucose and autostimulation. J Clin Endocrinol Metab 2008; 93: 4065-4074. [33] Richardson SJ, Willcox A, Bone AJ, Foulis AK
and Morgan NG. Islet-associated macrophages in type 2 diabetes. Diabetologia 2009; 52: 1686-1688.
[34] Donath MY, Dalmas E, Sauter NS and Boni-Schnetzler M. Inflammation in obesity and dia-betes: islet dysfunction and therapeutic oppor-tunity. Cell Metab 2013; 17: 860-872.
[35] Takei Y and Laskey R. Interpreting crosstalk be-tween TNF-alpha and NGF: potential implica-tions for disease. Trends Mol Med 2008; 14: 381-388.
Supplementary Figure 1. Correlation of serum betatrophin levels between USCN Life ELISA kit and Eiaab ELISA kit (n = 36, r = 0.8155, P < 0.0001).
Supplementary Figure 2. Representative western blot detection of betatrophin in four serum samples.