THE ECONOMIC AND SOCIAL RESEARCH INSTITUTE COUNCIL
* TOMAS F. 6 COFAIGH, President of the Institute. * EUGENE McCARTHY, Chairman of the Council.
KEVIN BONNER, Secretary, Department of Enterprise and Employment.
VANI K. BOROOAH, Professor, Department of Applied Economics and Human Resource Management, University of Ulster at Jordanstown.
JAMES CAWLEY, Managing Partner, Cawley & Company, Solicitors. LIAM CONNELLAN, Vice-President, Royal Dublin Society.
* SEAN CROMIEN, Secretary, Department of Finance.
WILLIAM B. DILLON, Chief Executive, Amdahl Ireland Limited. * MARGARET DOWNES, Deputy Governor, Bank of Ireland. * MAURICE F. DOYLE, Governos, Central Bank of Ireland.
DERMOT EGAN, Deputy Chief Executive, AIB Group.
* CONNELL FANNING, Professor, Department of Economics, University College, Cork. IAN GRAHAM, Consultant Cardiologist, The Charlemont Clinic, Dublin.
GRAHAM GUDGIN, Director, Northern Ireland Economic Research Centre. JOSEPH HARFORD, Chief Executive, Yamanouchi Ireland Company Limited. JOHN HURLEY, Secretary, Department of Health
* KIERAN A. KENNEDY, Director of the Institute.
PATRICK LYNCH, Chairman of the Institute, 1983-1988. JOSEPH MORAN, Chief Executive, Electricity Supply Board. DONAL MURPHY, Director; Central Statistics Office.
* DERMOT F. McALEESE, Whately Professor of Political Economy, Trinity College, Dublin.
EDWARD F. McCUMISKEY, Secretary, Department of Social Welfare. FERGUS McGOVERN, Chief Executive, Telecom Eireann.
* DONAL NEVIN,former General Secretary, Irish Congress of Trade Unions. JOYCE O’CONNOR, Directol, The National College of Industrial Relations. PATRICK O’REILLY, Chief Executive, EBS Building Society.
* W.G.H. QUIGLEY, Chairman, Ulster Bank Limited.
* NOEL SHEEHY, ProfessoJ; Department of Psychology, Queen’s University of Belfast. MICHAEL J. SOMERS, Chief Executive, National Treasury Management Agency. REV. CONOR K. WARD, Social Science Research Centre, University College, Dublin. T.K. WHITAKER, President of the Institute 1971-1987.
* PADRAIC A. WHITE, Director, Dresdner International Finance plc.
The Medium-Term Review:
1994-2000
SARA CANTILLON, JOHN CURTIS, JOHN FITZ GERALD
Copies of this paper may be obtained from The Economic Institute (Limited Company No. 18269), (Registered Office) Dublin 4.
and Social Research 4 Burlington Road,
Price IR£27.50 per copy
Sara Cantillon is an Assistant Research Officer, John Curtis is a Research Assistant, and John Fitz Gerald and Patrick Honohan are Research Professors with The Economic and Social Research Institute. The Review has been accepted for publication by the Institute, which is not responsible for either the content or the views expressed therein.
© THE ECONOMIC AND SOCIAL RESEARCH INSTITUTE
Medium-Term Review: 1994-2000
Forecast Tables on Disk, Lotus 123 Format
Details from the Reception, The ESRI
Price IR£150
ACKNOWLEDGEMENTS iv
SUMMARY V
1 INTRODUCTION
2 WHERE DID ALL THE GROWTH GO?
John Fitz Gerald and Patrick Honohan
3 BACKGROUND ASSUMPTIONS 21
4 CENTRAL FORECAST 39
5 DEPENDENCE OR DEVELOPMENT 69
APPENDIX 81
Acknowledgements
The prOduCtion of the Medium-Term Review is, in many ways, a collective effort within the Economic and Social Research Institute. The editors of the Review have drawn heavily on the wide range of expertise of the Director of the ESRI and their Institute colleagues, who have assisted during all stages of preparation and revision.
In particular, we are grateful to Terry Baker, editor of the Institute’s Quarterly Economic Commentary, for assistance with the interface between the QEC forecasts for 1994 and our own projection of these short-term forecasts into the medium term.
The Department of Finance, has provided constant and invaluable help and advice over an extended period of years, not least in the preparation of computer data banks and in the technical development, maintenance and testing of the economic model.
Mary McElhone, of the ESRI, was an essential part of the team ensuring that the Review actually reached publication. As always Pat Hopkins made endless drafts possible through her constant greasing of the production system.
A particular word of thanks is due to the National Institute of Economic and Social Research for allowing us to use their global econometric model, NiGEM, in examining the sensitivity of the forecasts to alternative assumptions.
Main Features
The Irish economy is in a strong position to benefit from the impending European recovery. In this Review our Central Forecast suggests that Ireland will experience a period of rapid growth over the next 5 years and that there will also be a significant growth in employment.
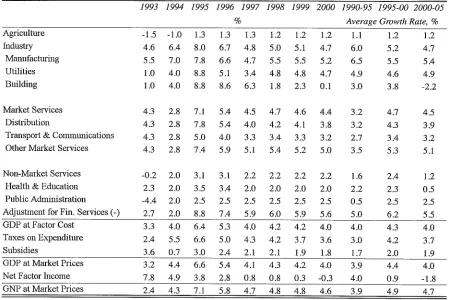
The relative success of the Irish economy over the last 3 years at a time of European recession reflects its competitive strength. Over the next 3 years the growth in output, measured by GNP, is likely to be very rapid (Table 1) representing some catching up on the lost opportunities of the early 1990s.
The average growth rate of GNP for the first half of the 1990s is likely to be just over 4 per cent, broadly in line with the trend growth rate in the past (see Figure 1). The second half of the dec-ade is likely to see GNP growing at just under 5 per cent a year with some reversion to past trends in the following 5 year period.
Fi;~ure 1
f
Average Growth Rate, GNP
\
5.0
4.0-
3.0-
2.0-
1.0-0,0
65-70 60-65
75-80 8~-90 95-00 70-75 80-85 90-95 00-05
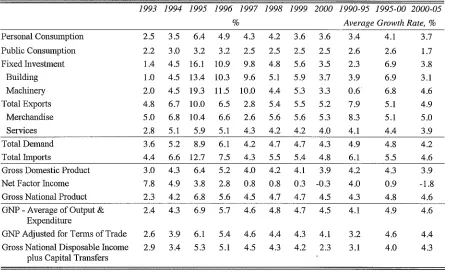
A striking feature of the next five years will be an investment boom which will increase the pro-ductive potential of the economy. Private con-sumption should also grow quite rapidly. The combination of these two factors will see domes-tic demand rising more rapidly than in the past decade. This change in the composition of de-mand will be favourable to employment growth. The result of this period of relatively rapid growth will be that Ireland, which in 1990 had a GDP per head of around 72 per cent of the EU average will, by the year 2000, be around 83 per cent of the EU average. This would represent a much greater narrowing of the gap in living stan-dards than occurred over the previous 30 years from 1960-90.
The rate of inflation is forecast to remain just under 2.5 per cent a year over the period 1990-2005.
Throughout the slowdown in the early 1990s employment growth continued, albeit at an at-tenuated rate. With a return to rapid growth over the next few years we envisage a substantial in-crease in total employment. For the rest of the decade employment growth should comfortably exceed 1 per cent every year, averaging around 1.7 per cent in the second half of the decade. The reasons for the expected better employment re-sponse are discussed in Chapter 2.
vi MEDIUIVI-TERM REVIEW: 1994-2000
Table 1: Central Forecast, Major Aggregates
1993 1994 1995 1996 1997 1998 1999 2000 1990-95 1995-00 2000-05
% Average Growth Rate, %
GNP 2.4 4.3 6.9 5.7 4.6 4.8 4.7 4.5 4.1 4.9
Gross National Disposable Income + 2.9 3.4 5.3 5.1 4.5 4.3 4.2 2.3 3.1 4.0 Capital Transfers (National Resources)
Consumption Deflator’ 2.O 3.0 2.6 2.3 2.3 2.4 2.4 2.4 2.5 2.3
Employment, April 0.6 1.0 2.2 2.3 2.0 1.5 1.5 1.2 0.8 1.7
4.6 4.3
2.3 0.9
Balance of Payments, % of GNP Debt GDP Ratio, %
Exchequer Borrowing, % of GNP 2.5 1.9 2.1 Unemployment Rate, per
Live Register basis 21.6 21.4 20.6
Labour Force basis 17.0 16.9 16.1
6.1 5.8 3.8 3.2 2.3 2.3 2.5 1.6 90.4 86.9 81.0 75.9 71.2 66.7 62.1 58.6 1.4 0.9 0.5 -0.1 0.6
cent of Labour Force
19.8 19.1 18.7 18.2 17.9 15.3 14.6 14.2 13.7 13.4
be sufficient to absorb all labour market entrants. The combined effects of employment growth, the increase in the labour force, and net emigra-tion will mean that the unemployment rate, on a labour force basis, will fall slowly from its cur-rent high level to around 13.4 per cent in 2000. This will still leave Ireland with one of the highest unemployment rates in the EU.
The rapid rate of growth in the coming years, if realised, will see some reduction in the balance of payments surplus. However, it is likely to re-main positive at the end of the decade.
Finally, the combination of substantial growth in the economy with the assumed stance of fiscal policy sees the Exchequer maintaining a small borrowing requirement out to the end of the dec-ade. The debt GDP ratio falls steadily so that by 2000 it could be below 60 per cent. This im-provement would see Ireland meeting all the Maastricht criteria by the end of the decade.
Driving Forces
There are a number of factors driving this strong recovery:
Recovery from Recession: The last 3 years
have seen the Irish economy growing below
trend due to the European recession and the re-lated high level of interest rates. Following the normal pattern, we expect economic growth to accelerate as the European economy enters its re-covery phase.
Competitiveness: Our Central Forecast
envis-ages a small but steady improvement in labour cost competitiveness over the rest of the decade. One factor in this improvement is the likely fall in the tax burden in Ireland while it is rising in our main trading partners. This provides a stark contrast with the early 1980s and, if realised, will provide a much more favourable environ-ment for employenviron-ment growth in the medium term.
Real interest rates, which had risen to excep-tional levels in the late 1980s and early 1990s, have fallen considerably over the last year. While still high by the standards of the 1960s and the 1970s they are now back to a level where it is profitable to invest in fixed assets. This will significantly improve the competitive position of the economy, especially that of Irish owned firms.
such as energy, which are an essential input into the tradable sector.
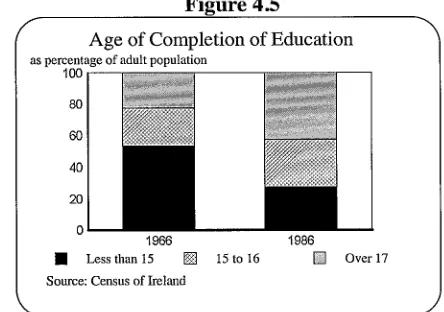
Demographic Change: Irish society is likely to undergo a radical change over the next 10 years as the full effects of demographic changes work their way through the population. Many of these changes are already inevitable given the pattern of births, deaths and emigration over the last 20 years. The key features of these changes are: a drastic reduction in the number of children; a rapid fall from 2000 onwards in the net entry into the labour force; a major increase in the proportion of the population in working age groups; a substantial reduction in the de-pendency ratio, even if unemployment were to continue above the EU norm; increased partici-pation in education and the improving skills and education of the workforce.
There will be a rapid reduction in the proportion of the population in dependant age groups over the next 10 years which will tend to reduce the demand for certain public services. As the pro-portion of the population at work rises so too will income per head making an important con-tribution to the convergence in living standards between Ireland and the EU.
Policy Implications
The Central Forecast suggests a period of sub-stantial progress in improving living standards over the next decade. Ireland will have the ca-pacity, if it has the will, to address its most basic problem, that of unemployment. However, sol-utions will not be found if the economy is left on auto-pilot and they will depend as much on changing attitudes among those at work as on government policy.
The key to sustainable growth lies in increasing the efficiency and productivity of the supply side of the economy. This involves maintaining labour cost competitiveness if dependence or high levels of unemployment are to be avoided. The demographic changes under way will re-quire major changes in public policy in the field of education and social welfare. They will also have important implications for the private sec-tor through their effects on changing patterns of demand.
For the public finances the next 5 years provide a window of opportunity. Tax reform and some limited increase in the volume of expenditure are all consistent with a major reduction in the debt/GNP ratio. Even if the EU Structural Funds are scaled down from 2000 onwards there should be no disruption in public investment.
The prospect that a major increase in living stan-dards for the bulk of the population may be achieved over the next 5 to 10 years, while sim-ultaneously the number of long-term unem-ployed shows little change, is a major issue for public policy. It seems clear that even if the rate of job creation were substantially greater than we forecast it would still have little effect on the numbers of long-term unemployed who have few marketable skills and a low level of education.
CHAPTER 1
Introduction
The art of soothsaying has a long and sorry his-tory. If the height of success in the soothsaying stakes is considered to be CassandraI it indeed makes an unattractive career. However, unlike Cassandra, we make no pretensions to certainty in this Review, nor do we foretell doom and gloom. Our more mundane purpose is to present our best estimate of how the Irish economy is likely to develop over the rest of the decade. The picture which we paint in this Review is one of steady progress in most areas of economic life with the notable exception of unemployment. We present a single Central Forecast for the period 1994-2000. To allow readers gauge the possible margins of error in our Central Forecast we provide details in an extensive set of "what if’’ experiments. These include simulations to examine the impact on the economy of changes in interest rates, the terms of trade, and factors affecting participation in the labour force. While these do not constitute a DIY forecast kit they il-lustrate the sensitivity of our analysis to small changes in assumptions.
This Review has an additional purpose which is to explore how the Irish economy works and to identify important medium and long-term issues for policy makers. Too often our eyes are fo-cused on current problems and the immediate fu-ture and we can miss the opportunity to mould the course of our development. The companion Economic Perspectives volume explores a range
of issues of significance in the medium term. In this Review we highlight the implications for the economy of the major demographic changes which are under way. We also consider the competitiveness of the economy in a wider con-text. The Central Forecast suggests that Irish liv-ing standards will converge quite rapidly on the EU norm with implications for economic policy. Finally, the ever present weight of numbers of the long-term unemployed will continue to pose the major challenge to economic policy over the rest of the decade.
In Chapter 2 we take up the issue of why the growth of the last 10 years did not produce more gains in employment. This analysis sets the backdrop for the rest of the Review highlighting certain key factors which explained the slow growth in employment in the past but which are likely to be less significant over the rest of the
1990s.
Chapter 3 sets out our background assumptions on the external environment facing the economy to the end of the decade. It also analyses some of the demographic changes already underway which will have a major impact on the economy over the coming decade. Finally we spell out the assumptions we have made concerning domestic monetary and fiscal policy.
addition, we give some summary measures for the following 5 year period to 2005. This Chapter gives details of a range of experiments where we have tested the sensitivity of our fore-cast to changing assumptions.
The Central Forecast implies a fairly rapid con-vergence in living standards between Ireland and the EU over the next 5 or 10 years. Chapter 5 examines this process. It considers how domestic policy can best be directed to promote the devel-opment of the economy and it discusses some key strategic issues which will be faced over the rest of the decade.
In this Review we use the UK National Institute of Economic and Social Research NiGEM world model to explore different scenarios for the world economy. For the Irish economy we use our own Medium Term Model to help develop the framework of our Central Forecast and also to explore the sensitivity of that forecast to changing assumptions about the external envi-ronment and about how key sectors of the Irish economy itself behave.
The "Form"
It is instructive for both authors and readers to consider our track record on medium-term fore-casting to see where our forecasts have proved robust and what events have overtaken our initial assumptions. This examination
¯ exposes our fallibility;
Table 1.1: Medium-Term Review Forecasts, average growth rate
Forecast MTR Latest Period Forecast Estimate/
Forecast
%
Review 1986 1985-90 3.0 3.9 Review 1987 1987-92 2.6 4.6 Review 1989 1988-94 4.9 4.5 Review 1991 1991-96 3.7 4.5
¯ it shows how the quality of future forecasts can be improved;
¯ it helps us understand the likely margin of error in the Central Forecast in this Review. Table 1.1 shows the forecast average rate of
GNP growth for the period covered by the last four Reviews. In three of the four cases we have underestimated the average growth rate over the period. This is interesting in that in the case of the first two Reviews the forecast was considered very optimistic at the time of publication. The average absolute error is around 1 percentage point per annum.
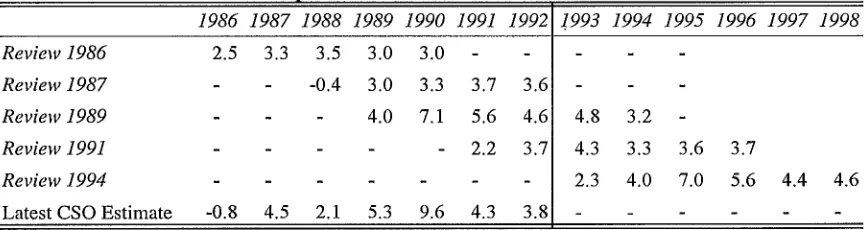
[image:11.593.87.519.612.727.2]Table 1.2 examines the forecasting record on a year by year basis. This highlights the fact that it is very difficult to predict precise turning points in the economic cycle. We may have a reasona-bly good track record in forecasting the average rate of growth in the medium term but we are not as effective in predicting when it will actual-ly occur. In the last Review we expected that the European recovery would occur two years before it now seems likely to appear. However, over the relevant forecast period 1991-1996 economic
Table 1.2 Comparison of Forecasts for GNP Growth Rate
Review 1986 Review 1987 Review 1989 Review 1991 Review 1994
Latest CSO Estimate
2.5 3.3
1986 1987 1988 1989 1990 1991 1992 1.993 1994 1995 1996 1997 1998
-0.8 4.5
3.5 3.0 3.0
-0.4 3.0 3.3 3.7 3.6 4.0 7.1 5.6 4.6
- 2.2 3.7
2.1 5.3 9.6 4.3 3.8
4.8 3.2 4.3 3.3 2.3 4.0
3.6 3.7
INTRODUCTION 3
growth may actually be higher than we original-ly expected as the recession did not bring about a permanent loss of growth, rather it resulted in its deferral. As a result, in this the fifth Medium
Where Did All The Growth Go?
John Fitz Gerald and Patrick Honohan
2.1 Introduction
The recovery over the last number of years has placed the Irish economy among the top per-formers in several international league charts. Sustained growth, low inflation, a strong in-ternational balance of payments and a conso-lidation of the fiscal position are the most noteworthy positive features. These successes are undeniable, yet unemployment is still near its record level and, for many, growth does not seem to feel as good as it should.
In this Chapter we examine the apparent dis-crepancy between the usual measures of growth and perceived economic welfare over the past decade. Because the economic recovery has not been a balanced one, some of the aggregate stat-istics can tend to mislead. Much of the addi-tional output has been absorbed in slowing and then reversing the growth in foreign debt, rather than being available for personal consumption and other elements of domestic demand. This in turn has limited the employment content of growth. A gradual deterioration in the terms of trade since 1989 has also reduced the spending power of the additional output.
The rate of growth of the Irish economy, measured in the conventional way by GNP, has been rapid since 1986, reversing the stagnation
of the previous half-decade and defying the in-ternational recession. Over the last 5 years the
rate of growth in GNP has been among the highest in the industrial world. In 1990 alone, GNP growth was measured at 8.2 per cent, and the average growth between 1987 and 1992 was 4.6 per cent. As shown in Figure 2.1 the recent performance of the Irish economy, while repre-senting a major improvement compared to the first half of the 1980s, has been broadly in line with the average experience of the 1960s and 1970s. Over the last 30 years, with the exception of the 1980-85 period, the Irish economy has grown at an average rate of around 4 per cent a year.
Figure 2.1
f
Growth Rate, GNP
~ercentage Change 8.0
6.0- 4.0- 2.0- 0.0- -2.0--4.0
1960 1965 1970 1975 1980 1985 199019931 . ,
6 MEDIUM-TERM REVIEW: 1994-2000
balance of payments surplus combined with a low inflation rate.
Yet some commentators complain about econ-omic conditions and suggest that the measured rebound in Ireland’s economic fortunes is some kind of statistical mirage. Somehow, it has been argued, the bits of the economy that really matter have been neglected in the main measures used, and bits that do not matter much have been given undue prominence. In what follows, we consider the pattern of the econo-my’s performance over the past decade or so in order to evaluate this position.
There are several difficulties of interpretation with Irish economic statistics because of the un-usual productive structure, the exceptional demographic developments and the extraordi-nary turnaround in the fiscal accounts. When the implication of these factors is taken into ac-count much can be explained.
Our conclusion is that the recovery in growth is not illusory - though it has been less strong than some widely used indicators would suggest. The growth does not feel so good because much of its fruits have gone to halt and even reverse the rise in national indebtedness, as well as to restore company profitability. Household in-come has not risen as rapidly as GNP. Further-more, the net growth in jobs has been no better in this recovery than in the past, and the last few years have been associated with very de-pressed employment conditions in the UK, choking off the degree to which emigration is available as an alternative. As a result, unem-ployment dipped only briefly before returning to record levels.
Irish economic performance over the past 20 years has been a dizzying roller-coaster. Drastic fiscal contraction in the 1980s, first with tax in-creases and later, more successfully, with spending reductions, turned the economy’s
finances around from a position of near-bankrupt-cy. The cost was a devastating shake-out of tradi-tional manufacturing and service employment, a surge in unemployment and large emigration. In the early 1980s the nation was living well be-yond its means. Now the reverse is true. Collec-tively we are repaying debt or accumulating foreign assets at a rate higher than nearly any other industrial country. The picture has thus been very far from what we might hope for, namely: balanced growth in Ireland, with a stable fiscal picture, balance of payments at a long-term sustainable level and steady employment growth. Still, despite the severity of the European re-cession, the position of the last year or so begins to show signs of an approach towards such an equilibrium. The massive unemployment rate, the remarkably large current account payments sur-plus and the still-too-high level of government in-debtedness point the way to the direction in which correction is needed.
Changes in the composition of output and incom-es, and in the relative prices of different compo-nents, have resulted in wide divergences between different aggregate measures of economic per-formance. Section 2.2 spells out the differences and how they have been evolving. These measurement issues are important and can not be neglected in any account of recent Irish economic conditions.
Section 2.3 examines the production side of the economy, exploring where the output growth has come from and the degree to which employment growth has accompanied output growth. Migra-tion moderates the link between employment growth and unemployment: we describe develop-ments on that front too.
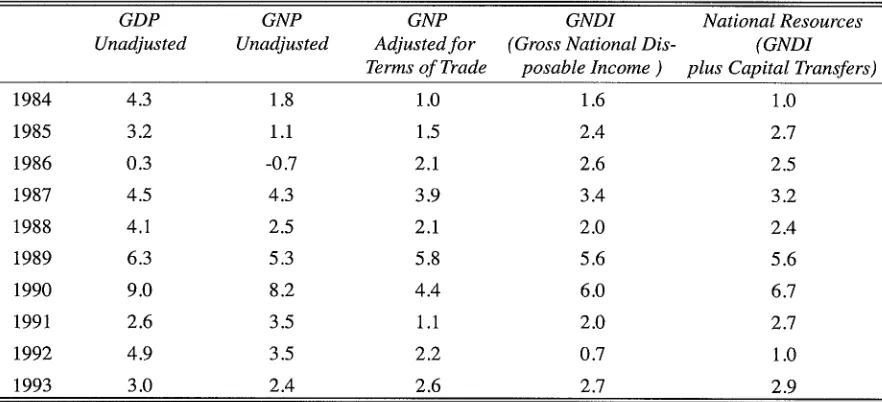
Table 2.1: Economic Growth, per cent
GDP GNP GNP GNDI National Resources
Unadjusted Unadjusted Adjusted for (Gross National Dis- (GND1 Terms of Trade posable lncome ) plus Capital Transfers)
1984 4.3 1.8 1.0 1.6 1.0
1985 3.2 1.1 1.5 2.4 2.7
1986 0.3 -0.7 2.1 2.6 2.5
1987 4.5 4.3 3.9 3.4 3.2
1988 4.1 2.5 2.1 2.0 2.4
1989 6.3 5.3 5.8 5.6 5.6
1990 9.0 8.2 4.4 6.0 6.7
1991 2.6 3.5 1.1 2.0 2.7
1992 4.9 3.5 2.2 0.7 1.0
1993 3.0 2.4 2.6 2.7 2.9
GNDI = GNP adjusted for terms of trade plus current transfers from abroad; National Resources = GNDI plus capital transfers from abroad.
and exchange rate matters are brought into the picture.
Finally, Section 2.5 attempts to provide a con-cise conceptual framework in which the overall position of the current state of economy, with a payments surplus and a jobs deficit, may be
un-derstood and interpreted.
2.2 Income is Growing More
Slowly than Output
In most countries, the commonly used aggre-gate economic indicators move closely together, so it does not often matter which of these one uses to evaluate developments. Because of the structural characteristics of our economy, that is not the case in Ireland. Changes in the outflow of interest and dividends to non-residents, in the purchasing power of Irish output, and in the flow of transfers from the EU are all very
important for Ireland. Therefore, neither GDP nor GNP tells the whole story. The purchasing power of the resources available to Ireland is better measured by other indicators.
The indicator of standard of living most common-ly used abroad is GDP, but this is not very suit-able for Ireland, because it includes the profits of foreign-owned companies and because it also fails to exclude payments of debt interest abroad. These two items are very large in Ireland and their share in GDP has changed markedly over the years. As a result, growth in GNP is the most commonly used measure of standard of living in IrelandI. This measure is better because it ex-cludes repatriated profits of foreign multination-als and interest paid to foreigners on the government debt, two important factors which have affected the growth in living standards over the last 15 years. In particular, the profits, swollen by transfer pricing, grew rapidly in the
Estimates of the real growth in GNP are themselves subject to some uncertainty. The CSO provides two alternative figures, based on output and expenditure statistics respectively. While the two figures should conceptually be equal, problems in collecting appropriate price data result in discrepancies (which appear to be particularly severe in relation to agricultural intervention). The expenditure-based growth rates have been higher on average over the years. The discrepancy between the two growth rates has averaged 0.5 per cent per annum over the past decades, but seems to have been getting wider
- between 1990 and 1992 the cumulative discrepancy was 5.6 per cent. Here we follow the usual
8 MEDIUM-TERM REVIEW: 1994-2000
1980s to reach a peak of 12 per cent of GNP in 1989.
However, movements in GNP do not take ac-count of two other factors which can influence the standard of living to an appreciable extent. These are changes in the terms of trade and changes in the level of transfers received from the EU. Table 2.1 shows the relevant adjust-ments in the last decade.
The adjustment for the terms of trade is necess-ary to take account of the fact that the purchas-ing power of the goods we produce may change over time. In 1986, for example, the price of our exports rose much more rapidly than did the price of impol-ts because of the major fall in oil prices that year. That meant that the proceeds from sales of our exports purchased much more imports than they had in 1985, allowing a higher standard of living. Thus GNP, adjusted for the terms of trade, rose by 2.1 per cent whereas the unadjusted figure showed a fall of 0.7 per cent.
Since 1986 the terms of trade adjustment has generally been negative. In 1990 nearly half of the very large increase in output had to go to pay the substantial increase in the relative price of imports so that the terms of trade adjustment brought GNP growth from 8.2 per cent down to 4.4 per cent. The trend disimprovement in the terms of trade is attributable to two factors: the downward pressure on agricultural prices result-ing from excess output of CAP products and the importance of high technology exports, dis-cussed later.
The adverse effects of the disimprovement in the terms of trade have been partly offset by the increase in EU transfers over the period. This increase has been due both to the expansion of the Structural Funds and to the increase in transfers under the CAP which partly
compensated for the lower prices. Gross National Disposable Income (GNDI), shown in the fourth column of Table 2.1, is a measure which takes ac-count of both terms of trade and the current transfers. Transfers which are treated as being capital in nature are not included in GNDI, but Table 2.1 also shows the growth in a wider con-cept, which we call National Resources, defined as GNDI plus capital transfers. The average bene-fit from the transfers (even including the capital transfers) has been smaller than the loss due to the adjustment for the terms of trade.
Data for the past decade fall into three sub-per-iods, as shown in Figure 2.2, which presents an-nual average growth rates of per capita GNP and National Resources. (It also shows final domestic demand to which we return below.) During 1984-87, per capita National Resources rose much more rapidly than GNP, mainly reflecting terms of trade improvement.
Figure 2.2
f- Per Capita Growth, 1984-93
6.0
4.0-
2,0-0.0
84-87 87-90 90-93
[] GNP [] Resources [] Domestic Demand
J
During the boom of 1987-90, the increase in EU transfers ensured that growth in National Re-sources held up reasonably well despite deterio-rating terms of trade. In contrast, the most recent period, 1990-93, has experienced a much lower rate of growth of per capita National Resources (1.7 per cent) than of per capita GNP (2.6 per cent). During this period the fact that EU transfers began to plateau2 meant that they could
Box 2.1 : Agricultural Intervention and the National Accounts
The existence of a wide discrepancy between EU and third country export prices for Ireland’s major agricultural products provides yet another complicating factor for the National Accounts to the extent that a varying proportion of agricultural output is exported to third countries. Accounting for the acti-vities of the Agricultural Intervention Agency provides the biggest headache. The Agency buys in pro-duce at a high price and sells it at a low price. The often sizeable difference is covered by transfers from the EU, but the accounting treatment of the losses and transfers is inevitably somewhat arbitrary. For most macroeconomic purposes, it would be convenient to treat the Agency as being offshore, thus imagining the produce as having been exported for an EU-related price as soon as it is sold into inter-vention. But (in accordance with approved international standards) the National Accounts do not fol-low that convention. Accordingly, the timing of sales out of intervention stocks alters the year-to-year pattern of measured GDP growth. Furthermore, because the Accounts are based on current transac-tions, capital gains or losses of the Agency, reflecting price changes, can influence measured GDP in a way that would not arise if it were offshore. It is worth noting that GNDI seems to be insulated from most of these problems because it includes both the value of production and of the relevant EU transfers.
These accounting issues present other pitfalls for the incautious user in such items as the share of the distribution sector in GDP (because the Agency is included in that sector), and the magnitude of Public Authorities’ subsidies (because the delayed arrival of EU compensatory transfers trigger an
im-b
ed Government subsidy to the Agency in the Accounts). jJ
not offset the sharp terms of trade deterioration. So the slowdown since 1990 has been much more severe in National Resources than in GNP. As National Resources is a better measure of economic welfare than GNP, this goes some way to explaining why GNP growth has not felt as good as it might.
2.3 Jobless Growth?
This section looks at production and employ-ment over the past decade. Three aspects of the disappointing performance of employment growth, especially considering the growth in output, are highlighted.3 First, internationalisa-tion of the economy, in particular of the manu-facturing sector, which has made the interpretation of the data difficult. Second, a delayed response to changes in competitiveness which militated against employment growth, especially in the first half of the 1980s. Third, the pattern of output growth, skewed as it has
been to export demand, which has been relatively unfavourable for employment.
Internationalisation of Irish industry
Spearheading Ireland’s recovery during the late 1980s was a boom in the production of manufac-tures for export. Indeed, growth in manufacturing output had been sustained during most of the early 1980s. Some of the firms involved in this production boom are Irish-owned, but dispropor-tionately the growth has come from foreign-owned firms who now account for about 55 per cent of gross manufacturing output, and 45 per cent of manufacturing employment in the country. While the output figures are distorted by transfer pricing, and although the relative growth in foreign firms has recently slowed or stopped, these percentages are by far the highest in Europe and make Irish manufacturing quite unique. In addition, recent years have seen increasing in-ternationalisation of the comparatively few large Irish-based manufacturing concerns in the form both of much increased foreign investment and of
We thus take up a discussion already initiated by the recent NESC report: The Association Between
10 MEDIUM-TERM REVIEW: 1994-2000
the arrival of new foreign owners or equity partners. (A similar pattern has been exhibited by large non-manufacturing companies also.) The high and growing importance of foreign-owned firms has many consequences, some of which we return to in the following section. Here we would stress the fact that the pattern of their production, investment and pricing deci-sions has often been strongly influenced by the Irish tax regime which has been very generous to manufacturing profits. In many cases, it is that portion of their international activities which can be regarded as highly profitable that multi-national corporations have chosen to lo-cate in Ireland.
To illustrate, we may note that much of recent industrial growth has taken place in just a hand-ful of sectors where the share of wages in net output is barely 10 per cent (the three digit sec-tors covering pharmaceuticals, data processing equipment, software reproduction, and miscel-laneous foods). Despite their purchase of ser-vices from domestic firms, most of the remainder of net output consists of profits at-tributed to, or of services bought in from, the parent company. By 1990, these few sectors ac-counted for 27 per cent of manufacturing value added (up from 11 per cent a decade before) but for only 10 per cent of manufacturing employ-ment. Many other sectors also display a low ratio of domestic input to their measured net output - i.e. even after taking account of the substantial imported inputs.
Growth in the activity of such firms is invaria-bly associated with growth in profit remittances
abroad.4 The net contribution of these sectors to GNP is much lower than their contribution to measured output (including GDP). In Figure 2.3 we show the growth in manufacturing output as a percentage contribution to GNP since the
mid-1970s. The gross contribution from the sec-tor peaked at around 2.5 percentage points in the 1986-90 period. However, when profit repatri-ations are taken into account the net contribution was less than 1.2 percentage points.
Figure 2.3
f
-- Contribution to Growth in GNP
Per cent of GNP From Manufacturing 2.8
2.4 2 1.6 1.2 0.8 0.4 O -0.4
t 976-80 t 98 t -85 1986-90 1991-92
¯ Net Contribution to GNP [,~ Profit Repatriations
\ J
We must also be careful not to be misled by measured volume changes in some of these sec-tors which are affected by rapidly changing prod-uct technology. The prodprod-uct life-cycles of some of the most important and rapidly growing manu-facturing sectors are very short, and unit prices tend to fall rapidly. This is clearly an issue in electronics and data processing sectors, and it has the implication that the purchasing power of a given volume of exports tends to decline over time. Since this pattern of declining prices does not affect most imports, rapid growth in aggre-gate export volumes will not pay for an equival-ent growth in import volumes. As discussed earlier, this is one of the reasons why, in aggre-gate, import prices have recently tended to in-crease faster than export prices, resulting in a deterioration of the terms of trade and implying that the real purchasing power of GNP grows more slowly than does its production volume. Note that we are not denying the importance of these modern, foreign-owned sectors: even after adjusting for the profit and other outflows they are major contributors to employment both
See O’Malley E. and S. Scott, 1994 "Profit Outflows Revisited" in Economic Perspectives for the
directly and through their purchases of local services. (The four sectors mentioned above employ over 20,000 - up more than 50 per cent in a decade). But they greatly contribute to con-fusion in interpreting national economic statis-tics. The arrival and expansion of firms with a wage share as low as 10 per cent inevitably con-tributes to an expansion of measured output dis-proportionate to the employment growth, thereby contributing to an impression of "job-less growth".
Labour Cost Competitiveness
[image:19.595.70.289.469.702.2]Traditional manufacturing sector firms were hard hit by the domestic spending squeeze re-suiting from the fiscal contraction from 1981 on. The degree to which such firms closed and employment declined was unexpectedly severe. It revealed how dependent these firms were on domestic markets, and the extent to which they were unable to find profitable markets abroad when domestic demand shrank. In retrospect it seems likely that many of these firms became vulnerable some years before as trade with the UK and then with the EU became liberalised.
Figure 2.4
f Relative Wage Rates in Manufacturing -’~
Ireland v UK 1.1
1.0
0.9
0.8
0.7
1963 1967 1971 1975 1979 1983 1987 1991
As shown in Figure 2.4, Irish labour costs were substantially below UK levels in 1960. How-ever, over the subsequent 20 years the position changed drastically so that by 1980 Irish labour costs were similar to those prevailing in the
UK.5 This represented a very considerable loss of labour cost competitiveness over the 20 years. Without protection many traditional manufactur-ing firms were uncompetitive by 1980 and only vigorous growth in domestic demand in the late 1970s allowed them to stay in business as long as they did. When hit by a major world recession in-cluding a severe recession in the UK, and by the fiscal adjustment in Ireland in the early 1980s, many firms were forced to close. This had a
seri-ous effect on employment in traditional manufacturing.
Between 1986 and 1989 the competitive position of Irish firms vis- ?t-vis the UK improved signifi-cantly, and despite year-to-year variations since 1990, they have broadly retained this gain. Com-bined with a less depressed domestic market, this has enabled employment in traditional industries to stabilise and even increase slightly during the recovery period from 1987 to 1990.
As it always has, the sobriquet "jobless" growth applies with more force to the pattern of develop-ment of agriculture and agri-business. Agricul-tural output has remained strong despite adverse external conditions and has contributed signifi-cantly to GNP growth in the past few years. But, after a pause in the late 1980s, the reduction in farm employment has resumed and over many years now has been averaging between 4,000 and 5,000 workers per annum.
12 MEDIUM-TERM REVIEW: 1994-2000
Box 2.2: The Irish Financial Services Centre
The Irish Financial Services Centre (IFSC) in Dublin, has made some net contribution to service sector employment (with 1400 jobs in place) since its establishment in 1987. But its influence on other macroe-conomic aggregates has been more substantial even though its trading activities are not fully incorporated into the National Accounts. As with manufacturing, the type of activity attracted to the Centre has been strongly influenced by the tax concessions applying. Profit-intensive activities, such as fund manage-ment, have been prominent. It is understood that gross Corporation Tax receipts from the Centre ex-ceeded £90 million in 1993. (Transfer pricing from onshore financial services may account for some of this.) Furthermore deposits placed by IFSC firms with the domestic banking system are thought to be quite considerable, and sufficiently large to limit the usefulness of money stock figures as an indicator of domestic savings. It may be that some profits generated by the manufacturing sector are invested in the IFSC; to the extent that they are not repatriated, this could result in GNP being overstated.
beginning of the 1980s. Labour-saving techno-logical change combined with limitations on the supply of domestic raw materials remain long-term dampeners on the employment perform-ance of this sector.
Pattern of Demand and Services Employment
[image:20.593.68.285.467.623.2]It is in the service sector that output growth has generated the greatest expansion in employment over the last 15 years, notwithstanding cutbacks in public service employment in the second half of the 1980s (Figure 2.5).
Figure 2-q
Non-Market Services Employment
220 Thousands
210
2OO
190
180
1980 1982 1984 1986 1988 1990 1992
\ J
Between 1980 and 1993 employment in ser-vices grew by 113,000. It is thanks to the addi-tional jobs in market services sector (Figure 2.6) in the past 15 years that total employment has been able to approach its previous (1980) peak again, despite the sharp declines in in-dustry and agriculture.
Growth in services employment is, of course, a world-wide phenomenon with determinants as di-verse as the trend to increased specialisation and out-sourcing of business services, to the growth of information technology and the labour-saving nature of technological change in other sectors.
Figure 2.6
f
Market Services Employment
Thousands
50O
45O
4OO
35O
1980 1982 1984 1986 1988 1990 1992
employment but, despite the vigorous growth in tourist numbers, service sector employment has grown at well below the average international rate.
The fact is that domestic demand has grown much more slowly than GNP in recent years (cf. Figure 2.2). The causes of this slow growth are discussed in the next section, but it is clear that it has had a dampening effect overall on job-growth as domestic demand tends to be more labour intensive than export demand.6 This shift in the pattern of demand, rather than any structural change in the ability of the econ-omy to generate jobs has been at the heart of the slow employment growth.
Labour Market
Altogether, the number of jobs provided was far from being enough to employ the potential net increase to the labour force without migration. After all, the population reached its highest level for a century in the mid-1980s, reflecting return migration in the 1970s and a baby boom which peaked in 19807. Rapid population growth and sluggish job creation resulted at first in a sharp rise in unemployment, but soon, as always in the past, large-scale net emigration got under way. Indeed, it was the weak state of the UK labour market (traditionally the most important destination) in the early 1980s that delayed and, to some extent, limited the emigra-tion. When unemployment began to fall in Brit-ain in 1987 emigration was sufficiently large to make a significant dent in Irish unemployment, despite the absence of aggregate job growth until mid-1989. A renewed rise in UK unem-ployment in late 1990 began to choke off the emigration option, and resulted in
unemployment surging here too. Up to 1 in 10 of those who registered for the first time as unem-ployed at some stage during 1992 had come from outside the Republic, presumably most of them from the UK.
The labour force survey and the administrative "live register" tell rather different stories about the extent of the upswing in unemployment.8 The former indicates that unemployment has only re-turned to its 1987 peak; the latter would put 1993 unemployment at over 45,000 persons higher than in 1987 with the increase being substantially greater for women than for men. The labour force survey is subject to sampling errors but may pro-vide a more consistent picture of the phenomenon of unemployment, as registration for benefit or assistance can be influenced by other factors.
The discussion in this Section indicates that, in summary, output figures must be treated with care because of the peculiar characteristics of the foreign-owned sector. Growth in the purchasing power of private sector output attributable to resi-dents has been much slower than that of the total private contribution to GDP. Taking these qualifi-cations into account, it is easy to explain why re-cent output growth has appeared much less job-intensive than in the past. As in the past, however, employment growth has fallen well short of what would be needed to prevent unem-ployment and emigration from increasing. That it has been unemployment that has borne a greater part of the deficiency of jobs on this occasion is
attributable to poor job prospects in Britain.
See Barry F.and J. Bradley, 1991, "On the Causes of Ireland’s Unemployment", The Economic and Social Review, Volume 22, No. 4.
As discussed in Chapter 3, the subsequent sharp fall in the birth rate will soon have striking consequences for pressure on public spending as well as for the labour market.
14 MEDIUM-TERM REVIEW: 1994-2000
2.4 The Surplus Economy: Use
of Resources
In this section we move away from issues of production and employment to the resources available to the economy and their use. As al-ready mentioned, national production generates an important part of the resources available to the economy, but it is augmented by transfers from abroad, especially from the EU. For many years, domestic spending, or "absorption", through consumption and investment exceeded available resources, implying a deficit on the balance of payments. Corresponding to this deficit was a very large increase in the net foreign indebtedness of the economy, and an in-creased acquisition of domestic assets by non-residents.
[image:22.593.72.287.368.526.2]#
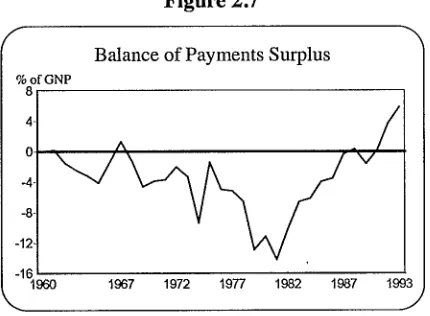
Figure 2.7
% of GNP 8
Balance of Payments Surplus
4. 0 -4- -8- -12--16
1960 1967 1972 1977 1982 1987 1993
As shown in Figure 2.7, the current account of the balance of payments was in deficit for every Year from 1967 to 1987, and again in 1989. But since then there has been a growing surplus, as available resources have exceeded spending. The balance of payments surplus, running at about 6 per cent of GNP in both 1992 and 1993, has been accompanied by a virtual cessation of Government net borrowing from non-residents, and an accumulation of foreign assets by finan-cial institutions and the domestic private sector. Five main factors were at work in this turna-round. First, a tighter fiscal policy; second, a
relatively favourable external environment in terms of demand, exchange rate developments and international interest rates especially between 1987 and 1990; third increased transfers from the EU; fourth, a reduction in the propensity of busi-ness to invest domestically out of earnings; and fifth wage restraint in the private sector. These factors are not unrelated. The favourable interna-tional demand environment and the wage restraint helped boost economic activity, profits and tax revenue. The lower interest rates helped the public finances directly, and allowed Government borrowing to be brought under control without in-creasing the tax share in GNP from 1984 on. It also improved the competitiveness of the domes-tic private sector. The increase in EU transfers was also a help to the budget, as well as directly increasing available national resources.
The sequence of events is quite clear. Three periods can be distinguished.
¯ From 1981 (when national saving was at its lowest and the balance of payments deficit at its highest) to 1987 there was a sharp fall in national investment, from about 30 per cent of GNP to 18 per cent. A significant part of this reduction took place in areas where the rate of return was low. Government, household and business sector investment all fell. There was a much smaller increase in national saving, concentrated in 1982, mainly reflecting increased household saving. The result was a sharp decline in the current account deficit of the balance of payments from almost 14 per cent of GNP to approximate balance in 1987. ¯ Between 1987 and 1990 international
the same magnitude. The offsetting behaviour of household saving, especially in 1988 and 1989, was an important factor, combined with the 1987-89 export boom, in preventing the fiscal contraction from resulting in depressed aggregate demand, as it had in the first half of the decade. There was also some recovery of private sector investment, mainly in 1989 and 1990. * From 1991 on the balance of payments
surplus expanded substantially as personal sector saving increased, and investment fell as a percentage of GNP in the face of high real interest rates and a recession in the rest of the world. The Government’s accounts were broadly stable in this period. A contributory factor to this stability was the rapid growth in EU transfers under the CSF which were paid to the Government. (In contrast, EU transfers to the agricultural sector under the CAP actually fall.)
An important corollary of this pattern of in-creased net saving in the economy is that do-mestic demand increased much more slowly than did GNP (cf. Figure 2.2). As already men-tioned, this shift in the pattern of demand goes some way to explaining the disappointing em-ployment performance. The sustained sluggish-ness of investment demand stands out. Investment in machinery and equipment is lower now in volume than it was in 1978. Even if some of the investment of the late 1970s was wasteful, the long-term adequacy of current le-vels must be questioned.
Monetary Factors
Among the factors influencing the time path of these spending patterns were developments in price and wage inflation and in monetary and exchange rate conditions.
Irish interest rates have been strongly in-fluenced by movements in foreign interest rates,
especially German rates. In addition there has been a series of speculative surges over the years,
of which the 1992-93 currency crisis was the most severe example. Since 1989 Irish interest rates have generally been close to German levels, but before then there was a lengthy period of gradual convergence (interrupted by the speculat-ive surges). In the post-1989 period German in-terest rates themselves were exceptionally high as
a result of unification.
Interest rate movements affect the economy not only through their impact on the timing of invest-ment decisions, and generally on the profitability of investment, but also through their impact on the Exchequer accounts. The latter effect is prob-ably the more important, as interest payments on the National Debt reached as much as 11 per cent of GNP in 1985. While the generally lower nom-inal interest rates of recent years have helped con-solidate the fiscal contraction, the effects of German unification, through raising German in-terest rates, have slowed the process.
Figure 2.8
/
% 130
Company Sector
Investment as a percentage of Savings
110
9O
70
50
1972 1~7 1~2 1987, 1993
16 MEDIUM-TERM REVIEW: 1994-2000
f
Box 2.3: German Unification and Interest Rates%
The unification of Germany at the end of 1989 and the resultant boom in the German economy caused a rise in the German inflation rate. To counteract the inflation the Bundesbank raised German interest rates. Other economies in Europe did not suffer from the same inflationary pressures while seeing their nominal interest rates rising in line with German rates. The result was a very substantial increase in real interest rates. Here we examine the effects on the Irish economy of a 2 percentage point rise in interest rates as a result of German unification.
[image:24.593.305.522.483.647.2]The change in interest rates affects the economy through a number of channels. Of these the most important in the medium term is the public fi-nances. Because of the high debt/GNP ratio a rise in interest rates of 2 percentage points directly in-creases Government expenditure by up to 2 per-centage points of GNP. If the Government prevents the borrowing requirement from rising tax rates would have to rise above the level they would otherwise have been (or other expenditure fall).
Table: Cumulative Effects of Higher Interest Rates
GNP Employment
Year % (000)
1 -2.8 -18.1
2 -3.5 -23.4
3 -3.6 -25.0
4 -3.9 -30.9
In the simulation we have assumed that, were it not for the high interest rates, direct tax rates would have fallen. This, in turn, would have resulted in lower wage increases and improved competitiveness. As shown in the attached Table, after 4 years the result of this shock, operating through a number of channels, was to hold GNP almost 4 percentage points below the level it would otherwise have been and to reduce employment by around 30,000. In the light of these results, the growth and employment performance of the economy since 1989 is surprisingly robust.
If the rise in interest rates attributable to German unification had not occurred in 1989 the economy could have developed very differently. This simulation highlights the potential importance of changes in interest rates in determining the future course of the Irish economy. Even at their current level, real interest rates remain quite high and they will continue to restrain investment and to encourage a
rela-~
ly high rate of savings in the economy in the future, t effects on output and employment in thetrad-able sector.
High interest rates have also reduced the rela-tive attraction for enterprises of investment di-rectly in productive assets, considering the rates of return available from riskless financial assets. This has contributed to the low share of com-pany savings being invested in fixed assets in Ireland, with the remainder being used to repay debt or invest abroad (Figure 2.8).
For the household sector the high interest rates may have contributed to a rise in the savings rate ~igure 2.9) and to a fall in investment,
es-/
peciaUy in private housing.
Figure 2.9
% 18
Personal Saving Rate
15-
12-6
1980 1982 1985 1988 1991 1993
,... /
EMS never implied an absolutely fixed ex-change rate against the DM but allowed for re-alignments. A negative aspect of realignments in the EMS was the fact that their potential existence made for interest risk premia which were much higher than was needed to compen-sate for the actual depreciation of the Irish pound against the DM.9
Taking a long view, the realignment option in the EMS has been used fairly flexibly by Ire-land, the 1992-93 crisis being by far the most protracted and severe. The Irish pound was de-valued against the DM eight times in a decade and a half, preventing the emergence of severe overvaluation. Still there has been quite a de-gree of fluctuation in the wage competitiveness of the Irish economy.
The importance of labour cost competitiveness was illustrated by the experience of 1987-88, when the strength of sterling and of the US dol-lar, combined with a vigorous demand expan-sion in the UK and elsewhere in Europe, provided the basis for a strong export (and tour-ism) expansion which underpinned the recovery of the late 1980s. Since August 1993 the currency is free to move in a much wider band against the DM (+/- 15 per cent), potentially re-inforcing its importance in influencing competitiveness.l°
2.5 Getting the Balance Right
Previous sections have highlighted the distinc-tion between various measures of aggregate economic performance. Even apart from the unique labour mobility, Ireland is unusual in the degree to which its economy generates (i) profits of foreign-owned firms (ii) net interest payments to non-residents (iii) the impact of sharp movements in (and a trend tendency to
decline of) the terms of trade (iv) transfers from abroad, both current and capital and (v) shifts over time in Government and business saving. This makes it especially important in Ireland to consider more than one aggregate indicator of economic performance. The discussion in Section 2 indicates that when these factors are taken into account using Gross National Disposable Income, it is clear that growth has been strong, but not by as much as appears at first sight. That is why it may not have "felt" as good as the data seemed to suggest. The composition of growth also meant that the return, in terms of increased employment, was disappointing.
An economy with a large balance of payments surplus and high unemployment is unusual and not in a balanced or equilibrium state. One simple analytical framework within which one can think about the condition of the economy and how it has evolved in the medium term is provided by an adaptation of a diagram introduced by Harrod and Swan many years ago. The diagram derives from a model of the economy which is driven in the short-run by autonomous investment and Govern-ment spending decisions, and in which the wage rate is fixed by negotiation - rather than automati-cally adjusting to eliminate unemployment. The model does not capture many important features of the Irish economy - especially the openness of the labour market to migration - but it does suggest an interpretation of some major trends. The model predicts two key relationships be-tween the two variables, autonomous spending and wages.
One relationship is represented by the combina-tions of wage and spending which will keep the economy close to full employment - or in the Irish context will eliminate the need for emigra-tion. This is a positively-sloped relation: the higher the wages, the more spending would be
9
10
See Honohan, P. 1992 An Examination of Irish Currency Policy Dublin :The Economic and Social Research Institute, Policy Research Series No. 18.
18 MEDIUM-TERM REVIEW: 1994-2000
required to keep full employment. We plot it as EE in Figure 2.10. Combinations of wage and spending in the zone above EE and to the left involve unemployment and probably emigration.
Figure 2.10
f External Payments Balance & Unemployment
Wage Rates
B,~ Jobs Gap, / E Payments Deficit /
p 1980s~ /
Jol3s G,’lp, "~ ~ ImmigI~iorl, PaymenlsStrplus~ ~x.x/ ~ PaymentsDeficit
Autonomous Expenditure J
The second relation represents the combinations of wage and spending which will yield balance of payments equilibrium. This is a negatively-sloped curve (plotted as BB): more spending will suck in imports, and that will have to be offset by greater international competitiveness. Combinations of wage and spending above BB and to the right are points of balance of pay-ments deficit.
Policies that achieve wage restraint move the economy down the diagram, policies that en-courage more domestic spending (public plus private) move the economy to the right. The diagram conceals much, such as the role of ex-pectations and the accumulation of indebtedness.
The arrows are included to present an inter-pretation of Ireland’s broad economic fortunes over the past two decades. The late 1970s saw return migration on a large scale, and this was associated with balance of payments deficit. Through the 1980s net immigration stopped and was then replaced by rising unemployment and large scale emigration. By 1993 a structural
bal-ance of payments surplus had emerged and we seemed to be clearly in the left hand quadrant. This situation could persist for a long time: downward pressure on real wages is not strong, and as long as business finds it more profitable to invest in financial assets or to invest abroad the payments surplus could continue. But it may shrink from any of a number of sources:
¯ A reduction in personal saving would result in increased demand - helping employment. ¯ A shift to a more expansionary fiscal policy
(Government dissaving) could have the same effect.
2.6 Conclusion
The impact of the turnaround in Irish growth performance has not yet been fully felt by the personal sector. For one thing, output growth during the last decade has not been fully matched by a comparable growth in the pur-chasing power of available national resources. More important, a growing share of available resources has been channelled to improving the balance of payments at the expense of con-sumption and investment. This effect was part and parcel of the successful efforts since the
early 1980s to stabilise the fiscal and interna-tional payments situation. This correction will not be needed in the years ahead although, of course, a reversion to irresponsible fiscal management must be avoided.
CHAPTER 3
Background Assumptions
3.1 Introduction
This Chapter sets out the context both international and domestic within which we have prepared our medium-term forecast for the Irish economy. There are three crucial sets of assumptions that underlie our central forecast.
The international economic environment ¯ Domestic demographic developments ¯ Domestic Government policy.
The international economy is of particular importance to Ireland given its status as a small and very open economy. Furthermore membership of the EU and the EMS places constraints on our freedom to pursue independent monetary, fiscal or trade policies. Section 3. 2 assesses the external environment in which the Irish economy will operate for the rest of the decade.
It begins with a description of the general current economic situation. The unification of Germany and its aftermath has dominated developments in Europe since 1989 and dictated monetary policy for most other European countries through the Exchange Rate Mechanism of the EMS. With Germany and Japan still close to the nadir of their recessions they are unlikely to make a major contribution to world growth before the middle of 1995. In the meantime, we believe the US economy holds the key to world trends.
The sustained expansion of the US economy over the medium term and the implications for foreign direct investment are of particular relevance to Ireland. We therefore focus first on reviewing the current recovery of the US economy and its prospects in the medium term.
We turn next to the Far East, and Japan in particular. We question whether the high rates of growth that characterised the Japanese economy in the 1970s and 1980s will continue through the
1990s.
We then consider the prospects for Europe and the outlook for the German and UK economies in the medium term. In the final part of this section, we detail our assumptions on interest and exchange rates, world trade and the likely stance of fiscal policy over the remainder of the decade. Section 3.3 focuses on the likely demographic changes in Ireland over the next 10 years. Already the falling birth rate has begun to have an effect. However, over the forecast period there will be a radical transformation of Irish society as a result of the demographic changes which are already under way.
In this Section we present our assumptions on the birth rate, participation in the educational system, and participation in the labour force. Between them these variables will play an important role in determining developments in unemployment, migration, and the public finances.
Section 3.4 presents our assumptions concerning domestic government policy and, in so far as it affects Ireland, EU policy. On monetary policy we assume that the Irish exchange rate will maintain a broadly unchanged rate vis-a-vis the DM over the next 5 years and that interest rate policy will be framed in this context.
In developing our assumptions on fiscal policy we take into account likely developments outside Ireland as well as the implications of the demographic changes, discussed in Section 3.3. We assume that fiscal policy will take the opportunity presented by steady growth to further reduce the burden of debt and to improve the long-term competitiveness of the economy. The probable advent of new EU members in Central Europe early in the next decade and the substantial improvement in Ireland’s position within the EU makes it likely that Structural Fund receipts will be reduced from the year 2000. We assume that Government policy over the next 6 years will be cast in the light of this possibility. This means that by 1999 the exchequer borrowing requirement should be eliminated. The full implications of these assumptions are discussed in Section 3.4.
3.2 The International Outlook
In preparing our forecasts for the world economy we drew on a number of different sources.1 In particular we used the NIESR February forecast as a basis for our medium-term forecast for the major world economies. This forecast was modified to take account of additional information available to us from a range of other sources. In carrying out these modifications and in examining the sensitivity of our forecast to
alternative assumptions we used the NIESR Global Econometric Model (NiGEM).2
As 1994 begins, economic activity in the industrialised countries continues to suffer from the recession that has lasted since early 1990. While recovery is now underway in those countries that were the first to slip into recession, the US, Canada, Australia, the UK and Scandinavia, the majority of countries in Europe and Japan remain mired in recession. Although the persisting weakness appears less serious than slumps in previous cycles it has proved to be of unusually long duration.
There are a number of reasons for this, most notably the ramifications for Europe of German unification. Unification resulted in an expansionary fiscal policy in Germany which, in turn, caused a tight monetary policy to be adopted by the Bundesbank in response to rising inflationary pressures. The reluctance of other European countries to devalue within the EMS added to the upward pressure on interest rates at a time when a more expansionary monetary policy might have been more appropriate to their circumstances.
Governments’ inability to move on monetary policy was not eased by freedom in fiscal policy. The large fiscal deficits faced by many countries closed off this possibility for manoeuvre out of the recession. The high real interest rates combined with the tight fiscal policy have helped prolong the recession. Furthermore, in some countries public finance deficits rose, due to the recession, despite cutbacks in spending.
Weak international economic activity also played a part in delaying an upswing. The cyclical mismatch between the US and UK, on the one Among the sources used were: the National Institute for Economic and Social Research (NIESR) Quarterly for February 1994, the OECD Economic Outlook, December 1993, The London Business School International Economic Outlook December 1993, the European Economy, Supplement A, "Economic Forecast 1993-1995", December 1993.
BACKGROUND ASSUMPTIONS 23
hand, and Europe and Japan, on the other, prevented either from providing the necessary stimulus. Recovery in the US was hesitant, partly as a result of a poor European export market. Likewise severe competition among already hard pressed European export producers did little in the way of stimulating economic activity in the recession ridden economies of Europe.
The US
While the US recovery is now securely underway it has been characterised by an extraordinary series of hiccups. A short lived upturn in the Summer of 1991 petered out into a decline of 0.7 per cent in GDP for the year as a whole, the first annual decline since 1982. While the first half of 1992 witnessed virtual stagnation, figures for the final quarter revealed the fastest real economic growth for 5 years. Expansion slowed again in the early months of 1993 and fears of a double dip recession began to surface. Such pessimism proved unwarranted as 1993 followed a similar pattern to 1992 with the second half of the year providing most of the annual growth. Preliminary figures show that GDP accelerated significantly in the final quarter of 1993, at an annual rate of over 7 per cent, with an increase of 2.9 per cent for the year as a whole. Real GDP growth is expected to be slightly higher at over 3 per cent in 1994. A more rapid acceleration in growth is unlikely due to the still weak external environment and the probable appreciation of the dollar.
While this recovery has not been remarkable by historical standards (the upswing from the 1982 recession witnessed growth rates of 5 and 6 per cent), it is impressive in the circumstances of the weak international environment and restrained public finances. The main indicators suggest that
conditions are favourable for a sustained expansion of the economy and, moreover, the structural changes that took place in the US economy since the mid-1980s leave it poised for continued growth in the medium term.
Inflationary pressures are low and are expected to remain so. The relaxed monetary policy pursued over the past 18 months is not expected to be significantly tightened in the immediate future. The private sector debt overhang which restrained the recovery is easing. To date consumption has lagged behind investment in stimulating the recovery because of caution on the part of households.
Unemployment, after a rather protracted lag, has begun to fall with strong employment growth in the services sector. In the industrial sector companies have so far responded to growing demand by adjusting working hours but a recovery in manufacturing employment is expected soon. The unemployment rate of 6.8 per cent for 1993 is expected to fall somewhat to under 6.5 per cent in 1994. For the remainder of the decade the rate of unemployment is expected to average just over 6 per cent.
The US economy is now in the position to reap the benefits of the corporate restructuring of the 1980s and early 1990s which saw a reduction in the private sector debt overhang and major technical change, in particular the wide application of computer technology.3 With the completion of this restructuring in the short run the sustained increase in output should have a parallel effect on employment while the increase in productivity growth implies faster long-run growth for both employment and output.