Ames Laboratory Accepted Manuscripts
Ames Laboratory
2-11-2019
Reshaping and sintering of 3D fcc metal
nanoclusters: Stochastic atomistic modeling with
realistic surface diffusion kinetics
King C. Lai
Iowa State University and Ames Laboratory, [email protected]
James W. Evans
Iowa State University and Ames Laboratory, [email protected]
Follow this and additional works at:
https://lib.dr.iastate.edu/ameslab_manuscripts
Part of the
Condensed Matter Physics Commons
This Article is brought to you for free and open access by the Ames Laboratory at Iowa State University Digital Repository. It has been accepted for inclusion in Ames Laboratory Accepted Manuscripts by an authorized administrator of Iowa State University Digital Repository. For more information, please [email protected].
Recommended Citation
Lai, King C. and Evans, James W., "Reshaping and sintering of 3D fcc metal nanoclusters: Stochastic atomistic modeling with realistic surface diffusion kinetics" (2019).Ames Laboratory Accepted Manuscripts. 264.
Reshaping and sintering of 3D fcc metal nanoclusters: Stochastic atomistic
modeling with realistic surface diffusion kinetics
Abstract
Far-from-equilibrium evolution of metallic nanocluster shapes is highly sensitive to the atomistic-level details
of surface diffusion for diverse local surface configurations. A stochastic model was developed incorporating
realistic values for the multiple diffusion barriers (contrasting previous unrealistic generic prescriptions) based
upon insights from homoepitaxial film growth. Kinetic Monte Carlo simulation then elucidates the
conversion of Ag nanocubes to Wulff polyhedra mediated by nucleation of new {100}facets, the pinch-off of
sufficiently elongated Ag nanorods, and key aspects of sintering for orientationally aligned Ag and Au
nanoclusters. The time scale for sintering of Au nanoclusters observed in high-resolution transmission
electron microscopy studies was also recovered.
Disciplines
Condensed Matter Physics
PHYSICAL REVIEW MATERIALS
3
, 026001 (2019)
Reshaping and sintering of 3D fcc metal nanoclusters: Stochastic atomistic modeling
with realistic surface diffusion kinetics
King C. Lai and James W. Evans
Department of Physics and Astronomy and Division of Chemical and Biological Sciences, Ames Laboratory, U.S. Department of Energy, Iowa State University, Ames, Iowa 50011, USA
(Received 27 May 2018; revised manuscript received 20 October 2018; published 11 February 2019)
Far-from-equilibrium evolution of metallic nanocluster shapes is highly sensitive to the atomistic-level details of surface diffusion for diverse local surface configurations. A stochastic model was developed incorporating realistic values for the multiple diffusion barriers (contrasting previous unrealistic generic prescriptions) based upon insights from homoepitaxial film growth. Kinetic Monte Carlo simulation then elucidates the conversion of Ag nanocubes to Wulff polyhedra mediated by nucleation of new{100}facets, the pinch-off of sufficiently elongated Ag nanorods, and key aspects of sintering for orientationally aligned Ag and Au nanoclusters. The time scale for sintering of Au nanoclusters observed in high-resolution transmission electron microscopy studies was also recovered.
DOI:10.1103/PhysRevMaterials.3.026001
I. INTRODUCTION
Solution-phase synthesis strategies for formation of three-dimensional (3D) crystalline metallic nanoclusters (NCs) have achieved remarkable control of NC structure [1,2] en-abling fine tuning of properties for applications, e.g., plasmon-ics or catalysis. Note that in such applications often NCs are removed from the solution-phase environment. However, NCs are intrinsically metastable, and thus are vulnerable to post-synthesis reshaping towards their equilibrium Wulff shapes. Also, ensembles of NCs can coarsen, e.g., via coalescence or sintering of mobile clusters [3,4]. On the nanometer scale, it is anticipated that the dominant mass transport mechanism facilitating reshaping and sintering is surface diffusion (also sometimes described as periphery diffusion) [5,6]. Assess-ment of the associated equilibration kinetics is important to determine robustness of the functionality of NCs. In situ
high-resolution transmission electron microscopy (HRTEM) studies [7–11] are providing increasingly high-fidelity imag-ing of such reshapimag-ing phenomena. However, there remains a need for realistic and predictive atomistic-level modeling for a more complete understanding of some intrinsically nanoscale features of behavior.
Classic deterministic continuum treatments of reshap-ing, typically with isotropic surface energy and diffusivity [5,12–14], predict that the relaxation time,τeq, for reshaping and sintering of macroscopic particles mediated by surface diffusion scales likeτeq∼N4/3 for NCs ofN atoms. Subse-quent theoretical and experimental analyses revealed complex phenomena such as void formation near the neck region for sintering particles [6], and also pinch-off for elongated shapes [10,15–17], both reminiscent of the Rayleigh-Plateau instability. A Langevin version of these formulations might be applied to smaller scale objects where fluctuations are more important [18]. However, it is recognized that such continuum treatments generally fail to adequately describe evolution on the nanoscale, noting that NCs are often strongly faceted
[19–21]. This failure also applies for two-dimensional (2D) epitaxial metallic NCs when linear sizes are below the per-sistence length of straight steps, or below other characteristic lengths determined by the details of the periphery diffusion kinetics [22–24].
Stochastic lattice-gas models analyzed by kinetic Monte Carlo (KMC) simulation can track the evolution of crystalline NCs over relevant time scales [19,21,25,26]. Such models can in principle incorporate the complex dependence of the activation barriers for hopping of surface atoms on the vast array of possible local atomic environments (e.g., hopping across facets, along straight step edges and around kinks, and between terraces and facets). However, such analyses have previously utilized generic prescriptions of these barriers, typ-ically the so-called Initial Value Approximation (IVA) or bond counting model where the barrier is determined entirely by the coordination in the initial state before hopping [7,19,21]. IVA does satisfy detailed balance guaranteeing evolution to the correct equilibrium structure, contrasting some treatments [26]. However, it fails dramatically to capture key features of surface diffusion in fcc metal systems. See AppendixA and Supplemental Material [27]. This severe failure includes incorrectly predicting the relative values of barriers for terrace diffusion on different facets, and of the barriers for step edge versus terrace diffusion [28], and also neglecting the presence of additional one-dimensional, 2D, and 3D Ehrlich-Schwoebel (ES) barriers for rounding of kinks, descent of monoatomic steps, and transport between facets [28–30]. These detailed features of surface diffusion are important for reliable treatment of NC reshaping. This failure of IVA is also evident when comparing results from KMC simulations for the evolution of 2D epitaxial NC shapes based on IVA models with those from realistic modeling, or with scanning tunneling microscopy experiments (see Supplemental Material [27]).
Furthermore, IVA hopping barriers include an arbitrary constant. This constant is often adjusted to fit the experimen-tal time scale for NC evolution [7] but IVA then produces
unphysical barriers. Alternatively, the constant can be ad-justed to fit some specific barrier, but then IVA fails to match time scales and appropriate values of other barriers.
In Sec. II, we present our strategy to craft a general formalism which reliably describes barriers for diverse sur-face hopping processes. We will exploit extensive insights from experimental and theoretical analyses of homoepitaxial fcc metal film growth and relaxation for multiple low-index substrate orientations [28,29] particularly for Ag [31–35]. This approach eliminates all of the deficiencies of IVA, and allows prediction of actual relaxation time scales. The latter is key for assessing robustness of metastable NC structures. In Sec.III, the model is applied to analyze reshaping of Ag NCs. First, we consider evolution of Ag nanocubes [1,36] to equilibrium Wulff shapes, which involves the erosion of
{111}corner facets and nucleation of new{100}side layers. Second, the pinch-off of elongated Ag nanorods or nanowires is assessed. In Sec.IV, the model is applied for sintering of Ag NC pairs following orientated attachment [37,38] identifying for aligned{100}facets distinct early-stage neck filling and late-stage nucleation-mediated reshaping regimes. In addition, the model is shown to capture the evolution and time scale observed in experimental HRTEM studies for sintering of
∼4-nm Au NCs. A summary of our analysis is presented in Sec.V.
II. MODEL FORMULATION
We consider crystalline fcc NCs with atoms interacting via an effective nearest-neighbor (NN) attractive interaction of strengthφ >0. The distance between NN atoms will be de-noted bya, which also corresponds to the surface lattice con-stant so, e.g.,a=0.289 nm for Ag. The effectiveness of this
description is supported by recent analysis in which the energy of NCs was decomposed as a sum of energies per atom,En, where theEndepend on the coordination,n, of the atom. This study demonstrated a near-linear variation ofEnwith coordi-nationn[39] consistent with a NN interaction model. We note that appropriate values of the effective interaction strength,φ, are typically far below those extracted from the bulk cohesive energy, Ec. For example, for Ag we will set φ=0.225 eV versusEc/6=0.492 eV (where the latter reflects the feature that each bulk atom in a fcc metal can be regarded as having 12 shared bonds with neighbors). It should be noted, however, that our choice ofφreasonably recovers surface energies for low-index facets for various metals. See AppendixB.
In this model, the equilibrium Wulff shape of NCs is a truncated octahedron bounded by {111}and{100}facets in the macroscopic regime. The lengths of edges joining{111} facets to{100}facets (a100), and to other{111}facets (a111), are equal [40]. On the nanoscale, these shapes are most closely achieved for certain magic numbers of atoms [41]. Choices witha111=a100and witha111=a100+1 (in units of surface lattice constant,a) correspond to local-energy minima [40]. The number of atoms, NW(a100,a111), in the NC satisfies
NW(3,3)=201,NW(3,4)=314,NW(4,4)=586, etc. Hop rates of surface atoms are selected to have an Ar-rhenius form, h=νexp[−Eact/(kBT)], for NC temperature T where ν is a common attempt frequency and Eact is the activation barrier. For hopping from an initial (i) site to a final (f) unoccupied neighboring fcc lattice site, Ei andEf
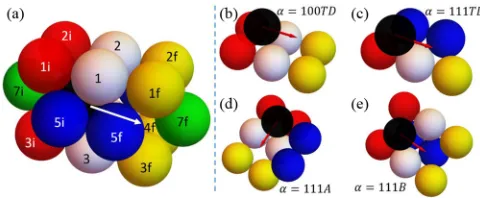
FIG. 1. (a) 18 sites impacting black atom hopping [44]. Four sites NN to both initial (i) and final (f) sites are labeled 1–4. Seven additional sites NN to i (f) are labeled 1i–7i (1f–7f). Some sites are not visible (4, 4i, 6i, 6f). These 18 NN sites can be either filled or empty. (b–e) four classes of intralayer terrace and edge diffusion. NN sites in (b–e) which must be filled are indicated.
denote the total interaction energy for the atom at these sites. Thus, Ei,f = −ni,f φ for atom coordination numbers
ni,f ranging from 1 to 11 for atoms with1 vacant NN fcc site. ETS denotes the total interaction energy at a transition state (TS) for hopping between these sites. Then, the acti-vation barrier,Eact(i→f), is given by Eact(i→f)=ETS−
Ei, where “symmetric” ETS is the same for forward (i→ f) and reverse (f→i) transitions, thereby ensuring detailed balance. The standard IVA bond-counting choice selects con-stant ETS=CIVA, whereas an alternative Metropolis choice selectsETS=CMET+max(Ef,Ei). However, we emphasize that both choices very poorly represent diffusion on fcc sur-faces. See Supplemental Material [27], Ref. [28], and Ap-pendixA. Thus, instead, our choice is a refined version of a symmetric Bronsted-Evans-Polyani form [42,43]:
ETS=Ca+1/2(Ei+Ef), so thatEact=Ca+1/2(Ef–Ei),
(1)
where instead of the standard selection of a singleCα we will assign multipleCαfor judiciously selected classes,α, of hops. To satisfy detailed balance, forward and reverse hops are always assigned to the same class,α, and thus have the sameCα. Since NN initial and final sites have four shared NN sites, and each have another seven NN sites, the occupancy of 18 sites impactsEact. Here, we are exploiting the modeling framework developed in Ref. [44]. See Fig.1(a).
We consider four basic classes of hopping: terrace dif-fusion on {100} facets or on {111} facets labeled by α= 100TD orα=111TD, respectively [Figs.1(b)and1(c)], and edge diffusion along a{100}-microfaceted A step or a{111} -microfaceted B step on a{111}facet labeled byα=111A or α=111B, respectively [Figs.1(d)and1(e)]. It is appropriate to note that edge diffusion along a close-packed step on a
[image:4.608.315.555.70.169.2]RESHAPING AND SINTERING OF 3D fcc METAL … PHYSICAL REVIEW MATERIALS3, 026001 (2019)
Each of the above basic hopping classes is divided into two subclasses. The first subclass is intralayer diffusion where both the initial and the final state are fully supported at a hollow site created by atoms in the lower supporting layer. Here,Cαadopt “base values”Cα=cα. We set
c100TD=0.425 eV, c111TD=0.100 eV, c111A=0.275 eV,
c111B=0.300 eV for Ag, (2)
effectively capturing actual terrace and edge diffusion barriers for low-index Ag surfaces (in marked contrast to the IVA prescription) [28,31–35]. One significant point is that some hopping processes involve a transition between an edge atom at the step edge (with one or more lateral neighbors) and one on the terrace (with no lateral neighbors). In this case, both forward and reverse processes are assigned to the terrace diffusion class.
The second subclass corresponds to interlayer diffusion. First, we consider cases where a fully supported atom hops out over a step edge to a site which is not fully supported. In such cases, the rate for such a hop can be impacted by ES barriers,δES. Here, we set
Cα=cα–mφ/2 (+δES), formmissing supporting atoms.
(3)
The term −mφ/2 inCα compensates for the feature that 1/2(E
f−Ei)= +mφ/2 for a perfect step with a single atom on the upper terrace, resulting inEact =cα(+δES) for that case. Whether or notδESis included depends upon the details of the step edge configuration. For interlayer diffusion on a Ag{100} facet,δES is included for m=2 (descending a close-packed step), but not form=1 (descending at a kink). Why? A finite ES barrier exists for hopping down a close-packed step, but not at a kink where exchange is facile [28]. Thus, for an atom initially with no lateral NN, one has Eact=c100TD(c100TD+ δES) form=1 (m=2) . For interlayer transport from an Ag
{111}facet,δESis included ifm=1, but not form=2. Why? Descent is facile from a B step or kink at an A step (m=2), but not from an A step or kink at a B step (m=1) [34]. In both cases, we setδES=0.10 eV reasonably matching the best estimates of ES barriers for Ag [28,32,34]. Finally, we note again that to satisfy detailed balance, for the reverse process of an atom hopping back to a fully supported site, one assigns the sameCα as for the forward process of hopping out over the step edge.
We emphasize that our formulation for realistic kinetics is general, although one needs to revise the selection of values for Cα,φ, and δES for different metals. Appropriate values for Pt follow from Ref. [29], and for Au are pre-sented in Sec. IV. However, the appropriate prescription for inclusion of an ES barrier can be system dependent, e.g., the details for Pt based on detailed analysis of interlayer transport for that system [29] differ from those for Ag. In the following sections, we perform extensive KMC simulations of this model to precisely characterize NC reshaping and sintering.
III. RESHAPING OF Ag NANOCLUSTERS
A. Relaxation of Ag nanocubes to Wulff shapes
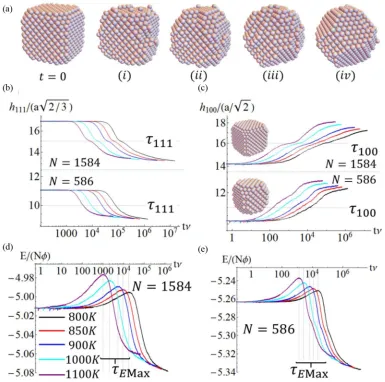
Nanocubes can have distinctive plasmonic properties given their shape, and also distinctive catalytic properties given that the exposure of {100} facets is maximized. Consequently, there is interest in stability against nanocube reshaping, as is reflected by recent HRTEM studies and associated analysis [45]. It was suggested that the barrier to shift an atom from the edge of a nanocube to the terrace was key in controlling re-shaping [45]. Our analysis indicates that a more complex nu-cleation process controls overall shape relaxation. Complete nanocubes with {100}facets have unstable low-coordinated edges and corner and edge atoms. Thus, to mimic synthesized near-perfect nanocubes [1,36], we start with truncated Ag nanocubes where all atoms have at least six NNs. See Fig.2(a) for timet=0.
Below, we assess the temperature dependence and size dependence of relaxation to the Wulff shape. In Figs.2(b) and 2(c), we monitor the “width” h100 (h111) between the outermost{100}facets ({111}facets) on opposite sides (cor-ners) of the nanocube. These quantities are naturally rescaled by interlayer spacing [a/√2 for{100}facets and layers, and
a/√(3/2) for{111}facets and layers] to monitor the evolution of the number of {100} and {111} layers. This definition identifies every plane with at least one atom as a layer. The evolution from a truncated nanocube to a Wulff shape involves formation of new {100} layers on the sides of the initial nanocube, and erosion or dissociation of{111}facets at the corners. Results for larger sizeN =1584 atoms show distinct stages in these formation and dissociation processes. Apart from the final equilibrium plateau, there is a weak plateau for
h100andh111changing by two layers. This corresponds to the nucleation of one new layer on each{100}facet, and complete dissociation and removal of a{111}facet from each corner. Note that nucleating a layer on just one side, or removing a layer from just one corner, but not the other, is evidently a rare transient state.
To assess theT dependence of the evolution, we introduce characteristic times, τrelax=τ100 and τ111, reflecting signifi-cant evolution ofh100andh111, respectively, from their initial values [specifically, a change by two layers, as indicated in Figs.2(b) and2(c)]. From these characteristic times, we assess effective Arrhenius energies, Eeff. For τrelax=τ111, which characterizes dissociation of a{111}corner facet and transfer of its atoms to a{100}facet, Arrhenius analysis of KMC results forτ111 yields Eeff ≈0.7 eV. Considering the NC starting as a perfect truncated nanocube, a corner atom on the{111}facet transfers to the{100}facet via what can be re-garded as a kink site on a close-packed step edge for the{100} facet. The barrier for the first stepEact =0.525 eV is relatively low. However, in the second step to reach the final adsorption site on the{100}facet, which isE = +2φabove the initial site energy, the atom must surmount a barrier of energycTD100 above the final-state energy. Thus, the overall atom transfer barrier isEeff =c100TD+E =0.875 eV, comparable to the simulation result. Note that, for higher T, entropic factors associated with thermal excitation are significant, and not incorporated in our analysis.
FIG. 2. Ag nanocube reshaping: (a) Configuration snapshots (N=1584,T =1100 K).T-dependence of time evolution of rescaledh111(t)
in Fig.2(b), rescaledh100(t) in Fig.2(c), and of the scaled total energy in Fig.2(d)and Fig.2(e), forN=586, 1584 averaged over 400 trials.
Atoms freed from {111}facets diffuse onto {100}facets and nucleate new {100} layers, a process characterized by τrelax=τ100, for which Arrhenius analysis of KMC results yields a distinct and higherEeff ≈1.1 eV. Here, we naturally analyze the formation of a relatively stable square tetramer of atoms on{100}facets. Consider first the transfer of three of the 12 atoms on the initial complete{111}corner facet to a single{100}facet to form a trimer. This involves breaking a total of eight lateral bonds on the{111}facet, but forming two lateral bonds in the trimer, and increasing coordination to supporting atoms on the {100} facet for a total energy change ofE123= +3φ. LetE4denote the barrier for transfer of a fourth atom from the {111}facet to the {100}facet to stabilize the trimer. This process is controlled by a last step to reach a{100}adsorption site yielding a barrierE4 =0.75 eV. This implies an effective nucleation barrier of Eeff =E4+ E123=1.42 eV. However, if the trimer is at the{100}facet edge so that the atom from the{111}facet can hop directly into a site with two lateral bonds forming the square tetramer, thenE4is reduced to 0.525 eV, andEeff =1.20 eV, reasonably consistent with simulation results.
We also track the total NC energy,E[Figs.2(d)and2(e)], and define a reshaping timeτrelax=τEMax corresponding to
the peak energy. Both peak and late stageE are larger for higherT due to entropic effects. Arrhenius analysis forτEMax yieldsEeff ≈0.72 eV, coinciding with that forτ111. Thus, the energy maximum corresponds to the early-stage disruption of {111} facets, E decreasing only after new {100} layers nucleate and grow.
It should be emphasized that the above results for the evolution of h111, h100, and E are obtained from extensive KMC simulation averaging over several hundred trials. This is necessary to minimize the effect of substantial fluctuations at the nanoscale, and to thus obtain precise results for charac-teristic times and Arrhenius energies. We also note that almost perfect Arrhenius behavior of characteristic times is observed over the probed temperature range (see Supplemental Material [27]). The identified Arrhenius behavior allows prediction of relaxation time scales for lower T. The nucleation process with the higher Eeff ≈1.1 eV will be rate controlling, im-plying that, e.g.,τrelax=τ100≈10−3.6, 10−0.8, and 103.8 s at 500, 400, and 300 K, respectively, for N=1584, choosing ν=1012.5s−1. These estimates are actually lower bounds as
RESHAPING AND SINTERING OF 3D fcc METAL … PHYSICAL REVIEW MATERIALS3, 026001 (2019)
τrelax∼Nβ corresponding to the late stages of the process yieldsβincreasing for decreasingT fromβ≈1.3 at 1000 K to β≈1.7 at 800 K. Deviations for lower T below the classic continuum value of β =4/3 indicate the presence of a nucleation-mediated process with finite effective barrier [19,21]. This observation is consistent with our assessment that the evolution ofh100, and specifically that the Arrhenius energy extracted fromτ100, is controlled by the nucleation of new{100}layers.
B. Pinch-off of Ag nanorods
Within the framework of continuum modeling, shape evo-lution of objects mediated by surface or periphery diffusion, which is of relevance here, can differ qualitatively from curvature-driven evolution [46]. In addition, it can differ from evolution mediated by inhibited attachment-detachment (also described as evaporation-condensation), which is also con-trolled by local curvature. For 2D systems, Grayson’s theorem [47] shows that pinch-off is not possible for curvature-driven evolution, and it has been argued that the same is true for the evaporation-condensation mechanism [48]. However, pinch-off can occur for evolution mediated by periphery diffusion in 2D systems, as has been observed in experiment and modeling for metallic surface systems [48]. For 3D systems, Grayson’s theorem does not prohibit pinch-off for curvature-driven evolution, and no doubt pinch-off can also occur for evaporation-condensation. Furthermore, one anticipates that the propensity for pinch-off in three dimensions is substan-tially greater for evolution mediated by surface diffusion versus curvature. Indeed, analysis of the evolution of near-cylindrical rods via continuum theory for isotropic surface energy and diffusivity indicates an instability with wavelength λ≈4.45×rod diameter [11]. Such behavior is reminiscent of the Rayleigh-Plateau for fluid steams or jets. This result implies that elongated structures with sufficiently large aspect ratio,R, will also pinch off, and provides a prediction of the critical aspect ratio of about Rc=4.5. Certainly, behavior on the nanoscale will differ quantitatively from the above continuum predictions. However, it is reasonable to expect that qualitative features such as pinch-off will be preserved.
NC synthesis can produce elongated nanorods for various metals, so it is natural to explore if postsynthesis evolution leads to pinch-off, and to determine the associated Rc. In-deed, experiments involving metallic nanowires [16], theory [14], and atomistic simulation (but based on evaporation-condensation and not satisfying detailed balance) [17], in-dicate the existence of a pinch-off instability for large R. However, it is appropriate to recognize that the key feature in evolution of nanorods is the presence of strong fluctuations. As a result, evolution for a range of initial aspect ratios,R, has a significant probability for either pinch-off or achieving a single compact Wulff shape. For this reason, we introduce the concept of a pinch-off probability,P(R), which will increase monotonically with initial aspect ratioR. We can determine
P(R) by running multiple independent simulations of nanorod evolution, and assessing the fraction of times that pinch-off occurs.
[image:7.608.315.556.67.288.2]We consider this issue by applying our model to analyze specifically the evolution of readily synthesized octagonal Ag
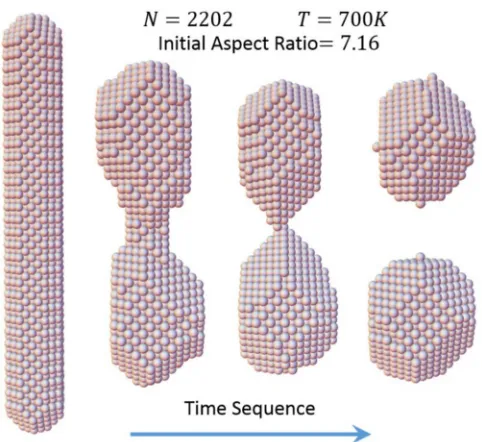
FIG. 3. Pinch-off of an octagonal Ag nanorod withN=2202 at
T =700 K.
nanorods which have alternating{100}and{110}side facets, and{100}end facets [1]. An example of simulated evolution for R =7.16 which leads to pinch-off is shown in Fig. 3. Multiple simulations for nanorods with this and many other
R values (while retaining a fixed nanorod width) lead to the results forP(R) versus R shown in Fig.4. Naturally defining a critical aspect ratio,Rc, viaP(Rc)=1/2leads to the estimate ofRc=6.9 somewhat above the classical continuum value.
As an aside, we have also considered pinch-off for elon-gated Ag nanobars with a square cross-section and all faces corresponding to{100}facets. In this case, the critical aspect ratio isRc≈8–9 for the selected cross-section side length of about 1.7 nm.
IV. SINTERING OF ORIENTED PAIRS OF Ag AND Au NANOCLUSTERS
Sintering of pairs of roughly equal-sized NCs with equi-librated Wulff shapes can follow oriented attachment [37,38]
FIG. 4. Simulated pinch-off probability of Ag nanorods at 700 K as a function of initial aspect ratio.
[image:7.608.326.544.587.725.2]FIG. 5. Schematic of geometric evolution during sintering of NCs with (a) aligned{100}facets and (b) aligned{111}facets.
which could involve alignment of either{100}facet planes or
{111}facet planes, and where in addition there is azimuthal alignment so the combined attached NC pair has a single-crystal fcc structure. This latter feature is necessary in order to apply our modeling formalism. Before applying our atomistic-level model to analyze evolution during the sintering process following such attachment, it is instructive to show simple geometric schematics which illustrate the anticipated shape evolution, and which we note is distinct for aligned{100} ver-sus{111}facets. Figure 5illustrates the initial configuration just after oriented attachment, the facets which are present upon filling in the neck region to first create an overall convex shape, as well as the ultimate Wulff shape. On the nanoscale, which we consider, fluctuations will inhibit the formation of such simple geometric shapes with well-defined facets. However, we shall find that some of the qualitative features shown in Fig.5are still evident.
A. Sintering of equal-sized Ag Wulff nanoclusters
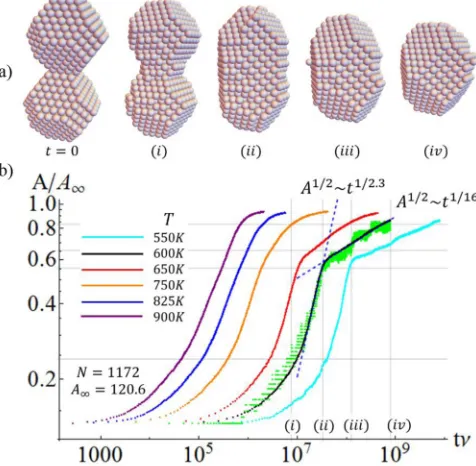
We first consider sintering for equal-sized Ag Wulff NCs initially joined by oriented attachment with aligned {100} facets. Simulated evolution atT =600 K is shown in Fig.6(a) for sintering of a pair of NCs each witha100=a111=4 and
NW(4,4)=586, so that the total size equals N=2NW = 1172 atoms. Initial rapid evolution involves transfer of atoms from the ends of the NC pair to the concave neck region where they are readily captured at existing step edges. See Fig.6(ai). When the neck is filled in, one obtains a convex elongated structure as shown in Fig.6(aii), the sides of which ideally correspond to alternating{100}and{110}facets as illustrated in Fig. 5(a). Late-stage equilibration involves transfer of atoms from the ends of the convex elongated shape, nucleating new {100}layers on the {100}side facets, and eliminating
{110}side facets. See Fig.6(aiii).
FIG. 6. (a) Sintering Ag Wulff NC pair with aligned{100}facets and withNW=586 andN=2NW=1172 at 600 K. (b) Evolution of
the scaled neck area forN=1172 and variousT averaging over 400 trials (35 trials at 550 K). Green data points: single trial at 600 K.
Traditional continuum treatments of surface diffusion me-diated sintering of spherical particles focused growth on ra-dius of the neckr∼tα predicting that [6,12]α=1/7. This exponent reflects the initial singular cusplike nature of the neck region in this classic continuum problem, and thus it should not apply for our system. Nonetheless, we analyze neck growth considering the average number of atoms, A, in each of the two{100}planes at the center of the NC pair orthogonal to their long axis. Thus,Ameasures the neck area, andA1/2reflects the “radius”r. We estimate the limiting value,
A∞, ofAast → ∞, from the Wulff-like equilibrium cluster. Figure6(b)shows the evolution ofA/A∞for N=1172 and variousT. The first stage leading to formation of a convex-shaped NC is facile with no evidence of classic scaling, and ends whenA/A∞reaches around 0.6. A sharp transition from this first stage to the late stage of evolution (which we show to be nucleation mediated) is only evident below 750 K [see Fig.6(b)].
Despite the lack of classic scalingA1/2 ∼tαwithα=1/7 for shortt, we extract an effective exponent,αfill, based upon the slope of the log-log plot in Fig. 6(b) at the inflection point corresponding to the neck filling regime (just below the elbow for lower T). For N=1172, we obtain values from αfill≈0.43 at 600 K to αfill≈0.24 at 900 K. An effective αnuc≈0.06 is extracted for the late-stage regime at 600 K similar to the analysis in Ref. [21], although we discount its significance. From the trajectory of a single simulation at 600 K (green data), it is evident that the increase in A
involves distinct steps in the late-stage regime corresponding to nucleation of new layers (thus justifying our description of this regime as nucleation mediated).
[image:8.608.317.555.74.307.2]RESHAPING AND SINTERING OF 3D fcc METAL … PHYSICAL REVIEW MATERIALS3, 026001 (2019)
filling stage) andτnucdetermined whenA/A∞=0.85
(reflect-ing the final nucleation-mediated stage). Arrhenius analysis forτfillyieldsEeff ≈0.75 eV. In a simplistic analysis, a corner atom of the{100}facet transfers to the{111}facet. The barrier for just the first step isEact=0.75 eV. However, in the second step to reach the final adsorption site on the{111}facet which is E = +3φ above the initial site energy, the atom must surmount a barrier of energycTD111+δESabove the final-state energy. Thus, the effective barrier for atom transfer isEeff =
c111TD+δES+E =0.875 eV, comparable to the simulation result, given our neglect of entropic effects. Arrhenius anal-ysis for τnuc yields Eeff ranging from 0.85 eV forN=402 to 1.10 eV forN =1172, and our simulation results indicate slightly higher values forN=1172 at lowerT. The value for
N =1172 is similar to the barrier nucleation of{100}facets for nanocube equilibration and that analysis also applies here. Finally, we have also analyzed size scaling, τfill∼Nβ, for the neck filling regime where β roughly matches the classic continuum value of β=4/3 for allT. For the late-stage regime, the exponent,β, instead defined bytnuc∼Nβ, increases upon decreasing T from around the classic value of β =4/3 for very high T to β ≈1.5−1.6 at 900 K to β ≈2.8 at 600 K. This is behavior analogous to that for nucleation-mediated nanocube reshaping.
We emphasize that the results for evolution of neck area,
A, shown in Fig.6 are typically obtained from several hun-dred simulation trials. This reduces statistical uncertainty and allows precise extraction of characteristic times, which we find exhibit near-perfect Arrhenius behavior for the range of
T which is considered. This allows reliable determination of the associated Arrhenius energy.
We have also considered sintering of equal-sized Ag NCs initially joined with aligned{111}facets retainingN=1172. In this case, no transition to late-stage nucleation-mediated evolution occurs even for lowerT. This feature is expected as no low-index{100}side planes are formed, and no nucleation upon such facets is required (see Ref. [21] and Supplemen-tal Material [27]). Sintering is faster by a factor of 2–3 at 600 K than for aligned{100}facets, Eeff ≈0.70–0.71 eV is somewhat below that for the filling stage for aligned {100} facets, andβ ≈4/3 for allT consistent with the feature that that evolution is not nucleation mediated (see Supplemental Material [27]). Finally, we remark that our analysis for both aligned{100}and{111}facets should be compared with the comprehensive IVA modeling in Ref. [21], which considers larger NCs than those treated here.
B. Sintering of Au nanoclusters: Comparison with HRTEM observations
[image:9.608.325.542.69.276.2]A key aim of modeling studies should be direct comparison with experiment, both for validation of the modeling and also to elucidate experimental observations. In situ liquid-cell HRTEM studies are providing increasingly detailed data enabling such comparison, although caution in interpretation is required, e.g., given possible e-beam effects. One such previous study presented HRTEM imaging of the sintering of “large” 10-nm Au nanoparticles and utilized IVA modeling to elucidate observed behavior [7]. As noted in Sec.I, IVA includes a free parameter which was adjusted in this analysis
FIG. 7. Sintering of ∼4-nm Au NCs. (a) HRTEM at 300 K. Adapted from Ref. [9] with permission from The Royal Society of Chemistry. The initial (final) image is 2 s (128 s) after impingement. (b) Simulated evolution forN=4812 at 600 K.
to match the experimental time scale of evolution. In contrast, one key goal of our modeling with realistic surface diffusion kinetics is to reliably predict this time scale. Our focus is also on substantially smaller NCs than those considered above. Fortunately, recent HRTEM imaging has provided appropriate data on shape evolution for such smaller NCs [8,9]. We apply our model to analyze sintering of ∼4-nm Au NCs slightly laterally displaced as monitored in recent HRTEM studies by Yuket al.[9]. In general, when Au NCs merge, they are not aligned, but a single-crystal structure is subsequently achieved by grain boundary migration or by NC rotation. However, in one data set from Ref. [9] partly reproduced in Fig.7(a), the NCs are almost perfectly aligned upon merging, so we model subsequent evolution in this case.
However, for this modeling, it is necessary to first pre-scribe appropriate Au model parameters. We selectc100TD= 0.60 eV, c111TD=0.125 eV, c111A =0.35 eV, and c111B= 0.40 eV for Au. This choice is based on density functional theory (DFT) analysis of terrace diffusion barriers [49], and general trends relating terrace and edge diffusion barriers [28]. We selectδES=0.12 eV based on studies of Au surface dynamics [50] and semiempirical energetics [51]. An effective φ=0.22 eV is consistently selected based on either DFT analysis of NC energetics [39] or DFT analysis of Au surface energies [52].
For the HRTEM data shown in Fig.7(a), the∼4-nm Au NCs appear to be slightly laterally displaced or misaligned upon attachment. We mimic this situation in our simulations, where we also choose a total size ofN=4812 roughly match-ing experiment. We have shown that the offset somewhat increases the initial rate of neck growth, not surprisingly since this makes the neck region a stronger sink for capturing atom diffusion from the ends on the NC pair. Even though we utilize KMC simulation rather than molecular dynamics, it is still computationally demanding to directly simulate
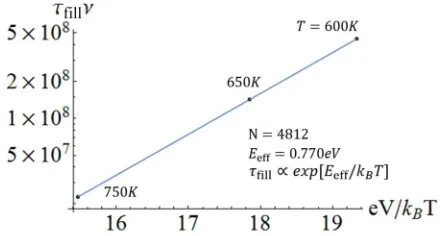
FIG. 8. Arrhenius behavior of the characteristic time, τfill, for
neck filling for the sintering of ∼4-nm Au NCs with aligned but laterally offset{111}facets forN=4812.
evolution for this larger system at the experimentalT =300 K over the time scale needed to follow the overall sintering process (which is hundreds of seconds at 300 K). However, simulation is much more efficient at higherT. For purposes of illustration, results for shape evolution at 600 K are shown in Fig.7(b). To connect with experiment, our strategy is to per-form simulation for a range of higherTto determine the relax-ation timeτfill(usingA/A∞=0.6) versusT. See Fig.8. From these results, we extract an effective Arrhenius energy,Eeff ≈ 0.77 eV, forτfill. These results are then extrapolated to esti-mateτfill∼130 s at 300 K where we choose a conventional at-tempt frequency ofν=1013s−1. This prediction for the time to achieve a convex shape is consistent with experiment [9].
V. SUMMARY
In summary, we have developed a predictive atomistic-level stochastic model for far-from-equilibrium shape evolu-tion of fcc metal NC shapes mediated by surface diffusion. Significantly, our modeling incorporates a realistic prescrip-tion of surface diffusion kinetics. This requires accurate de-scription of diffusion barriers for a diversity of local environ-ments. This paper contrasts previous more generic stochastic atomistic modeling with unphysical prescription of barriers and thus kinetics, and also classic continuum modeling which exhibits fundamental shortcomings in describing behavior on the nanoscale. Our model is primarily applied to reliably describe reshaping and sintering of faceted Ag NCs. Signif-icantly, for the effective Arrhenius energies controlling the
T dependence of relaxation times, we are able to provide an atomistic-level interpretation and analysis. For example, for the characteristic time for reshaping on Ag nanocubes, we associate the Arrhenius energy with the effective barrier to nu-cleation of relatively stable square tetramers on{100}facets. In addition, in contrast to generic modeling, our approach allows prediction of the absolute time scale from reshaping, which is key in assessing the robustness of NCs synthe-sized with targeted nonequilibrium shapes. This capability is demonstrated by prediction of the time for sintering of∼4-nm Au NCs as observed in HRTEM studies.
ACKNOWLEDGMENTS
This work was supported by the U.S. Department of En-ergy (USDOE), Office of Science, Basic EnEn-ergy Sciences,
Division of Chemical Sciences, Geosciences, and Biosciences through the Ames Laboratory Chemical Physics program. The work was performed at Ames Laboratory, which is operated for the USDOE by Iowa State University (ISU) under Contract No. DE-AC02-07CH11358. Partial support is also acknowl-edged from an ISU Presidential Interdisciplinary Research Seed grant.
APPENDIX A: IVA VERSUS REALISTIC SURFACE DIFFUSION BARRIERS
As noted in Sec.I, accurate description of surface diffusion kinetics, including both terrace and step edge diffusion, is necessary for realistic and predictive modeling of 3D NC evolution. Furthermore, the formulation must simultaneously provide an accurate description of behavior on both {100} and {111} facets, noting that these are most prominent on fcc NCs. Our formulation, used for simulation of surface diffusion mediated 3D NC evolution, is crafted to incorporate the flexibility to include desired values for both terrace diffu-sion and edge diffudiffu-sion barriers via appropriate selection of
c100TD,c111TD,c111A, andc111B. These values may be obtained from appropriate assessment of experimental data or directly fromab initioDFT analysis. In contrast, previous IVA based modeling does not include this flexibility. In fact, we clarify here that IVA imposes extremely unrealistic values for barriers for these key diffusion processes.
The IVA atom hop rates have the form h=
νexp[−Eact/(kBT)], with Eact=CIVA+niφ for initial coordination number ni, includes the free parameter CIVA. For modeling of processes on a specific low-index extended surface,CIVA is typically chosen to ensure that IVA recovers the terrace diffusion barrier for that low-index surface [28,53]. However, a different choice is required for each different low-index surface, so it is not possible to correctly describe simultaneously terrace diffusion on different facets of 3D nanoclusters.
Consider the case of Ag selecting a NN interaction strength φ=0.225 eV. First, consider modeling targeting Ag diffusion on Ag{100} surfaces. If one wants to recover a reasonable terrace diffusion barrier of, say,Ed(100)=0.425 eV [28,31], then since Ed(100)=CIVA+4φ one must select CIVA =
−0.475 eV. Consequently, this formulation of IVA imposes a diffusion barrier on{111}facets ofEd(111)=CIVA+3φ= 0.20 eV, which isdoublethe true barrier ofEd(111)=0.1 eV [28,54].
RESHAPING AND SINTERING OF 3D fcc METAL … PHYSICAL REVIEW MATERIALS3, 026001 (2019)
Second, for modeling targeting Ag diffusion on Ag{111} surfaces, since Ed(111)=CIVA+3φ, one must now choose CIVA = −0.575 eV to recover a reasonable value of
Ed(111)=0.10 eV [28,54]. It follows that this IVA prescrip-tion enforcesEd(100)=CIVA+4φ=0.325 eV substantially below the more realistic value ofEd(100)=0.425 eV noted above. Even if we just consider diffusion on the Ag{111} surface within this IVA formulation, there are still significant shortcomings in the description of step edge diffusion. One has thatEe(111)=CIVA+5φ=0.550 eV, which is the same for A- and B-type steps, and is well above the realistic and distinct estimates ofEe(111)|A=0.275 eV andEe(111)|B= 0.300 eV for the two different types of step edges [33].
The severe consequences of this failure of IVA kinetics (and the success of our treatment) are illustrated by the results of KMC simulations for the formation during deposition of 2D epitaxial Ag nanoclusters on low-index {100}and{111} Ag surfaces. Given the artificially high step edge diffusion barriers in the IVA prescription, this formulation predicts fractal island structure whereas the actual structure is compact as confirmed by scanning tunneling microscopy experiments or realistic modeling. See Supplemental Material [27].
Another clear and serious shortcoming of the IVA for-mulation regarding reshaping of 3D nanoclusters is that the formulation does not and cannot include any ES barriers. However, these additional barriers are important in controlling the rate of mass flow between layers and facets [28].
APPENDIX B: THERMODYNAMICS OF FCC METAL NANOCLUSTERS
Our prescription of the energetics of various NC configu-rations via a lattice-gas model with NN pairwise interactions of effective strength, φ, is applied to evaluate differences,
Ef–Ei, between energies of initial and final configurations. As noted in Sec. II, support for the effectiveness of this simple prescription comes from a recent DFT analysis of the energetics of fcc NCs [39]. The key idea in this paper is that
the total energy of the NC can be decomposed into a sum of energies for the individual atoms, En, where these energies depend solely on the coordination, n, of the atom. These coordination-dependent single atom energies are determined in a systematic fashion from DFT calculations considering mainly atoms at surfaces with different local configurations and coordination numbers. The key result for various metals is thatEnvaries nearly linearly withn, i.e.,En≈A−Bn (with B>0), over the considered coordination range,n3.
Given this behavior, reliable determination ofEf–Ei can be achieved by a model with NN pairwise interactions if one choosesφ=2B. (Here we note that an atom with coordina-tionnis regarded as havingnshared bonds of strengthφwith NN atoms, so the energy of half of each of these bonds is associated with the atom.) Such an analysis of results from Ref. [39] indicates that the effective φ≈0.20, 0.28, 0.38, 0.40, and 0.64 eV for Ag, Cu, Ni, Pt, and Ir, respectively. For Au,Enversusndeviates more from linearity with higher (lower) values of the effectiveφfor smaller (larger)n, and we selectφ=0.22 eV.
We argue that these values predominantly reflect the NC surface rather than bulk thermodynamics. This feature is sup-ported by the observation that similar values for the effective φ can be extracted from DFT results for {111} and {100} surface energies usingγ111=√3φ/a2andγ100=2φ/a2 for the NN interaction model. Here, a denotes the surface lat-tice constant. From results of DFT analysis for γ111 using the Perdew-Burke-Ernzerhof functional [52] one obtainsφ= 0.23, 0.31, 0.43, 0.41, and 0.61 eV for Ag, Cu, Ni, Pt, and Ir, respectively. For Au, one obtainsφ=0.22 eV. Quite similar values are obtained using DFT values forγ100, e.g., yielding φ=0.21 eV for Ag andφ=0.23 eV for Au.
As already indicated in Sec. II, if Ec denotes the bulk cohesive energy, then the above values for effective φ are far from the choiceφ(bulk)=Ec/6 which would recover the bulk thermodynamics. Specifically, one has that φ(bulk)= 0.49, 0.58, 0.74, 0.97, and 1.16 eV for Ag, Cu, Ni, Pt, and Ir, respectively, andφ(bulk)=0.64 eV for Au.
[1] Y. Xia, Y. Xiong, B. Lim, and S. E. Skrabalak,Angew. Chem. 48,60(2009).
[2] L. D. Marks and L. J. Peng, J. Phys.: Condens. Matter 28,
053001(2016).
[3] L. Ratke and P. W. Voorhees,Coarsening and Growth: Ostwald Ripening in Material Processes(Springer, Berlin, 2001). [4] N. T. K. Thanh, N. Maclean, and S. Mahiddine,Chem. Rev.
114,7610(2014).
[5] W. W. Mullins,J. Appl. Phys.28,333(1957). [6] J. Eggers,Phys. Rev. Lett.80,2634(1998).
[7] T. H. Lim, D. N. McCarthy, S. C. Hendy, K. J. Stevens, S. A. Brown, and R. D. Tilley,ACS Nano3,3809(2009).
[8] J. M. Yuk, J. Park, P. Ercius, K. Kim, D. J. Hellebusch, M. F. Crommie, J. Y. Lee, A. Zettl, and A. P. Alivisatos,Science336,
61(2012).
[9] J. M. Yuk, M. Jeong, S. Y. Kim, H. K. Seo, J. Kim, and J. Y. Lee,Chem. Commun.49,11479(2013).
[10] L.-M. Lacroix, R. Arenal, and G. Viau,J. Am. Chem. Soc. (Comm.)136,13075(2014).
[11] X. Ye, M. R. Jones, L. B. Frechette, Q. Chen, A. S. Powers, P. Ercius, G. Dunn, G. M. Rotskoff, S. C. Nguyen, V. P. Adiga, A. Zettl, E. Rabani, P. L. Geissler, and A. P. Alivisatos,Science 354,874(2016).
[12] G. C. Kuczynski,J. Appl. Phys.20,1160(1949).
[13] C. Herring,The Physics of Powder Metallurgy(McGraw-Hill, New York, 1951), pp. 143–79.
[14] F. A. Nichols and W. W. Mullins, J. Appl. Phys. 36, 1826
(1965).
[15] C. Bréchignac, Ph. Cahuzac, F. Carlier, C. Colliex, J. Leroux, A. Masson, B. Yoon, and U. Landman,Phys. Rev. Lett.88,196103
(2002).
[16] A. Volk, D. Knez, P. Thaler, A. W. Hauser, W. Grogger, F. Hoferb, and E. Ernst, Phys. Chem. Chem. Phys. 17, 24570
(2015).
[17] V. Gorshkov and V. Privman, J. Appl. Phys. 122, 204301
(2017).
[18] S. V. Khare and T. L. Einstein,Phys. Rev. B57,4782(1998). [19] N. Combe, P. Jensen, and A. Pimpinelli,Phys. Rev. Lett.85,
110(2000).
[20] W. W. Mullins and G. S. Rohrer,J. Am. Ceram. Soc.83,214
(2000).
[21] D. N. McCarthy and S. A. Brown, Phys. Rev. B80,064107
(2009).
[22] C. R. Stoldt, A. M. Cadilhe, C. J. Jenks, J.-M. Wen, J. W. Evans, and P. A. Thiel,Phys. Rev. Lett.81,2950(1998).
[23] P. Jensen, N. Combe, H. Larralde, J. L. Barrat, C. Misbah, and A. Pimpinelli,Eur. Phys. J. B11,497(1999)
[24] D.-J. Liu and J. W. Evans,Phys. Rev. B.66,165407(2002). [25] P. Jensen,Rev. Mod. Phys.71,1695(1999).
[26] V. Gorshkov, V. Kuzmenko, and V. Privman,Cryst. Eng. Comm. 15,7177(2013).
[27] See Supplemental Material athttp://link.aps.org/supplemental/ 10.1103/PhysRevMaterials.3.026001for further description of IVA versus realistic simulations of 2D epitaxial NC growth (S1), Ag nanocube reshaping (S2), pinch-off of Ag nanorods (S3), sintering of Ag NCs with aligned{100}(S4) and {111} (S5) facets, and sintering of Au NCs (S6).
[28] J. W. Evans, P. A. Thiel, and M. C. Bartelt,Surf. Sci. Rep.61,1
(2006).
[29] T. Michely and J. Krug,Islands, Mounds, and Atoms(Springer, Berlin, 2004).
[30] S. K. Xiang and H. Huang,Appl. Phys. Lett.92,101923(2008). [31] S. Frank, H. Wedler, R. J. Behm, J. Rottler, P. Maass, K. J. Caspersen, C. R. Stoldt, P. A. Thiel, and J. W. Evans,Phys. Rev. B66,155435(2002).
[32] K. J. Caspersen, A. R. Layson, C. R. Stoldt, V. Fournee, P. A. Thiel, and J. W. Evans,Phys. Rev. B65,193407(2002). [33] E. Cox, M. Li, P.-W. Chung, C. Ghosh, T. S. Rahman, C. J.
Jenks, J. W. Evans, and P. A. Thiel,Phys. Rev. B71,115414
(2005).
[34] M. Li, P. W. Chung, E. Cox, C. J. Jenks, P. A. Thiel, and J. W. Evans,Phys. Rev. B,77,033402(2008).
[35] Y. Han, C. R. Stoldt, P. A. Thiel, and J. W. Evans,J. Phys. Chem. C120,21617(2016).
[36] A. Ruditskiy and Y. Xia,J. Am Chem. Soc.138,3161(2016). [37] M. A. van Huis, L. T. Kunneman, K. Overgaag, Q. Xu, G.
Pandraud, H. M. Zandbergen, and D. Vanmaekelbergh,Nano Lett.8,3959(2008).
[38] H. Zhang, J. J. De Yoreo, and J. F. Banfield,ACS Nano8,6526
(2014).
[39] L. T. Roling, L. Li, and F. Abild-Pedersen,J. Phys. Chem. C 121,23002(2017).
[40] C. R. Henry,Prog. Surf. Sci.80,92(2005). [41] T. P. Martin,Phys. Rep.273,199(1996). [42] J. N. Bronsted,Chem. Rev.5,231(1928).
[43] M. G. Evans and M. Polyani, Trans. Faraday Soc. 34, 11
(1938).
[44] L. Li, P. N. Plessow, M. Rieger, S. Sauer, R. S. Sánchez-Carrera, A. Schaefer, and F. Abild-Pedersen,J. Phys. Chem. C121,4261
(2017).
[45] M. Vara, L. T. Roling, X. Wang, A. O. Elnabawy, Z. D. Hood, M. Chi, M. Mavrikakis, and Y. Xia,ACS Nano11,4571(2017). [46] H. Garke,Jahresber. Dtsch. Math.-Ver.115,63(2013). [47] M. A. Grayson,J. Diff. Geom.26,285(1987).
[48] W. W. Pai, J. F. Wendelken, C. R. Stoldt, P. A. Thiel, J. W. Evans, and D.-J. Liu,Phys. Rev. Lett.86,3088(2001). [49] L. T. Roling and M. Mavrikakis,Nanoscale9,15005(2017). [50] P. Spurgeon, K. C. Lai, Y. Han, J. W. Evans, and P. A. Thiel
(unpublished).
[51] P. Stoltze,J. Phys.: Condens. Matter6,9495(1994).
[52] R. Tran, Z. Xu, B. Radhakrishnan, D. Winston, W. Sun, K. A. Persson, and S. P. Ong,Sci. Data3,160080(2016).
[53] S. Clarke and D. D. Vvedensky,J. Appl. Phys.63,2272(1988). [54] H. Brune, K. Bromann, H. Roder, K. Kern, J. Jacobsen, P. Stoltze, K. Jacobsen, and J. Norskov,Phys. Rev. B52,R14380