Debye process and dielectric state of an alcohol in a nonpolar solvent
G. Power, Mamatha Nagaraj, J. K. Vij, and G. P. Johari
Citation: The Journal of Chemical Physics 134, 044525 (2011); doi: 10.1063/1.3543713 View online: http://dx.doi.org/10.1063/1.3543713
View Table of Contents: http://scitation.aip.org/content/aip/journal/jcp/134/4?ver=pdfcov Published by the AIP Publishing
Debye process and dielectric state of an alcohol in a nonpolar solvent
G. Power,1Mamatha Nagaraj,1J. K. Vij,1and G. P. Johari2,a)
1Laboratory of Advanced Materials, Department of Electronic Engineering, Trinity College,
University of Dublin, Dublin 2, Ireland
2Department of Materials Science and Engineering, McMaster University, Hamilton,
Ontario L8S 4L7, Canada
(Received 3 November 2010; accepted 24 December 2010; published online 28 January 2011)
To investigate the origin of the first order molecular kinetics of the most prominent, Debye-type polarization, a detailed dielectric relaxation study of 66.5, 40, and 20 mole% solutions of 5-methyl-2-hexanol in 2-methylpentane (2:1, 0.67:1, and 0.25:1 molar ratios) was performed. The Debye-type polarization remains prominent in the solutions, despite the extensive loss of intermolecular hydrogen bonds. At high temperatures, its contribution to permittivity extrapolates close to the statistically scaled values for the 2:1 solution. For others, the measured values of its contribution crossover the scaled values in a temperature plane. The faster relaxation process of about 4% magnitude has an asymmetric distribution of times in the solutions and, relative to those of the pure alcohol, their values decrease on heating more at high temperatures and less at low. This is attributed to an increase in the alcohol cluster size by consumption of monomers as well as the growth of smaller clusters as the solution is cooled. It is argued that structural fluctuation in solutions, as in the pure alcohol, is determined by the rates of both the Debye-type and the faster polarizations in the ultraviscous state. © 2011 American Institute of Physics. [doi:10.1063/1.3543713]
I. INTRODUCTION
Nearly 95% of electrical polarization in many monohy-droxy alcohols1,2and alkyl amides3,4follows the first order kinetics of exponential decay with time, or a single, Debye-type relaxation. In contrast, the majority of ultraviscous liquids and most alcohols, including some monohydroxy al-cohols, have shown a distribution of relaxation times, or a
non-exponential decay of polarization.5 Anderson and
Ullman6had discussed these two types of relaxations in terms
of fluctuation of a dipole relative to its environment. Accord-ingly, a Debye-type relaxation is observed when the rate of “free volume” or environmental fluctuation is much faster than the rate of dipolar reorientation. In contrast, a relaxation time distribution is observed when the rate of dipole reorien-tation is comparable to or much faster than the rate of envi-ronment fluctuation.6 They implied that there is a spectrum of structures in a liquid with varying abilities to undergo re-orientation and are all in dynamic equilibrium with one an-other. This variation in the environment of the local order may be seen to correspond to diffusion in the “fluctuating free volume.”6
In an extensively hydrogen-bonded liquid, an H-bond must break before a dipole may reorient. After an H-bond has broken, the molecule may either form an H-bond with the same neighbor without reorienting, or it may form an H-bond with another neighbor. In the first case, no dipolar re-orientation occurs, and in the second case dipolar reorienta-tion occurs. Thus there are two processes, first breaking of an H-bond and then orientation diffusion. Dipolar reorientation would occur during the time period an H-bond remains bro-ken. Accordingly, one may consider a consecutive reaction,
a)Electronic mail: joharig@mcmaster.ca.
A→B→C; A→B for H-bond fluctuations and B→C for the dipolar reorientation. In a case when the process A→B is slower than the process B → C the H-bond fluctuations would not only determine the Brownian diffusion but also the dipolar reorientation kinetics. As these fluctuations follow the first-order kinetics, the dielectric relaxation has a single relaxation time, as for the single Debye-type process.
Most liquids show an asymmetric distribution of relax-ation times, which may indicate dynamic heterogeneity.7–9
Conceptually, it represents a multiplicity of Debye-type sin-gle relaxation processes, as originally described mathemati-cally by Majumdar10 to explain a distribution of relaxation
times. In the sense of local detail of the structures that may be in a dynamic equilibrium, it comes closer to the Anderson and Ullman’s mechanism for the distribution of times.6 However, despite the expected dynamic heterogene-ity in a binary solution, ultra-viscous 1 wt% solution of di-n-butyl ether in 3-methylpentane,11 in which intermolecular H-bonds do not form, has also shown a Debye process. A review of various studies and issues arising from interpreta-tion of the Debye-type relaxainterpreta-tion have appeared in the con-text of dielectric features of 5-methyl-2-hexanol solution in isoamylbromide.12Since then, several groups have attempted
to interpret the Debye process observed for another alco-hol, 2-ethyl-1-hexanol, by comparing its dielectric features against the features observed by calorimetry,13 mechanical
spectroscopy14 and also by studying the effects of high
pres-sure on dielectric properties.15,16 This comparison has led
to a controversial interpretation. Fragiadakis et al.15 have
provided a brief and updated review of this controversy. Dilution of an alcohol by a nonpolar solvent tends to break the extensive intermolecular H-bonded structure by steric hindrance. This changes the dielectric relaxation
044525-2 Poweret al. J. Chem. Phys.134, 044525 (2011)
strength, ε. In the absence of any solute–solvent interac-tion,εscaled by the mole fraction of the components would agree with the measured value. But if one component is in-termolecularly H-bonded and scaling still gives a value com-parable to that measured, the finding would suggest that the H-bond interactions in the solution do not change signifi-cantly. But if the scaledεis found to differ from that mea-sured, the H-bond interactions would have changed and that would change the characteristics of the dielectric relaxation.
It is expected that as the extent of H-bonding decreases, or else the H-bond strength decreases, structural fluctuation would become less constrained, and the state of a liquid would explore a larger number of configurations at a given temper-ature. This would increase the configurational entropy and accordingly decrease the structural relaxation time accord-ing to the configurational entropy theory. (Neither this theory takes into account the distribution of relaxation times nor the free volume theory). Therefore, a partially H-bonded structure would have a shorter relaxation time than a fully H-bonded structure. The distribution of relaxation time for structural re-laxation however may not be the same as that for dielectric relaxation because the first requires configurational fluctua-tions which do not require change in the dipole vector and the second requires only a change in the dipole vector, irre-spective of the state of H-bonded molecules or their cluster sizes. Thus structural fluctuations may be distinguished from H-bond fluctuations in some cases. Here we used these con-cepts as a premise, and performed a detailed dielectric in-vestigation of ultraviscous solutions of 5-methyl-2-hexanol in a nonpolar solvent, 2-methylpentane of three concentrations that correspond to the molar ratios of 2:1, 0.67:1, and 0.25:1 of the alcohol to solvent. Our investigations show that, (i) the Debye-type relaxation persists in the solution, (ii) the relax-ation time is much less than that of the pure alcohol at low temperatures than at high temperatures, and (iii) the relax-ation times of the solution and of the pure alcohol become closer asTis increased. We interpret these findings in terms of the presence of intermolecularly H-bonded clusters of alco-hol molecules in the solutions, or aggregation at a nanoscale. The general premise of our interpretation is that if a fea-ture of pure liquid persists on dilution, it would indicate an unchanging mechanism of polarization with changing struc-ture in the solution. We consider it necessary to use the di-electric relaxation alone and thus avoid the uncertainty arising from comparison of the structural relaxation-related, mech-anistically different calorimetric, and mechanical responses. It is hoped that studies of solutions in nonpolar solvents in general would be used in the future for resolving whether or not calorimetric and mechanical relaxations admit to the same phenomenology as dielectric polarization.
II. EXPERIMENTAL METHODS
For preparing the 2:1 molar ratio solution, we used the 5-methyl-2-hexanol and 2-methylpentane samples left over from our earlier studies.12,17,18 For the 0.67:1 and 0.25:1
solutions, 5-methyl-2-hexanol was purchased from Sigma– Aldrich and distilled in vacuum. The technique for measure-ments is the same as before.12,17,18 Briefly, the dielectric
FIG. 1. (A) The dielectric permittivity and (B) loss spectra of 2:1 solution at selected temperatures. The solid lines in panel (A) are the composite fits to Eq.(1). Symbols denote experimental data points.
cell used was a silver-plated stainless steel miniature capac-itor with 24 plates, and a nominal capacitance of 27 pF in air, which was accurately measured prior to each experiment and whose empty cell capacitance showed no change over the temperature range 100–300 K. The capacitor has an in-consequential amount of stray capacitance which was inde-pendent of the dielectric permittivity of the liquid. Solutions of 5-methyl-2-hexanol in 2-methylpentane were prepared by weighing in small glass bottles, which were sealed and stored in a refrigerator at 278 K until their dielectric study. The ca-pacitor was inserted in a 10 mm diameter and 33 mm long glass vial holding the liquid at 298 K. Care was taken to en-sure that no air bubbles were trapped between the capacitor plates. A 100 platinum resistance temperature sensor was also inserted into the cell and it rested above the capacitor but still in the liquid.
The temperature of the sample was maintained to within
±0.1 K for several hours, as required for a single measure-ment at megahertz frequencies, by using a specially designed Oxford Instruments cryostat for the purpose. The dielectric permittivity and loss, ε and ε spectra were measured by using an Alpha-A analyzer and ZG4 dielectric interface pur-chased from Novocontrol.
III. RESULTS AND DATA ANALYSIS
The ε and ε spectra of 5-methyl-hexanol in
2-methylpentane solutions were measured over a temperature range of 104–199 K. Typical spectra for the 2:1 (mol:mol) composition solution, which are provided in Figs. 1(A)
[image:3.612.319.554.47.345.2]FIG. 2. The Cole–Cole plots for 2:1 solution at (A) 137.7, (B) 160.6, and (C) 198.9 K.
and1(B), show the evolution of the relaxation processes with change in the temperature,T. The spectra ofεin Fig.1(B)
show also the contribution from the dc conductivity, σdc,
which may be due to the diffusion of impurity ions in the solution, but it is small and causes no significant electrode polarization, and its effect onε is too small to be observed. A shoulder in theεspectra at higher frequencies indicates a further relaxation (process II), whoseεpeak is overwhelmed by the large contributions from the spectra of the slower pro-cess I. The four ε andε spectra at T < 145 K in Fig. 1
indicate a further (inverted) sigmoid-shape decrease in εin the 104– 105Hz frequency range, indicating the presence of
a yet faster relaxation process which is overwhelmed by con-tribution to εfrom processes I and II. In order to examine these features qualitatively, Cole–Cole plots at 137.7, 160.6, and 198.9 K are shown in Fig.2. Here the effect ofσdcis seen
as a vertical rise of the plot on the right hand side at the low-est frequencies. Process II and a further relaxation together constitute the foot of the plot beforeεdecreases to 2.3.
Since the magnitude of the fastest relaxation process is extremely small, it was neglected and the ε andε spectra were analyzed to resolveσdcand only processes I and II. The
relation for the complex permittivity used is,19
ε∗(ω)=ε−jε=ε
∞+
I I
i=I
εi
(1+(jωτH N i)αi)βi
− jσdc ε0ω
,
(1)
where ω=2πf (f being the frequency in Hz), and ε0 is
the permittivity of free space. The subscript i denotes the ith relaxation process, εi =εsi−ε∞i is the dielectric
re-laxation strength of this process, τH N i is the characteristic
(Havriliak–Negami19) relaxation time, α
[image:4.612.84.268.49.307.2]i and βi are
FIG. 3. The resolution of the (A)εand (B) spectrum of 2:1 solution mea-sured at 141.5 K. The fit of Eq.(1)to theεandεdata is shown by thick solid lines. Symbols denote experimental data points. The contributions of process I and II, and the dc conductivity loss term to the fit are shown by the thin solid, dashed, and dotted lines, respectively. The fit parameter values areεI =27.6,τHNI=5.29 s,αI=1.00,βI=0.925,εII=0.642,τHNII=19.6 ms,αII=0.772,βII=0.259,ε∞=2.33, andσdc=8.60×10⁻¹⁴S m−1.
respectively the symmetric and asymmetric broadening pa-rameters. The term— jσdc/ε∞ω takes into account the σdc
contribution, and ε∞ is the sum of the permittivity contri-butions from vibrational, ionic, and electronic polarizations. The imaginary part of Eq.(1) was fitted to the loss spectra by using the WinFit dielectric fitting program purchased from Novocontrol, and the various parameters in Eq.(1)were de-termined. Fitting to the real part of the permittivity was also carried out for some of the solutions to further refine the fitted parameters.
The continuous lines forεin Fig. 1(A)are for the fit-ted curves. A typical fitting to two relaxation processes is shown for the spectra at 141.5 K in Fig. 3. The fit parame-ters areεI =27.6,τHNI =5.29 s,αI =1.00,βI =0.925, εII=0.642,τHNII=19.6 ms,αII=0.772,βII=0.259,ε∞ =2.33, andσdc=8.60×10⁻¹⁴ S m−1. The individual
con-tributions from processes I and II in the overall fit of the data are also shown in Fig. 3. Here,ε∞ is insignificantly differ-ent from the limiting high-frequency permittivity of process II. The contribution to permittivity from dipolar orientation,
εwas obtained from the difference between the static per-mittivity,εsat a temperatureTandε∞estimated from spectra
measured atTTg.12,18 Dielectric spectra obtained for the
044525-4 Poweret al. J. Chem. Phys.134, 044525 (2011)
TABLE I. The distribution of relaxation times parametersαIandβI and the fit parameters for the Vogel–Fulcher–Tammann equations. Subscript I refers to the Debye process and II to the next faster process.
Composition αI(βI) −log(AI) BI T0,I −log(AI I) BI I T0,I I
1 : 0 (pure)a 1.00(0.95) 14.43 2775 79.8 13.20 1325 112.3
2 : 1 0.98(0.94) 11.38 1591 84.4 10.50 662.5 104.4 0.67 : 1b 1.00(1.00) 10.02 799.68 86.78 10.96 490.59 94.3
0.25 : 1c 1.00(1.00) 8.67 598 88.0 10.06 376.14 92.78
aFrom Ref.20. bT-range 133–190 K. cT-range 120–155 K.
The plots ofε,εI, and εII for the 2:1 solution are
shown in Fig.4 and those ofεI andεIIagainstTfor the
0.67:1 and 0.25:1 mol:mol solutions are shown in Figs.5and
6, respectively. For comparison, the corresponding values for pure 5-methyl-2-hexanol from previous studies20are included
in Fig.4.
Parameters α and β characterize the shape of the re-laxation spectra. For a Debye rere-laxation α =β =1; for a Davidson–Cole distribution,19 α =1 andβ < 1; and for a
Cole–Cole distribution,19 α <1, andβ =1. The value ofα
I
andβI (TableI) show Debye relaxation at allT. TheαIIand βIIvaried withT. For the pure alcohol,αII=0.57±0.09, and βII=0.79±0.05 (160 – 190 K) from previous studies.20For
FIG. 4. Plots of (A)ε, (B)εI, and (C)εI I 2:1 solution against the temperature. Filled data points are for the pure alcohol, open data points are for the solution, and crossed data points are for the alcohol scaled to the solution composition. The lines are meant as a guide to the eye.
the 2:1 solution,αII=0.6 to 0.2, andβII =0.3 to 1.0 (140
– 170 K) and for the 0.67:1 solutionαII=0.38 to 0.59, and βII =1.0 to 0.7 (133 – 154 K). Lastly, for 0.25:1 solution, αII=0.6 to 1.0, andβII=0.28 to 0.12 (126 – 143 K).
Theεpeak frequency observed in an isothermal spectra for processes I and II was converted to the relaxation timesτI
andτIIand these values are plotted logarithmically againstT
in Fig. 7, where data for the pure 5-methyl-2-hexanol taken from an earlier study20 are included. The Vogel–Fulcher–
Tammann equation,21–23
τ =Aexp
B (T −T0)
, (2)
was fitted to the data in Fig. 7 and the fit is shown by the lines. Values of the fit parametersA,B,andT0for processes I and II are listed in TableI. (Note that the data for process II are approximate because of the errors in resolving it from the prominent spectra of process I).
[image:5.612.86.266.370.701.2]It is of interest to consider how the temperature effect may be quantitatively related to the dilution effect. For this analysis, the net change inτIresulting from change inTand
FIG. 5. Plots of (A)εIand (B)εI I0.67:1 solution against the tempera-ture. Open data points are for the solution and crossed data points are for the alcohol scaled to the solution composition. The lines are meant as a guide to the eye.
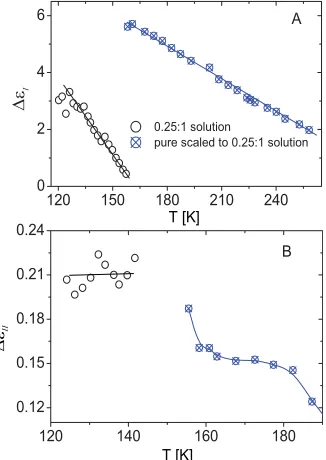
[image:5.612.354.523.463.706.2]FIG. 6. Plots of (A)εI and (B)εI I0.25:1 solution against the tempera-ture. Open data points are for the solution and crossed data points are for the alcohol scaled to the solution composition. The lines are meant as a guide to the eye.
in the solution’s composition may be written as, dτI =(∂τI/ ∂T)xdT+(∂τI/∂x)Tdx, wherexis the mole% of the
alco-hol. Since (∂τI/∂T)xis negative and (∂τI/∂x)Tis positive, the
temperature equivalence of dilution may be calculated. For example, if the temperature of the pure alcohol is decreased from 207.5 to 190.8 K,τIincreases from 10 to 287μs
accord-ing to the plots in Fig.7. Thereafter, when the pure alcohol at 190.8 K is diluted to 66.5 mol%,τI decreases and its value
is restored to 10μs. Similar analyses may be done for other temperatures and dilution and for otherτIorτIIvalues.
[image:6.612.63.289.523.705.2]Also, if there were no change in the H-bond interactions on dilution and if such interaction varied withTfor the pure
FIG. 7. Plots ofτI (filled symbols) and ofτI I (open symbols) (shown on a logarithmic scale) for pure and 2:1, 0.67:1, 0.25:1 solutions against the temperature. The solid lines are the fits of Eq.(2)to the pure 5-methyl-2-hexanol and solutions. The fit parameters are listed in TableI.
and dissolved states of alcohol identically, the net change in εI would also be the sum of two contributions, d εI =(∂εI /∂T)x dT+(∂εI /∂x)T dx. Since the term (∂εI/ ∂T)xis negative and (∂εI/∂x) is positive, one may be able to
estimate the temperature equivalence of dilution.
IV. DISCUSSION
A. Relaxation strength and hydrogen bonding
Figure4(A)shows thatεof the 2:1 solution is less than that of the 5-methyl-2-hexanol. If the extent and mechanism of the dielectric fluctuations did not change on dilution, it would be equal to the scaled value,xεalcohol, wherexrefers to the mole fraction andεalcoholtoεof the pure alcohol.
The measured ε is higher atT < 175 K, and it may ap-pear that it crosses over the scaled value atTof∼200 K, but their shape shows that the measured ε may extrapolate to the scaled values atT>195 K. Sinceε1is only slightly less
thanε, the corresponding plots in Fig.4(B)show similarity. For the 0.67:1 solution, the measured and the scaledε1
seem to cross at T of ∼160 K in Fig. 5. At 190 K, the measuredε1 is 38.1% less than the scaled value. This
sug-gests that ε1 in this solution would originate in a local
structure whose polarization (per mole of the alcohol) has de-creased from the corresponding polarization in 2:1 solution and in the pure alcohol. The plots in Fig.6show that for the 0.25:1 solution at 157 K the difference in ε1 increases to
92% and at 148 K the (extrapolated) difference is 76%. It may appear that further dilution of the 2:1 solution shifts the crossover to a lower temperature, and while it can be seen for the 0.67:1 solution at ∼160 K, it is not seen for the 0.25:1 solution because of lack of data atT<129 K.
To compare these findings against those for solution in a polar solvent, (i)εof the 0.25:1 molar solution of 5-methyl-2-hexanol in isoamylbromide measured at 156 K was∼35% of the correspondingly scaledε,18and (ii)εof the 0.25:1 molar solution ofn-propanol in isoamylbromide measured at 120 K18 was also∼35% of the scaled value of the puren -propanol. Therefore, even though both the nonpolar and polar solvents disrupt intermolecular H-bonding, the consequences of the disruption for equilibrium dielectric properties differ.
Both the relatively weak short-range correlations due to intermolecular H-bonds and stronger dipole–dipole interac-tions have an effect on ε. These interactions are included in the statistical theory of dielectric polarization given by Onsager,24 Kirkwood,25 and Fröhlich.26 It expresses the
044525-6 Poweret al. J. Chem. Phys.134, 044525 (2011)
solution. But if there were a crossover of the two curves, it would indicate that atT<190 K,gis higher for the solution than for the pure alcohol and atT>190 K, it is lower. The crossover of the plots for the 0.67:1 solution indicates that at T<160 K,gis higher for the solution than for the pure alco-hol and atT>160 K, it is lower and for the 0.25:1 solutiong is lower over the entire temperature range of our study.
It is also worth comparing how dilution of an alco-hol by a nonpolar as well as a dipolar solvent effects the dielectric relaxation features through changes in in-termolecular H-bonding, as for example in solutions of, (i) n-propanol with 2-methylpentane,27 (ii)
1-phenyl-2-propanol with 2-methylpentane,17 (iii) isoamylbromide with
2-methylpentane,28 (iv) n-propanol with isoamylbromide,18
(v) 5-methyl-2-hexanol with isoamylbromide,12 and (vi) n
-butanol withn-butyl bromide.29Denny27originally discussed some of these studies in terms of clustering of the alco-hol molecules as was evident from the two relaxation spec-tra he observed for solutions in polar solvents and a simi-lar discussion has appeared more recently.12,18 It was found that for concentrations greater than 50 mol% n-propanol in 2-methylpentane, the Debye relaxation persisted. For lower concentrations, the spectra changed to a skewed arc shape of the Davidson–Cole formalism, and a further small relaxation polarization was found before ε decreased to ε∞ value,30
but the origin of this polarization remained uncertain. Denny and Ring’s data forn-propanol solution in 2-methylpentane30
yield εI as 27.8 at 150.4 K for the 2:1 solution, andεI
as 51.8 at 150 K for pure n-propanol. Scaling ofεI of n
-propanol to the solution concentration yields 34.5. This would be the value ofεI if the extent and type of intermolecular
H-bonding remained unchanged from pure alcohol to the so-lution state. The measuredεIof 27.8 is∼21% less than the
scaled value, which indicates a significant decrease in bothg on dilution and the internal field effect, the latter being deter-mined by the term [εs/(2εs+ε∞)][(ε∞+2)/3]2for a
spher-ical dipole surrounded by other dipoles.24 For solutions, the
magnitude of this term decreases as εs decreases and it
ap-proaches unity at infinite dilution. (Note that this decrease allows one to determine the dipole moment of an isolated molecule by measuringεsof dilute solutions.31)
Effects of change in the alcohol clustering and in the in-ternal field on dilution are relevant to our interpretation. If alcohol molecules were to form H-bonded clusters, the num-ber of near neighbors shielding a molecule would not change from that in the pure liquid. Therefore, there would be no change in ε due to the internal field effects. In that case only the change in g that results from change in the extent of H-bonding would be observable. (Even if the 2:1 solution were homogeneous at a nanoscale, the molar ratio seems high enough to maintain some intermolecular H-bonds). It is also worth noting that the relative effects of the decrease in the in-ternal field and in H-bonding of a variety of alcohols in ben-zene solutions at 298 K (Ref. 32) had shown that H-bonds form even at concentrations as low as 0.04:1 molar ratio so-lutions. This seems tantamount to H-bond cluster formation. Moreover, Schwerdtfegeret al.33have shown that for higher
concentrations of homologous alcohols in n-alkanes at 298 K, the most prominent relaxation is Debye-like, but at lower
concentrations it changes to the Cole–Davidson skewed arc type. They discussed the relaxation time and the shape of the spectra observed for the solutions in terms of “wait and switch” model of relaxation by considering the effect of non-polar hydrocarbon groups on the activation enthalpy of the relaxation process, and concluded that the concentration of H-bond partners has a dominant role in the dielectric relax-ation. From our previous studies, εI of 0.67:1 solution of
1-phenyl-2-propanol in 2-methylpentane at 210 K is∼8 and for pure 1-phenyl-2-propanolεI is∼19.2, whereas scaling
yields a value of 9.6.17The measured value for the solution is
∼20% less than the scaled value, which indicates that in this case also there is a significant decrease in the H-bond induced orientation correlation on dilution.
In contrast,εis 5.51 for the 1:1 solution of isoamylbro-mide in 2-methylpentane and 13.06 (=12.84+0.22) for pure isoamylbromide at 110.1 K,28which gives the scaled value as 6.5. The measured value of 5.51 is∼18% less than the scaled value. Since there is no H-bonding in isoamylbromide, this must indicate the effect of decrease in the internal field, den-sity or other changes. Since both the change in the internal field effects and loss of intermolecular H-bonds on dilution tend to decrease εs, the agreement between the scaled and
measured values for ε1 for the 2:1 solution here indicates
that neither of the two changes have a significant effect on the origin of the Debye-type relaxation.
In summary, in its solution in isoamylbromide,
66.7 mol%n-propanol has shown two distinct relaxations,18
corresponding to each component in the form of nanoscale aggregates. The same feature was found for the 66.7 mol% solution of 5-methyl-2-hexanol with isoamylbromide.12 In both cases, the measuredεI of the solution is significantly
less than the scaled εI of the pure alcohol to the
concen-trations of the solutions. A recent study29 of solutions of n-butanol andn-butyl bromide has also shown two relaxation regions indicating clustering of the alcohol molecules or liquid–liquid phase separation, but in this studyεIhas been
found to scale with the molar concentration of n-butanol. This is seen to confirm that H-bond induced orientational correlation does not change whenn-butanol molecules aggre-gate to form clusters locally. Intercomparisons of the results for various solutions and the disagreement observed between the measured and scaled dielectric relaxation strengths show that despite the disruption of intermolecular H-bonding on addition of a second component, the two relaxations continue to persist and the predominant relaxation in these solutions is of Debye-type. Therefore, we argue that the values ofεI
andεII for pure 5-methyl- 2-hexanol and for its solutions
in 2-methylpentane correspond to the polarization of alcohol molecules in, most likely, nanometer-size clusters dispersed in the viscous liquids.
B. Relaxation spectra and the relaxation times
The data in TableIobtained from the shape of the plots in Figs.1and2show that dilution of the alcohol does not change the αI andβI parameters for process I, i.e., αI =1 and βI ∼ 0.95, within experimental and analytical errors. There is
also no doubt that∼95% of the polarization of pure 5-methyl-2-hexanol occurs by process I, which is Debye-type (single exponential) in the pure alcohol as well as of its solutions. Change inThas only a marginal effect on the values of these parameters for both the pure liquid and the solutions.
In Fig.7,τ1for the 2:1 solution is about an order of
mag-nitude less than that of pure alcohol at 205 K. The difference rapidly grows on cooling and there is a much greater, immea-surably high difference between their respectiveτ1 at 140 K
(pure 5-methyl-2-hexanol is vitrified atT near 149 K).12 τ
1
of the solution and of the pure alcohol approach each other as their respectiveτ1decrease toward the nanosecond range
on heating to 298 K. In contrast, for 5-methyl-2-hexanol in solution with a polar solvent, isoamylbromide, the difference between theτ1 of the solution and the pure alcohol was
sev-eral orders of magnitude, and their respectiveτ1did not show
an approach toward comparable values at high temperatures (See Fig. 3, Ref. 12). Evidently, consequences of clustering on the relaxation time in solution with a polar liquid are dis-tinguished from those in solution with a nonpolar liquid, even though the relaxation remains Debye-like in both types of solutions.
On the basis of the finding that Debye-type processes I and the usual process II persist in ultraviscous solutions of this study, we conclude that the H-bond induced nanometer scale-clustering of alcohol molecules has no effect on the mecha-nism of dipolar relaxation of processes I and II. In the dy-namic heterogeneity conjecture,7–9this would mean that
pres-ence of 2-methylpentane in the ultraviscous solution does not add to the dynamic heterogeneity of the dielectric relaxation of the alcohol molecules in it. Clearly, the findings of the di-lution effect here, together with the previous finding from so-lutions of alcohols in isoamylbromide, have consequences for our understanding of both, (i) the mechanism of the Debye relaxation and for the features of calorimetric relaxation, and (ii) the restricted Brownian diffusion of the H-bonded states of alcohol molecules in locally formed clusters.
Moreover, in terms of the variation ofτIandτIIwith
vari-ations in Tand dilution, it is evident that a decrease inT is equivalent to an increase in dilution. For example, increase in
τIon cooling the pure alcohol from 207.5 to 190.8 K would be
annulled by diluting the alcohol to 2:1 molar ratio at 190.8 K, while the Debye relaxation persists. Similar conditions may be deduced forεIandεII, but the data available here are
insufficient for doing so.
C. Debye relaxation and calorimetric relaxation
The inference that the most prominent dielectric polar-ization (amounting to 97% of the total polarpolar-ization in n -propanol) may not contribute to structural relaxation, was
based on an analysis of n-propanol data whose process
I seemed incompatible with its viscosity in terms of the Einstein–Debye equation, mechanical relaxation, and mainly the light scattering measurements.34 Similar light scattering
and other studies of another liquid with a similarly large De-bye relaxation have not yet been performed to support the inference for a “nonstructural relaxation” mechanism for the Debye process. But dielectric studies had been performed to
examine the merits of this inference by adding LiClO4 to
n-propanol35and to 5-methyl-2-hexanol,36and also by study-ing their respective mixtures in isoamylbromide.12,18 Addi-tion of LiClO4was expected to eliminate the “nonstructural”
mechanism of the Debye relaxation of process I, but it was not found to do so. A further study of the effect of steric hindrance17,37on H-bonding by using 1-phenyl and 2-phenyl
propanols, in which the phenyl group in the molecule hin-ders the formation of H-bonds, also showed that the Debye relaxation persists. Moreover, crystallization kinetics study of D-sorbitol38 supported the view that the Debye process is a
structural relaxation process. In view of these studies, it seems difficult to explain the Debye-like dielectric features of the modified H-bonded state of alcohols without considering that alcohol-molecules form clusters in the solution and relaxation occurs by H-bond breaking and reforming within the clusters. Dynamic and apparent specific heats,Cp*, andCp,app,of
5-methyl-2-hexanol measured during its cooling and heating through the liquid–glass range at the same slow rates of 2, 12, and 60 K/h,39have shown that, (i) the calorimetric relaxation time,τcal, estimated at the onset temperature of theCp,app
en-dotherm is inconsistent with that determined from dynamic Cp* measurements (Fig.3, Ref.39), and is also inconsistent
with the dielectric relaxation times of both processes I and II, and (ii) the distribution of relaxation time parameter varies slightly with the heating rate, which was attributed to enthalpy change from the temperature-dependent hydrogen-bond pop-ulation. Thus it seems that even for a pure alcohol, the Debye process may contribute to the enthalpy relaxation of its glassy state.
It is worth pointing out that there are materials whose Debye-type dielectric relaxation is known to contribute to the configurational entropy. The well-known example of such a case is the dielectric relaxation in hexagonal and cubic ices and in the high-pressure forms of ice. Here fluctuations of H-bonded structure in the crystal lattice of ice contribute to con-figurational thermodynamics40and the temperature derivative
of the entropy shows up as the specific heat, Cp. Details are
given in Ref.41.
D. Change in dielectric properties in molecular nanoaggregates
In Figs. 4–6,εI for the 2:1 solution atT< 190 K is
more than that expected on the basis of mixture rule, which indicates an increasedg, andεIIis also more than expected
and its value is comparable to that in the pure alcohol. This would be the case if change inghad the same effect on both. This view is supported by the data for the 0.67:1 solution, whose expected values for bothεI andεII are more than
the extrapolatedεI andεII to high temperatures. For the
properties of 0.25:1 solution shown in Fig.6,εIIcould not
be accurately estimated because of its small magnitude and proximity of the spectra to that of process I, but within this uncertainty, the extrapolated value ofεIIto 140 K is higher
than the estimated value, as is the case forεI in Fig.7(A).
This of course is weak evidence for a correlation betweenεI
andεII and further studies may be able to examine it.
044525-8 Poweret al. J. Chem. Phys.134, 044525 (2011)
much shorter in the clustered domains in solutions than in pure alcohols, and process II would contribute to structural relaxation only if a change in the dipole vector in this process were to change the configurational state without changing the energy of the state.
It is debated whether or not molecular motions of the
α-process are faster in nanoconfined liquids and in free-standing, nanofilms of polymers than in the bulk state. Some studies indicate that the glass transition temperature decreases on nanoconfinement,42–44and others found that the dielectric
relaxation time does not change.45 The decrease in the
re-laxation time observed here are for conditions different from those of liquids confined to cavities, and it is free from the surface tension and interfacial effects in a free standing poly-mer film. It is possible that the faster dynamics of dielectric fluctuations resulting from breaking and reforming of weak-ened H-bonds within the clusters in an ultraviscous solvent indicate nanodomains of a type different from those studied so far.
In a recent modeling of the dielectric relaxation time of binary mixtures of alcohols and polymers, cluster-association and dissociation model has been used to fit the relaxation time data46 by using the heat and volume of transformation
be-tween clusters and monomers. Some of these binary mixtures showed only one relaxation process and others showed two re-laxation processes of the individual components.46While this
configurational entropy based treatment is useful for liquids that in their pure state show only one relaxation process, it would be interesting to see if it is also useful when a liquid in solution shows two relaxation processes. It is also noteworthy that by using 1-octanol as model system for lipid molecules in biological membranes, MacCallum and Tieleman47have sug-gested a miceller aggregation with a polar core of up to 15 hydoxyl groups bonded together in mostly linear structures, and Fragiadakiset al.15have considered it as a model for in-termolecular association in 2-ethyl-1-hexanol. It is not clear how such a model may be applicable to solutions of an al-cohol with a hindered -OH group as in 5-methyl-2-hexanol dissolved in a hydrocarbon.
V. CONCLUSION
The Debye-like relaxation of 5-methyl-2-hexanol is not altered by the presence of 2-methylpentane despite the antic-ipated disruption of H-bonds and their weakening. This in-dicates that 5-methyl-2-hexanol molecules remain H-bonded in the solution in such a manner that exponential kinetics for decay of polarization remains dielectrically indistinguishable from that of the pure alcohol. This may be interpreted as a consequence of nanometer-size clustering in solutions of al-cohols or aggregates of folded H-bonded chains. Molecular motions of 5-methyl-2-hexanol in the 2:1 solution relative to that of the pure liquid becomes more faster at low tempera-tures than at high, differing by∼103at 160 K. The difference is reduced at higher temperatures. This would indicate that the H-bonded structure is more distorted in the nanometer size clusters than in the pure alcohol.
Electrical and elastic dipolar reorientations are more selective of reorienting vector than random configurational
fluctuations that include all orientations including ones in which the dipole or elastic vectors do not reorient. These fluc-tuations may not necessarily occur on the same time scale as dielectric relaxation. Therefore, comparative and correlative analyses of the calorimetric and mechanical relaxation data used for inferring the role of Debye relaxation may need to be re-examined. Our findings also bear upon our understanding of the relation between the shear modulus and the dielectric relaxation time of alcohol clusters in a solution.14
It is possible that both processes I and II contribute to structural fluctuations in proportion to the extent by which their respective underlying H-bond fluctuations produce a new configuration in the liquid’s structure, but it is not cer-tain how process I would be modified from a single relax-ation time to a calorimetrically observed, apparent distribu-tion of relaxadistribu-tion times. Dielectric and mechanical relaxadistribu-tion measurements of ultraviscous solutions of alcohols in nonpo-lar and pononpo-lar solvents would be revealing of the role of such clusters as well as the relation between their respective time scales. Mechanical relaxation studies of the type performed for alcohols14 but for ultraviscous 1 wt% solution of di-n
-butyl ether in 3-methylpentane,11 would also help to resolve
why, despite the presumed dynamic heterogeneity, its dielec-tric relaxation is of the Debye-type.
ACKNOWLEDGMENTS
We gratefully acknowledge support from the SFI Grant No. (02/In. I031).
1D. W. Davidson and R. H. Cole,J. Chem. Phys.19, 1484 (1951). 2W. Dannhauser,J. Chem. Phys.48, 1918 (1968).
3S. J. Bass, W. I. Nathan, R. M. Meighan, and R. H. Cole,J. Phys. Chem. 68, 509 (1964).
4R. G. Wassink and P. Bordewijk,Adv. Mol. Relax. Interact. Processes13, 299 (1978).
5E. Donth, The Glass Transition: Relaxation Dynamics in Liquids and
Disordered Materials(Springer-Verlag, Berlin, 2001).
6J. E. Anderson and R. Ullman,J. Chem. Phys.47, 2178 (1967).
7R. Böhmer, G. Hinze, G. Diezemann, B. Geil, and H. Sillescu,Europhys.
Lett.36, 55 (1996).
8H. Sillescu,J. Non-Cryst. Solids243, 81 (1999). 9R. Richert,J. Phys.: Condens. Matter14, R703 (2002). 10C. K. Majumdar,Solid State Commun.9, 1087 (1971). 11W. Huang and R. Richert,J. Chem. Phys.124, 164510 (2006). 12G. Power, J. K. Vij, and G. P. Johari,J. Chem. Phys.126, 034512 (2007). 13H. Huth, L.-M. Wang, C. Schick, and R. Richert,J. Chem. Phys. 126,
104503 (2007).
14B. Jacobsen, C. Maggi, T. Christensen, and J. C. Dyre,J. Chem. Phys.129, 184502 (2008).
15G. Fragiadakis, C. M. Roland, and R. Casalini,J. Chem. Phys.132, 144505 (2010).
16A. Reiser, G. Kasper, C. Gainaru, and R. Bohmer,J. Chem. Phys.132, 181101 (2010).
17O. E. Kalinovskaya, J. K. Vij, and G. P. Johari,J. Phys. Chem. A105, 5061 (2001).
18G. Power, J. K. Vij, and G. P. Johari,J. Chem. Phys.127, 094507 (2007). 19S. Havriliak, Jr. and S. Negami,Polymer8, 161 (1967).
20O. E. Kalinovskaya and J. K. Vij,J. Chem. Phys.112, 3262 (2000). 21H. Vogel, Phys. Z.22, 645 (1921).
22G. S. Fulcher,J. Am. Ceram. Soc.8, 339 (1923).
23G. Tammann and W. Z. Hesse,Z. Anorg. Allg. Chem.156, 245 (1926). 24L. Onsager,J. Am. Chem. Soc.58, 1486 (1936).
25J. G. Kirkwood,J. Chem. Phys.4, 592 (1936).
26H. Fröhlich, Theory of Dielectrics, 2nd ed. (Oxford University Press: Oxford, 1958).
27D. J. Denney,J. Chem. Phys.30, 1019 (1959).
28O. E. Kalinovskaya and J. K. Vij,J. Chem. Phys.111, 10979 (1999). 29T. E. Goresy and R. Böhmer,J. Chem. Phys.128, 154520 (2008). 30D. J. Denney and J. W. Ring,J. Chem. Phys.39, 1268 (1963).
31C. P. Smyth,Dielectric Behavior and Structure(McGraw Hill, New York, 1955).
32B. Singh and J. K. Vij,Bull. Chem. Soc. Jpn.49, 1824 (1976).
33S. Schwerdtfeger, F. Kohler, R. Pottel, and U. Kaatze,J. Chem. Phys.115, 4186 (2001).
34C. Hansen, F. Stickel, T. Berger, R. Richert, and E. W. Fischer,J. Chem.
Phys.107, 1086 (1997).
35G. Power, J. K. Vij, and G. P. Johari,J. Chem. Phys.116, 4192 (2002). 36G. Power, O. E. Panarina, and J. K. Vij,J. Phys. Condens. Matter.;19,
506208 (2007).
37G. P. Johari, O. E. Kalinovskaya, and J. K. Vij,J. Chem. Phys.114, 4634 (2001).
38G. Power and J. K. Vij,J. Chem. Phys.120, 5455 (2004).
39E. Tombari, C. Ferrari, G. Salvetti, and G. P. Johari,J. Chem. Phys.130, 124505 (2009).
40G. Adam and J. H. Gibbs,J. Chem. Phys.43, 139 (1965).
41In an ice structure, each H2O molecule is tetrahedrally H- bonded to four other H2O molecules with no angular distortion, and each H2O molecule has six orientations of equal probability. This produces (3/2)N
configura-tions per mole, whereNis the Avogadro number. [D. Eisenberg and W. Kauzmann,The Structure and Properties of Water(Clarendon, Oxford, 1969); J. B. Hasted, Aqueous Dielectrics(Chapman and Hall, London, 1973)]. When all configurations have the same energy, the molar config-urational entropy is equal toRln(3/2), whereRis the gas constant, and this entropy does not vary withT. Thus, an ideal ice lattice would have no con-figurational contribution to itsCp. But structural and other defects inherent
to ice cause the HO– –H (hydrogen) bonds to slightly differ in energy and hence some orientations of a H2O molecule become slightly more proba-ble than others. Consequently, a multiplicity of configurations of different energies would occur in an ice structure. An increase inTwould therefore cause its state point to explore higher energy configurations, and hence it
would have a configurationalCp. Adiabatic calorimetry measurements have
shown that there is a minute increase in theCpof ice at∼120 K when, on
heating, H2O molecules begin to reorient on an experiment’s time scale, as occurs for a glass on heating through itsCg. [O. Yamamuro, M. Oguni,
T. Matsuo, and H. Suga,J. Phys. Chem. Solids48, 935 (1987); J. Phys. Chem. Solids49, 425 (1988); G. P. Johari,Chem. Phys.258, 277 (2000)]. Also, these energetic differences are greater in the H-bonded structure of the ice clathrates, which show a larger change inCpon kinetic freezing
of its structure, based on the findings in the three preceding references, on which the following discussion is based. TheCp- increase occurs atTclose
toTat whichτdielis comparable to the measurement time in an adiabatic calorimetry experiment. Also, as for glasses, theCp- increase is greater
when the ice and ice clathrate samples have been annealed at a low tem-perature. Therefore, one anticipates that the H-bonded configurations in the structure of liquid alcohols would differ in energy by a much larger amount than the configurations in the ice and clathrate structures, and therefore such H-bonded liquids are anticipated to show a much largeCp,app-increase
on kinetic unfreezing partly due to a decrease in the hydrogen-bond popu-lation on heating and partly due to the increase in the number of accessible configurations. When two relaxation processes are observed in the liquid state with different relaxation times, as for several pure monohydroxy al-cohols and poly (propylene glycols), it is also difficult to envisage which relaxation time is controlled by the variation of the configurational entropy withT. In a solution, there is an added contribution to the entropy from the configurations of the solvent molecules and there is entropy of mixing. 42G. B. McKenna,J. Phys. IV France10, Pr7-53 (2000).
43S. H. Anastasiadis, K. Karatasos, G. Vlachos, E. Mainias, and E. P. Giannelis,Phys. Rev. Lett.84, 915 (2000).
44L. Hartmann, K. Fukao, and F. Kremer, “Molecular Dynamics in Thin Poly-mer Films,”Broadband Dielectric Spectroscopy, edited by F. Kremer and A. Schönhals Springer, New York, 2003), Chap. XI, pp. 433–473. 45A. Serghei, H. Huth, C. Schick, and F. Kremer,Macromolecules41, 3636
(2008).