See also: I/Affinity Separation. II/Affinity Separation: Affinity Membranes; Affinity Partitioning in Aqueous Two-Phase Systems; Aqueous Two-Phase Systems; Biochemical Engineering Aspects; Covalent graphy; Dye Ligands; Hydrophobic Interaction Chromato-graphy; Immobilized Boronates and Lectins; Immobilized Metal Ion Chromatography; Immunoaffinity Chromatogra-phy; Imprint Polymers; Rational Design, Synthesis and Evaluation: Affinity Ligands. Appendix 1/Essential
Guides for Isolation/Purification of Enzymes and Proteins. Essential Guides for Isolation/ Purification of Immunoglobulins. Appendix 2/Essential Guides to Method Development in Affinity Chromatograhy.
Further Reading
Coligan J, Dunn B, Ploegh Het al. (eds) (1995)Current Protocols in Protein Science. New York: John Wiley.
Harris ELV and Angal S (eds) (1990) Protein PuriT ca-tion Applicaca-tions;A Practical Approach. Oxford: IRL Press.
Hermanson GT, Mallia AK and Smith PK (1992) Immobi-lized AfTnity Ligand Techniques. New York: Aca-demic Press.
Kenny A and Fowell S (eds) (1992) Practical Protein Chromatography. New Jersey: Humana Press.
Matejtschuk P (ed.) (1997) AfTnity Separations: A Practical Approach. Oxford: IRL Press.
Ostrove S (1990) AfRnity Chromatography. Methods in Enzymology182: 357}379.
Scopes RK (1993)Protein PuriTcation,Principles and Prac-tice, 3rd edn. New York: Springer-Verlag.
Scopes RK (1997) Protein puriRcation in the nineties. Biotechnology and Applied Biochemistry23: 197}204. Turkova J (1993) BioafTnity Chromatography. Journal of Chromatography Library, vol. 55. Amsterdam: Elsevier.
CENTRIFUGATION
Analytical Ultracentrifugation
J. L. Cole, Merck Research Laboratories, West Point,
PA, USA
Copyright^ 2000 Academic Press
Analytical ultracentrifugation (AUC) involves the measurement of the radial concentration gradients of molecules created by the application of centrifugal force. In contrast to preparative centrifugation, which is used to fractionate mixtures, AUC is a purely ana-lytical technique. Since the pioneering work of Sved-berg and associates in the 1920s, AUC has been employed to characterize the mass, size, shape and association properties of macromolecules in solution. The technique has been broadly applied to research problems in biochemistry, molecular biology and polymer sciences and has also found practical ap-plications in the pharmaceutical and biotechnology industries. Some of the most attractive features of AUC are:
1. Versatility: a wide variety of samples can be examined by AUC, including molecules ranging in size from sucrose to virus particles.
2. Rigor: AUC experiments are directly inter-preted in the context of thermodynamic and hy-drodynamic theory, so it is not necessary to run standards to calibrate each experiment.
Also, because the experiments are performed in free solution there are no complications due to interactions with matrices or surfaces that can complicate interpretation of other types of measurements.
3. Convenience: recently, new instrumentation (Beckman Coulter XL-A and XL-I) and data analy-sis methods have made AUC much more conve-nient and accessible to the general biochemistry and polymer science communities. In contrast to earlier instruments, experiments are easy to set up and centrifugation parameters and data acquisition are all under computer control. In ad-dition, powerful desktop computers and new soft-ware have greatly accelerated the data analysis process and have also extended the capabilities of AUC.
A complete treatment of the theory and applica-tions of AUC is beyond the scope of this article, and the interested reader is referred to the Further Read-ing section.
Theoretical Background
Figure 1 Sedimentation velocity of HIV-1 integrase catalytic core domain. Protein concentration 5.4 mg mL\1in 20 mmol L\1
Tris, pH 7.5, 500 mmol L\1NaCl, 1 mmol L\1EDTA, 5 mmol L\1
DTT. Data obtained at 43C at a rotor speed of 50 000 rpm. Radial absorption scans are recorded at 250 nm at 5 min intervals. The rate of movement of the boundary is determined by the sedi-mentation coefficient,s, and the spreading of the boundary re-flects the diffusion constant,D.
characterize sample homogeneity and quantitatively to deRne mass and shape parameters of the molecular species present in a sample. The experiments are based on simple physical principles. Application of a strong centrifugal Reld (high rotational velocity) leads to the net movement of solute molecules away from the air}solvent interface (the meniscus) and to-wards the bottom of the cell, giving rise to a moving boundary (Figure 1). Radial scans are recorded at regular time intervals, and the data are analysed to determine both the rate of movement and broadening of the boundary as a function of time. For a homo-geneous sample, a single boundary forms; for mix-tures, either a single or multiple boundaries may be resolved. In quantitative terms, the rate of sedimenta-tion of a macromolecule,v"dr/dt, is proportional to the force2r, whereris the radial distance from the
centre of rotation,tis time,is the rotational velo-city. The ratio v/2ris deRned as the sedimentation
coefRcient, s. The sedimentation coefRcient has the units of time, and is expressed in Svedberg (S) units (1 S"10\13s). The sedimentation coefRcient may
depend on concentration so it is customary to ex-trapolate s to zero concentration, to give s0.
In addition, to allow comparison of sedimentation coefRcients obtained in different solvents and at different temperatures, s0 is usually corrected to
standard conditions (pure water at 203C) using the following equation:
s0
20,w"s0
(1!vN)20,w
(1!vN)T,b
T,b
20,w
[1]
wherevN is the partial speciRc volume of the solute,is the density of the solvent andis the viscosity of the solvent. The subscript 20,w refers to properties mea-sured at 203C in water, and subscript T,b refers to properties measured at temperature T in a buffer solutionb.
The sedimentation coefRcient is related to molecu-lar properties according to the following equation:
s"M(1!vN) N0f
[2]
where M is the molecular mass, f is the frictional coefRcient (which is related to macromolecular shape and size), andN0is Avogadro’s number. The
solvent parameters and are experimentally measurable or can be calculated from the solvent composition using tabulated data. For proteins,vN can be calculated with reasonable accuracy from the amino acid composition. Any further interpretation of the sedimentation coefRcient requires an inde-pendent way to measure eitherMor f. Fortunately, the frictional coefRcient is available from the sedimentation velocity data itself. During a veloity run the boundary not only moves towards the cell bottom but also becomes broader due to diffu-sion. Thus, in addition to measurement of the sedi-mentation coefRcient, s, sedimentation velocity data can also be analysed to obtain the diffusion constant,D. According to the Einstein relationship, the diffusion constant is inversely proportional to the frictional coefRcient:
D"kT
f [3]
where k is the Boltzmann constant and T is the absolute temperature. Combining eqns [3] and [4] one obtains the Svedberg equation:
s D"
M(1!vN)
RT [4]
where Ris the gas constant. Thus, measurement of boths and D for a homogeneous sample in a sedi-mentation velocity experiment provides an indepen-dent method of obtaining the molecular mass. Given the mass, the frictional coefRcient contains in-formation about the shape and hydration of the mol-ecule. Traditionally, frictional properties have been interpreted by modelling a macromolecule as a hy-drated ellipsoid. However, more detailed, structure-based hydrodynamic calculations of frictional properties can now be readily performed using bead models.
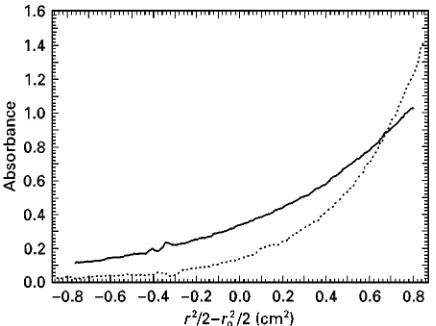
Figure 2 Sedimentation equilibrium of a 13 base pair DNA sequence. Continuous line, single-stranded; dotted line, double-stranded. 10 mmol L\1 Tris, pH 7.5, 50 mmol L\1 NaCl,
15 mmol L\1KCl, 0.1 mmol L\1EDTA, 2 mmol L\1Spermidine.
Data obtained at 43C at a rotor speed of 40 000 rpm. Radial absorption scans recorded at 260 nm. The molecular mass of the duplex DNA is twice that of the single-stranded form.
sensitive to the mass but not the size or shape of a macromolecule. Equilibrium sedimentation is a rig-orous and very accurate method of determining the molecule mass and association state of macro-molecules. It is also one of the best methods of deR n-ing reversible interactions of macromolecules in solu-tion. Sedimentation equilibrium is performed at lower rotor speeds than sedimentation velocity ex-periments. When the centrifugal force is sufR -ciently small, the process of diffusion signiR -cantly opposes the process of sedimentation and a stable, smooth, equilibrium concentration distribu-tion of macromolecules will eventually be obtained throughout the cell (Figure 2). For an ideal, homo-geneous macromolecule, the radial equilibrium distribution is a simple exponential function of the buoyant mass of the macromolecule,M(1!vN):
c(r)"c0exp[M(1!vN)2(r2!r20)/2RT] [5]
where c(r) is the sample concentration at radial positionr and c0 is the sample concentration at an
arbitrary reference radial distancer0. Deviations from
the simple exponential behaviour described by eqn [5] can result from the presence in the sample of either multiple noninteracting or interacting macro-melecular species, or thermodynamic nonideality. For heterogeneous, polymeric systems, various molecular weight averages (Mn, Mw and Mz) are obtained by
appropriate transformations of the data and are used to assess polydispersity and self-association behav-iour. In the context of protein biochemistry, the data are usually analysed in terms of discrete oligomeric species, and equilibrium AUC is an excellent method
to determine the native association state of proteins. In the case where discrete oligomeric species are in reversible equilibrium, the stoichiometries (N), equi-librium constants (Keq) and even the thermodynamic
parameters (H,S) that deRne the interactions can be obtained using appropriate data analysis methods.
Instrumentation and Experimental
Considerations
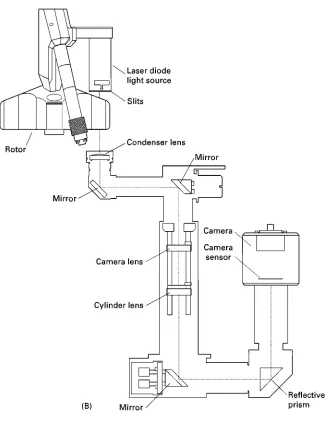
In addition to the drive system common to all ultra-centrifuges, the analytical ultracentrifuge contains optical detection systems capable of directly measur-ing the sample concentration inside the centrifuge cell as a function of radial distance during sedimentation (Figure 3). The data can be viewed, or even analysed, in real time as the experiment progresses. The Beckman Coulter XL-A uses an absorbance optical system based on a xenonSashlamp and a scanning monochromator that allows measurement of sample concentration at wavelengths ranging from 200 to 800 nm (Figure 3A). More recently, Rayleigh inter-ference optics were added, creating an analytical ultracentrifuge, the XL-I, that can simultaneously re-cord data using both optical systems (Figure 3B). The Rayleigh interference optical system measures sample concentration based on refractive index changes. Each optical system has certain advantages and disad-vantages. Absorption optics are particularly sensitive for detection of macromolecules containing a strong chromophore. Also, for samples containing two or more components with different absorption spectra (i.e. protein and nucleic acids), data can be obtained at multiple wavelengths during the same experiment to selectively monitor each chromophore. The Rayleigh interference optical system is used to analyse macromolecules lacking convenient chromo-phores (e.g. polysaccharides), as well as samples that contain strongly absorbing buffer components. It is also the optical system of choice for characterizing very concentrated samples. The data from each cell are acquired simultaneously on a CCD camera by the interference optical system, and the resulting rapid collection of large amounts of data is especially useful for certain types of sedimentation velocity experi-ments (see below). Interference optics are also useful for sedimentation equilibrium experiments that re-quire a higher radial resolution than is provided by the absorbance optical system.
Figure 3 Optical systems in the Beckman XL-I analytical ultracentrifuge. (A) Absorption system. Light from a xenon flash lamp passes through a grating monochromator and is directed on to a sample/reference cell assembly. The transmitted light passes through a movable slit assembly and is detected with a photomultiplier tube. (B) Interference system. 675 nm light from a laser passes through a pair of slits and on to the sample and reference sectors. A series of lenses and mirrors combine the image of the sample and reference sectors to produce a fringe pattern which is imaged on a CCD camera. Refractive index changes result in vertical displacement of the fringe pattern.
0.3 cm. Sample requirements are fairly modest and preparation is straightforward. It is a nondestructive technique, so the sample can be recovered following the experiment. For sedimentation velocity experi-ments a two-channel centrepiece is typically used (Figure 4A) and sample volumes of &420L are required. For sedimentation equilibrium experiments, the time to achieve equilibrium is inversely propor-tional to the square of the height of the sample col-umn, and it is advantageous to use shorter columns. A commonly used centrepiece for this experiment contains three pairs of sample and reference channels requiring about 110L to produce a 3 mm column
(Figure 4B). The sample concentrations used depend on the nature of the macromolecule that is being examined, the sensitivity of the optical system and the analysis method. For charged macromolecules, the ionic strength should be at least 50 mmol L\1 to
Figure 3 Continued
Data Analysis Methods
In order to extract the rich information that is avail-able from AUC experiments it is necessary to use the appropriate data analysis methods. In recent years, new approaches have been developed for the analysis of both sedimentation velocity and equilibrium data. Many of these methods are implemented in software that can be downloaded over the Internet or in com-mercially available packages. Although much of the analysis software is deceptively simple to use, the
Rtting algorithms are often complicated. In order to obtain physically meaningful parameters from analy-sis of AUC data it is important for the user to have a good understanding of the underlying principles along with an appreciation of the limitations in the
Rtting procedures.
Sedimentation Velocity
In the case of a simple, homogeneous macromolecule, analysis of sedimentation velocity data provides s, the sedimentation coefRcient, and D, the diffusion constant. Under favourable conditions, it is possible to extract s and D for mixtures of non-interacting macromolecular species, provided that boundaries for each species can be resolved or deconvoluted. The situation is more complicated for reversibly associating mixtures, since it is generally not possible to assign individual boundaries to dis-crete species.
Figure 4 Sedimentation velocity and equilibrium cell designs. (A) Two-sector velocity cell. Sample is loaded into the upper sector and reference solution (buffer) is loaded into the bottom sector. The sample is centrifuged at high rotational velocity, generating a boundary that moves towards the bottom of the cell. (B) Six-channel equilibrium cell. Three sample reference pairs are loaded into the cell, which is centrifuged at moderate rotational velocity, resulting in equilibrium concentration gradients in each sample channel.
an apparent average sedimentation coefRcient. This approach does not provide information about the homogeneity of the sample or the diffusion constant. Consequently, a number of analysis methods have been developed that involve analysis of the entire boundary region. In 1978, van Holde and Weischet described a transformation procedure for removing the effect of diffusion from the bound-ary. It is particularly useful to determine homogeneity and to detect nonideal behaviour. More recently, Stafford described a time-derivative method for analysis of velocity data in which the time-invariant noise is removed by a subtraction procedure, result-ing in a great increase in the signal-to-noise ratio. This approach is particularly useful in the analysis of data obtained with the interference optics, making it feasible to work at very low protein concentrations (e.g. 10}100g mL\1). Finally, there are methods for
analysis of velocity experiments that involve directly
Rtting the scan data using either approximate or nu-merical solutions to the Lamm equation to determine both s and D. The Lamm equation is the partial differential equation that describes transport of solute(s) in the sector-shaped cells used in sedimenta-tion velocity experiments. This approach can be used to Rt data using single or multiple species models. Recently, Schuck has described a Rtting algorithm which removes the radially-invariant and time-invari-ant noise contribution from the data, which makes
this method particularly useful for data obtained with the interference optics.
Sedimentation Equilibrium
As in the case of sedimentation velocity, methods for analysis of sedimentation equilibrium data can be divided into model-independent and model-depen-dent approaches. Model-indepenmodel-depen-dent methods are most useful to survey sample properties qualitatively, or for analysis of complex samples, i.e. polymeric mixtures, that cannot easily be described in a model-dependent analysis. In contrast, model-model-dependent analysis involves direct Rtting of the sedimentation equilibrium concentration gradients to relevant phys-ical models (e.g. single ideal species, noninteracting mixtures or a reversible association). This method provides the best-Rt values and the associated statist-ical uncertainties in the Rtting parameters (e.g. molecular mass, oligomer stoichiometry and associ-ation constants) and a statistical basis to discriminate among alternative physical models.
The simplest model-independent approach to ob-tain the molecular mass,M, is to plot lncversusr2.
According to eqn [5], the slope of this line is equal to M(1!vN)2/2RT. Although linearity of this plot has
gradient is shallow. Additionally, d(lnc)/dr2 can be
calculated on a point-by-point basis to create a plot of the apparent weight-average molecular weight (Mw,app) versus concentration. For a homogeneous
sample,Mw,appwill be constant as a function of
con-centration. An increase inMw,appwith concentration
indicates mass action-driven association. In this case, it is useful to overlay on the same plot data obtained from several samples over a range of loading concen-trations and/or rotor speeds. For a reversibly self-associating system, all of the data will lie on a smooth curve, whereas for a noninteracting or slowly equilib-rating system, the data will give rise to a family of nonsuperimposable curves. Other molecular weight averages (Mn, Mz) can also be obtained and can be
useful in the analysis of associating systems or poly-meric mixtures.
In model-dependent methods, a single experiment concentration gradient, or preferably, multiple con-centration gradients, are Rt to a physically relevant model using a nonlinear least-squares algorithm. In the simplest case of a single ideal species, data areRt to eqn [5]. For samples where there are more than one species in solution, or if thermodynamic nonideality is appreciable, it is necessary to Rt the data to functions containing additional terms to in-corporate sample heterogeneity, equilibrium associ-ation reactions or virial coefRcients. Often it is difRcult to distinguish between several models thatRt the data equally well. In these cases, it is often useful to employ global methods in which multiple data sets that are collected over a wide range of sample loading concentrations and rotor speeds are simultaneously Rt to a speciRc model. This global
Rtting approach helps to ensure that a unique solution is obtained and greatly reduces the statistical uncer-tainty in the parameters. Global nonlinear least-squaresRtting of sedimentation equilibrium data was originally implemented in the NONLIN algorithm, and now several programs are available. In addition, equilibrium data are often Rt using models pro-grammed by the user within a general-purpose data analysis package.
Conclusions
AUC is a robust and widely accepted analytical method to characterize the molecular mass, size, shape and association of molecules in solution. It has been used extensively by biochemists and molecular biologists to deRne properties of biological macro-molecules and has also found applications within the polymer science community. Experiments are per-formed using specialized centrifuge cells in an ana-lytical ultracentrifuge capable of measuring radial
concentration gradients using absorption or refrac-tometric optics. In sedimentation velocity experi-ments a moving boundary forms upon application of a high centrifugal force. The rate of movement of the boundary is determined by the sedimentation
coef-Rcient and the broadening of the boundary with time occurs because of diffusion. The sedimentation coefRcient is a function of a molecule’s mass and frictional properties whereas the diffusion con-stant in only determined by the frictional properties. Sedimentation equilibrium measurements are per-formed at lower rotation velocities where the sedi-mentation force is balanced by diffusion. The shape of the concentration gradient is determined by the molecular weight of the species present in the sample. A variety of computer data analysis methods have been developed for both sedimentation velocity and equilibrium data.
Further Reading
Cantor CR and Schimmel PR (1980)Biophysical Chem-istry. San Francisco: WH Freeman.
Cole JL and Hansen JC (1999) Analytical ultracentrifuga-tion as a contemporary biomolecular research tool. Journal of Biomolecular Techniques10: 163}176. Fujita H (1975)Foundations of Ultracentrifugal Analysis.
New York: Wiley.
Harding SE, Rowe AJ and Horton JC (eds) (1992) Analytical Ultracentrifugation in Biochemistry and Polymer Science. Cambridge, UK: Royal Society of Chemistry.
Laue TM (1996) Choosing which optical system of the optima XL-I analytical centrifuge to use. Beckman Coulter Application Information, number A-1821-A.
Laue TM and Stafford WF (1999) Modern applica-tions of analytical ultracentrifugation. Annual Review of Biophysics and Biomolecular Structure 28: 75}100.
McRorie DK and Voelker PJ (1993)Self-associating Sys-tems in the Analytical Ultracentrifuge. Fullerton, CA: Beckman Instruments.
Ralston G (1993)Introduction to Analytical Ultracentrifu-gation. Fullerton, CA: Beckman Instruments.
Schachman HK (1959)Ultracentrifugation in Biochemis-try. New York: Academic Press.
Schuster TM and Laue TM (eds) (1994)Modern Analytical Ultracentrifugation. Boston: Birkhauser.
Tanford C (1961)Physical Chemistry of Macromolecules. New York: John Wiley.
van Holde KE (1975) Sedimentation analysis of proteins. In: Neurath H and Hill RH (eds)The Proteins, vol. I, pp. 225}291. New York: Academic Press.