LEABHARLANN CHOLAISTE NA TRIONOIDE, BAILE ATHA CLIATH
TRINITY COLLEGE LIBRARY DUBLIN
OUscoil Atha Cliath
The University of Dublin
Terms and Conditions of Use of Digitised Theses from Trinity College Library Dublin
Copyright statement
All material supplied by Trinity College Library is protected by copyright (under the Copyright and
Related Rights Act, 2000 as amended) and other relevant Intellectual Property Rights. By accessing
and using a Digitised Thesis from Trinity College Library you acknowledge that all Intellectual Property
Rights in any Works supplied are the sole and exclusive property of the copyright and/or other I PR
holder. Specific copyright holders may not be explicitly identified. Use of materials from other sources
within a thesis should not be construed as a claim over them.
A non-exclusive, non-transferable licence is hereby granted to those using or reproducing, in whole or in
part, the material for valid purposes, providing the copyright owners are acknowledged using the normal
conventions. Where specific permission to use material is required, this is identified and such
permission must be sought from the copyright holder or agency cited.
Liability statement
By using a Digitised Thesis, I accept that Trinity College Dublin bears no legal responsibility for the
accuracy, legality or comprehensiveness of materials contained within the thesis, and that Trinity
College Dublin accepts no liability for indirect, consequential, or incidental, damages or losses arising
from use of the thesis for whatever reason. Information located in a thesis may be subject to specific
use constraints, details of which may not be explicitly described. It is the responsibility of potential and
actual users to be aware of such constraints and to abide by them. By making use of material from a
digitised thesis, you accept these copyright and disclaimer provisions. Where it is brought to the
attention of Trinity College Library that there may be a breach of copyright or other restraint, it is the
policy to withdraw or take down access to a thesis while the issue is being resolved.
Access Agreement
By using a Digitised Thesis from Trinity College Library you are bound by the following Terms &
Conditions. Please read them carefully.
Developing a National Reference
Range for Paediatric Bone Density
Doctor in Medicine
2014
I declare that this work
a) has not been submitted as an exercise for a degree at this or any other
University,
b) is entirely my own work,
c) may be lent or copied by the Library upon request.
Aisling Laura Dobbyn Snow
TRINITY COLLEGE
SUMMARY
This study aimed to acquire normative dual energy x-ray absorptiom etry (DXA]
bone density data for Irish Caucasian children. A total of 162 healthy Irish
Caucasian children
(84 male, 78 female) aged betw een six and
16 years
underw ent anthropom etric m easurem ents and a single DXA examination as part
of the study.
101
participants
(47 male, 54 female] returned diet and lifestyle
questionnaires and 48
participants
(21 male,
27 female] performed self-
assessm ent of pubertal stage. In order to take account of bone size, areal bone
mineral density (aBMD] results were converted to a volumetric estimate,
corrected BMD (BMDcorr] using the Kroger m ethod of BMDcorr = BMC/Volume =
aBMD x
[4/ ( i t
x
Width]]. Participants were grouped by sex and age and the Cole
and Green (LMS] method was used to analyse aBMD and
B M D c o r rresults by
median M(AgeO, coefficient of variation S(Agei] and the Box-Cox pow er L(AgeO.
Height and weight w ere analysed by age and compared to the Irish reference
data. Body mass index (BMI] was also calculated, as weight (kg] divided by
height^ (m2]. Separate comparisons of aBMD and BMDcorr by Tanner stage were
performed for male and female participants using a paired Student’s t-test.
Dietary factors w ere analysed by sex and duration of daily exercise was analysed
by age range for males and for females and compared to aBMD and to BMDcorr
using a paired Student’s t-test.
LMS coefficients are presented in individual tables for males and females and can
be used to calculate the aBMD or
B M D c o r rZ-score for an individual child using the
given for m ales an d for females. P ubertal stage, d ie t and lifestyle data are
p r e s e n te d in ta b u la te d an d c h a rt form.
As expected, aBMD, BMDcorr an d h eig h t all increase w ith age in both m ales and
females. Overall, th e female p a rtic ip a n ts in th e stu d y a r e significantly taller th an
th e Irish re fe re n c e sta n d a r d ; male p a rtic ip a n ts also te n d to be taller th a n the
re fe re n c e s ta n d a r d b u t n ot to a significant level. Analysis of b o n e d en sity in th o se
w h o exercise m o re th a n an d less th an one h o u r p e r day reveals a significant
inverse re la tio n sh ip b e tw e e n h ig h er levels of exercise an d both aBMD and
BMDcorr in females aged b e tw e e n 11 an d 16 years. It is also ev id e n t that, a fte r the
age of 12 years, th e female s tu d y p a rtic ip a n ts b ec a m e less involved in exercise
w h e r e a s m ales co n tin u ed to m aintain th e ir levels of activity.
ACKNOWLEDGEMENTS
P rofe ssor Edna Roche has g e n e ro u sly p ro v id e d m e with th e s u p p o r t and ex p e rt
insight n e c e ssa ry to en a b le m e to bring s tr u c tu r e an d p u rp o s e to this research.
P rofe ssor Myra O’Regan has p ro v id e d invaluable guidance an d e x p e rtise in the
form ation of a solid statistical m eth o d o lo g y for d ata analysis.
I w a s lucky enough to begin my radiology tra in in g in th e Adelaide and Meath
Hospital in co rp o ratin g th e National C hildren’s Hospital w h e r e P ro fe sso r William
Torreggiani ta u g h t m e th e g re a t im p o rta n c e of dedication to continuing
education and re searc h. Dr Samuel Hamilton w a s also on h an d to p rovide
en c o u rag e m e n t, heavy doses of reality and th o ro u g h tu to rin g in p r o p e r
g ra m m a r. Dr Martin Ryan and Dr Eric Colhoun both en c o u ra g e d my i n te re st in
th e s ubspec ia lty of p a e d ia tric radiology, for w hich 1 am very grateful.
Ms Inez Byrne, Ms Anne Stafford, Ms Liz Shields and Ms Darina O’Sullivan
expertly p e r fo rm e d th e DXA scans for th e study. Ms B e rn a d e tte Rowley provided
d edicated an d v ery m uch a p p r e c ia te d a d m in istra tiv e s u p p o r t th ro u g h o u t. Ms
Elaine O’Mullane, re s e a rc h n u rs e in t h e D e p a rtm e n t of Paediatrics in Trinity
College Dublin, w a s alw ays available to assist w ith practical details. Dr Alison
Hurley w a s alw ays r e a d y to advise an d help w ith practical planning. Ms Alison
Clapp assisted im m e a su ra b ly by lending h e r lite ra tu re sea rch expertise.
DEDICATION
To my p a re n ts, Joan Dobbyn an d David Snow, to w h o m I ow e endless
a p p reciatio n for so m a n y things including exceptional e n c o u ra g e m e n t ov er my
m a n y y ea rs of study.
To my s iste r Fiona, w h o is alw ays available w ith help and e n c o u ra g e m e n t and
in sp ires m e w ith h e r am az ing creativity, c o m m itm e n t to family and dedication to
h a r d work.
TABLE OF CONTENTS
DECLARATION OF ORIGINAL AUTH ORSH IP...2
SUMMARY... 3
ACKNOWLEDGEMENTS... 5
DEDICATION... 6
TABLE OF CONTENTS... 7
LIST OF TABLES... 1 0
LIST OF FIGURES... 11
CHAPTER 1 - INTRODUCTION...12
1.1 Bone H e a lth ...13
1.2 P aediatric DXA... 14
1.3 DXA and Bone S iz e ...15
1.3A Correction of BMD Results fo r Bone Size...17
1.4 DXA Cross C alibration... 18
1.5 Influences on Bone S tru c tu re and H e a l th ... 19
l.S.i Ethnicity...
19
1.5.a Nutrition...19
l.S.iii Body Composition, Birth W eight...21
l.S.iv Exercise...
23
1.5.V Exposure to Cigarette Sm oke...
25
1.6 DXA Reference R a n g e s ...25
CHAPTER 2 - METHODOLOGY...2 8
2.1 P a rtic ip a n ts ...28
2.2 C onsent, A uxiology...29
2.3 P u b ertal A s s e s s m e n t...30
2.4 Diet an d Lifestyle Q u e stio n n a ire ... 30
2.5 Bone M ineral D ensity A s s e s s m e n t... 31
2.6 BMD C orrection for Bone S ize...32
2.7 Statistical A nalysis of Bone D en sity ...32
CHAPTER 3 - RESULTS...3 4
3.1 S tudy P o p u la tio n ... 34
3.2 Bone D e n sito m e try ...35
3.3 B irth W eight, Height, W eight, BM I... 40
3.4 P u b ertal S ta g e ...43
3.5 D iet...44
3.6 E x ercise... 46
3.7 S ed en tary P a stim e s...49
3.8 C igarette Sm oke E x p o su re ... 51
CHAPTER 4 - DISCUSSION...52
4.1 F indings in o u r Study C o h o rt...53
4.1.i N u tritio n
...
53
4.1.H Body C om position...53
4.1.iii Pubertal S ta g e...
54
4.1.iv E xercise...55
4.1.V Cigarette Sm oke E xp o su re...56
4.2 DXA A nalysis...57
4.3 DXA Bone Density Reference R anges...59
4.4 Conclusion... 59
APPENDICES...6 1
Appendix 1. P a r e n t/G u a r d ia n Inform ation S h e e t...61
Appendix 2. P ubertal Self A sse ssm e n t F o r m s ... 65
Appendix 3. Diet an d Lifestyle Q u e s tio n n a ir e ... 67
A ppendix 4. Bone Density R e s u lts ...68
A ppendix 5. Height, Weigh and Body Mass Index R e s u l t s ...70
A ppendix 6. P ubertal Stage R esu lts...73
A ppendix 7. Dietary F a c t o r s ... 75
LIST OF TABLES
T a b le 1.
Study participants by age and se x ... 35
T a b le 2,
LMS data for aBMD in m ale s...37
T a b le 3.
LMS data for BMDcorr in m ales... 38
T a b le 4.
LMS data for aBMD in fem ales... 38
T ab le 5.
LMS data for BMDcorr in fem ales... 39
T ab le 6.
aBMD by T anner stage in m ales... 44
T a b le 7.
BMDcorr by Tanner stage in m a le s ...44
T a b le 8.
Mean aBMD and breastfeeding in males and fem ales
45
T a b le 9.
Mean BMDcorr and breastfeeding in males and fem ales
45
T ab le 10. aBMD and exercise in m a le s... 47
T a b le 11. BMDcorr and exercise in m ale s...47
T a b le 12. aBMD and exercise in fem ales...47
T a b le 13. BMDcorr and exercise in females ... 48
T a b le 14. Bone density results by age in m ales...68
T ab le 15. Bone density results by age in fem ales... 69
T a b le 16. Height and w eight by age in m a le s ... 70
T ab le 17. Height and w eight by age in fem ales... 71
T a b le 18. Mean body m ass index by age in m a le s... 72
T a b le 19. Mean body m ass index by age in fem ales...72
T a b le 20. Self-assessed pubertal stage in m ales...73
T a b le 21. Self-assessed pubertal stage in fem ales... 74
.36
.37
.39
.40
.41
.42
.42
.43
.46
.48
,49
.50
.50
.51
LIST OF FIGURES
Age by aBMD by g e n d e r ...
Age by BMD
c o r rby g e n d e r ...
aBMD percentiles for m a l e s ...
aBMD percentiles for f e m a le s ...
aBMD by birth w e ig h t by g e n d e r ...
CHAPTER 1
INTRODUCTION
1.1 B one health
Bone health is a com plex concept t h a t has m a n y in te rw o v e n influencing factors.
The s tre n g th of a b o n e is d e te r m in e d n o t only by th e a r c h ite c tu re of its physical
s tr u c tu r e b u t also by th e d ensity of th e s t r u c t u r e itself(l). In childhood th e
im m a tu r e b u t grow ing skeleto n is in a s ta te of flux w h e r e b o n e s h a p e an d
com position a re c o n sta n tly developing u n d e r a m ultifactorial influence(2). Many
of th e key d e te r m in a n ts of b o n e d e v e lo p m e n t re la te to ethnicity an d o th e r
in h e rite d variables b u t n u m e r o u s e n v iro n m e n ta l factors also play an im p o r ta n t
role. T hese include diet, exercise, vitam in D levels, p u b e rta l stage, w eight, body
com position and p re s e n c e o r a b se n ce of negative im pacts such as chronic ill
health, b one disease, d e trim e n ta l m edica tions an d h o r m o n e im b alan ce (3 ). The
influence of modifiable en v iro n m e n ta l factors is of p a rtic u la r im p o rta n c e in
childhood an d adolescence, d u ring w hich tim e it is possible to significantly
im p a c t b o n e d e v e lo p m e n t and, su b seque ntly, influence bone h e a lth in
a d u lth o o d (4 ].
a c cu ra te analytic t e c h n iq u e s a n d a r e co n sid e re d to be th e gold sta n d a r d in
evaluation of b o n e s tr u c tu r e a n d m ass h o w e v e r th e y re q u ire, a t m inim um , a
substan tial b one biopsy an d a r e clinically im practical, especially in th e p ae diatric
p o p ulation[6, 7]. The m o s t clinically re le v a n t op tio n s for analysis of b one density
are dual energy x-ray a b s o r p tio m e tr y [DXA), q u a n tita tiv e c o m p u te d to m o g ra p h y
[QCT), p e r ip h e ra l QCT (pQCT] and, to a le sse r degree, q u a n tita tiv e u ltra so u n d
(QUS)(1, 5, 8],
The s tru c tu re and m a ss of b o n e affect b o n e s tre n g th in different w ays(9], QCT
has bee n k n o w n for s o m e tim e n o w to be a non-invasive, a c c u ra te m e th o d of
asse ssin g both th e s tr u c t u r e a n d d e nsity of b o n e (1 0 ]. Until th e re c e n t ad v e n t of
im p ro v ed CT technology an d ad v a n c e d so ftw a re analytic algorithm s, th e use of
QCT had been limited d u e to ra d ia tio n dose concerns, p artic u la rly in the
pa e d ia tric p o p u l a t i o n ( 5 , 11). pQCT, w h e re b o n e analysis of an a na tom ic
p e r ip h e r y is the focus, initially e m e r g e d as a lo w e r-d o se CT alternative, albeit
w ith o u t th e ability to p ro v id e spinal data o r th e level of detail collected by
QCT(l). Both CT m e th o d s hav e an a d v a n ta g e o v e r DXA, in th a t th e y are able to
p rovide stru ctu ra l d etails a b o u t th e bone being analysed. This can be com bined
w ith o th e r m e a s u r e m e n ts such as regional m uscle s tre n g th to en a b le in tere stin g
m e th o d s of in te r p r e ta tio n such as th e functional a p p r o a c h desc rib ed by
Schoenau e t al(12). At p r e s e n t h ow ever, th e n u m b e r of c e n tr e s offering QCT
imaging is limited an d few p a e d ia tric re fere n ce d a ta s e ts have bee n published.
1.2 Paediatric DXA
h o r m o n e in a bid to stabilise o r im prove b o n e density. W hilst th e s e
m ed ica tio n s can be beneficial, th e y are asso c ia te d with clinically significant
side effect profiles and it is highly desira b le to limit th e ir use to patien ts
m o s t likely to benefit. Misdiagnosis of low b o n e d ensity on DXA can lead to
th e in acc u rate identification of patien ts in nee d of pharm acologic
in terve ntion.
Multiple factors c o n trib u te to the m isdiagnosis of low b o n e d e nsity in children. In
one stu d y of pa e d ia tric DXA results, up to 8 8 % of scans had one or m o re
in te r p re ta tiv e erro rs, th e m o st co m m o n of w hich w a s th e use of a T-score r a th e r
th an a Z-score (14). O ther e r r o r s included technical p r o b le m s with data
acquisition, statistical e r r o r s in in te rp re ta tio n an d failure to ac co u n t for ethnicity,
sex or b o n e size.
1.3 DXA and Bone Size
Correction of DXA re su lts for b o n e size o r h eig h t is n e c e s s a ry bec au se DXA
s c a n n e rs o btain d ata by projecting an x-ray beam th ro u g h th e p a tie n t to a
Many pa e d ia tric p a tie n ts u n d e rg o in g DXA e x a m ina tion have chronic conditions
th a t place th e m a t risk of having sm aller th a n ave rage b o n e s a n d / o r p o o r b one
health. In o r d e r to p ro v id e a c cu ra te pa e d ia tric DXA results, it is im p o r ta n t th a t
imaging is p e r fo rm e d on a vi^ell-maintained DXA scanner, t h a t ac co u n t is m a d e of
p a tie n t h eight an d t h a t re su lts a r e p u t in th e co ntext of a re le v a n t re fere n ce
range. It has been suggested t h a t deviations in b o d y an d b o n e size could im pact
aBMD to a clinically significant d egree in up to 17% of children u n d e rg o in g DXA
im aging(16).
Volum etric es tim a te s of aBMD re su lts a t t e m p t to tak e ac co u n t of v aria tions in
b o n e size and have bee n show^n to ca rry a h ig h e r coefficient of v a r ia n t to ash
analysis th an aBMD(7). in o r d e r to m aintain an acceptable level of accuracy in
th e use of DXA in children it is th e re fo re n e c e s s a ry to a d ju s t areal DXA d ata to
e stim a te a v o lu m etric result. Accordingly, a guideline d o c u m e n t p u b lished by the
In te rn a tio n a l Society for Clinical D e n sito m e try (ISCD] states th a t p ed iatric aBMD
re su lts should be c o rre c te d for height(17). The ISCD guidelines, p u b lished in
2007, do n o t specify th e m e th o d of c orrec tion t h a t should be used. Some DXA
s y ste m s p rovide an inbuilt option for height correc tion b u t th e ab se n ce of such
an option is com m on. DXA scans p e r fo rm e d a t th e Adelaide an d Meath Hospital
in c o rp o ra tin g th e National C hildren’s Hospital (AMNCH) are p e r fo rm e d on a GE
L unar Prodigy DXA system t h a t utilises th e m o s t re c e n t GE p a e d ia tric analysis
softw are. C o rre sp o n d e n c e w ith GE H ealthcare p rio r to this stu d y re vealed that,
w h ilst th e m achine u ses ad v a n c e d p ed iatric softw are, t h e r e is no available
1.3.i Correction o f BMD results fo r Bone Size
The literature reveals two principal methods for the adjustm ent of aBMD
results for bone size to produce a volumetric BMD (vBMD) estimate. The
method described by Kroger et al, in which the vertebral body is assumed to
be cylindrical in shape, provides a corrected BMD [BMD
corr
Kroger et al:
B M D corr = BMC/Volume = aBMD
x
[4/ ( t t
x
Width)]
The method described by Carter et al, who coined the term bone mineral
a pparent density (BMAD), uses bone area to estimate bone width(18, 19):
Carter et al:
BMAD = BMC/Volume = BMC/(Area)i-5
Both the Kroger and Carter methods provide densitom etry results in g/cm^
and both have been used to estimate vBMD in published studies. The Carter
method initially provided an estimate of bone volume at a time before DXA
scanners had the ability to automatically m easure vertebral width. Vertebral
width is now routinely provided as p a rt of the result data. The Kroger
method was chosen for use in this study as it requires p aram eters that are
readily accessible in GE Lunar Prodigy reports and is used by a num ber of
academic groups who have acquired and published normative paediatric
In o r d e r for BMDcorr to be clinically useful, it n e e d s to be r e p o rte d as a Z-
score in th e co ntext of a re fere n ce ra n g e th a t is re le v a n t to both th e p a tie n t
being asse sse d an d th e DXA system p e r fo rm in g th e d ata acquisition and
analysis.
1.4 DXA Cross Calibration
Detailed analysis of d e n s ito m e try re s u lts from different DXA system s suggests
t h a t th e p r im a r y cause for in te r-sy ste m v aria tio n is th a t th e y em ploy different
m athem atical e q u a tio n s in b o n e d e te c tio n [2 0 ). C om parison of DXA results
obtained on different s c a n n e rs is n o t s tra ig h tfo rw a rd an d re q u ir e s the
calculation an d im p le m e n ta tio n of com plex m a th em atica l 'cross calibration'
eq u a tio n s(2 1 -2 3 ]. Significant differences in Z-scores have even been
d e m o n s tra te d a m o n g re fere n ce d a ta b a s e s a c q u ired on the sa m e b ra n d of
sca n n e r[2 4 ). In th e case of so m e system s, for exa m p le GE DPX-L and GE Lunar
Prodigy, th e c o m p a riso n of d ata is m a d e m o re com plicated by funda m e ntal
differences in scan acquisition tec h n iq u e . Older scanners, such as th e DPX-L, use
a 'pencil b e a m ’ te c h n iq u e w hile t h e L u n ar Prodigy u ses a m o re adva n ced 'fan
b e a m ' m e th o d o f imaging. It is well d o c u m e n te d t h a t pencil bea m an d fan beam
DXA sy stem s p r o d u c e differing results, w h ic h can be clinically significant[25).
One s tu d y th a t eva lu a ted DXA d ata a c q u ir e d using GE DPX-L a n d GE Lunar
P rodigy DXA s y stem s in th e sa m e children re v e a le d t h a t lu m b a r spine BMD w as
1.6% hig h er on th e Prodigy th a n t h e DPX-L system , with p<0.0 0 01(26].
re le v a n t to th e b o d y region in question. This allows an estim atio n of th e over- or
u n d e r -e s tim a tio n of DXA p a r a m e te r s m e a s u r e d on one system b u t analysed
using a re fe re n c e ra n g e ac q u ired on a n o th e r (2 7 ). Cross calibration e q u a tio n s
th e re fo re differ d e p e n d in g on th e specific DXA s c a n n e rs concerned. The
im p le m e n ta tio n of cross calibration e q u a tio n s reduces, b u t d oes n ot eliminate,
th e v aria tio n in t h e s e re su lts(2 8 ).
1.5 Influences of Bone structure and Health
1.5.1
Ethnicity
Ethnic differences in BMC and aBMD w e re confirm ed in th e Bone Mineral Density
in Childhood Study (BMDCS)(29]. Bone size has been sh o w n to be th e p rim a ry
d e te r m in a n t of differences in BMC b e tw e e n ethnicities; a s e c o n d a ry effect is
m e d ia te d by extrinsic factors such as diet an d exercise[30].
l.S .ii Nutrition
The 2003 W orld Health O rganisation [WHO) r e p o r t on diet, n u tritio n and
be o th e rw is e healthy.
Vitamin D3 [cholecalciferol) is g e n e ra te d in th e skin w h e n it is exposed to
ultrav io let light. Vitamin D2 (e rgosterol], on th e o t h e r hand, is ingested from
d ie ta ry sources. Both cholecalciferol an d erg o ste ro l u n d e r g o initial hydroxylation
in th e liver, re sulting in m etabolically active 25-dihydroxycholecalciferol
[25[OH)D) com p o u n d s. Some 25(OH)D is co n v e rted in th e kidneys to calcitriol,
w hich has a re g u la to ry effect on th e level of calcium in th e blood an d has a
positive im p a c t on b o n e g ro w th an d rem odeling. It is 25(OH)D th a t is u sed as a
m e a s u r e of system ic Vitamin D; p lasm a 25(OH]D less th a n 5 0 n m o l/I is
co n sid e re d low in Ireland.
Low vitam in D levels, especially co m m o n in w in t e r an d s p rin g in Europe, m ay
e x a c e rb a te t h e d e trim e n ta l effect of hypocalcaem ia on b o n e m inera lisatio n (3 3 ).
Vitamin D deficiency h as bee n s h o w n to co rrelate w ith in cre ased body fat and
w ith re d u c e d height, b u t d oes no t a p p e a r to be directly linked to lo w er p e a k bone
m a ss[3 4 ]. T here a r e conflicting r e p o r ts of the in d irec t im p a c t of low circulating
plasm a 25[OH)D on size-adjusted BMC b u t m e e tin g th e criteria for n orm al
vitam in D statu s in childhood has b e e n sh o w n by so m e to positively affect b one
m a ss(3 5 ). Despite a p re viously held belief th a t low m a te r n a l vitam in D levels
m ay a d v e rsely im p a c t infant BMC, r e c e n t stu d ies have failed to s u p p o r t this
theory, w ith no d e m o n s tr a b le association d etec te d (3 6 -3 9 ).
The effect of fruit an d veg e ta b le c o n su m p tio n on BMC and BMD has bee n widely
studied. Overall, th e evidence su g g ests a positive association b e tw e e n
c o n su m p tio n of fruit and, to a le s s e r degree, vegetables, a n d b o n e m ineral values
hea lth in d e p e n d e n t of gender, exercise, height, weight, BMI an d bo d y fat; milk
p ro te in co n su m p tio n in childhood a p p e a r s to confer b enefit to th e b one
m in era lisatio n p ro c ess (41-43). Studies hav e failed to s h o w a d irec t positive
effect of b re a stfe e d in g o v e r an d above form ula feeding on b o n e d en sity la te r in
childhood(44).
l.S .iii Body Composition, Birth Weight
Body com position b ro a d ly refers to an in dividua l’s relative a m o u n ts of fat and
lean tissu e mass; it p ro v id es m o re detailed in form ation th a n bo d y m ass index,
which does no t differentiate b e tw e e n fat an d lean mass. As well as m easu rin g
b o n e d en sity p a r a m e te rs , DXA sc a n n e rs can p rovide body com position data. It is
im p o r ta n t to tak e into ac co u n t b o th lean b o d y m ass (which m ay have a positive
association w ith BMD) an d fat b o d y m ass (which m ay have a negative association
w ith BMD) w h e n evaluating b o n e hea lth in children(45). W hole b o d y DXA is one
m e th o d of estim atin g lean and fat mass. Although a d o lesc en ts w h o have higher
bo d y fat also te n d to have h ig h e r b o n e mass, t h e association a p p e a r s to be
m e d ia te d by th e ir conco m itan tly h ig h e r lean bo d y mass; it has b e e n s h o w n t h a t
fat m ass alone does n o t im p ro v e BMD in o v e rw e ig h t a d o le sc e n t boys(46, 47). In
girls w h o are o v e rw e ig h t o r obese, BMC an d BMD increase in p ro p o r tio n to the
in cre ased lean c o m p o n e n t of th e ir b o d y m ass r a t h e r th a n to th e fat
c o m p o n e n t(4 8 ). In fact, a lthough in c re a se d w eig h t is, overall, beneficial to bone
health, fat m ass (as o p p o se d to lean m a ss) m ay actually have a negative effect; in
tw o individuals of th e sa m e w e ig h t an d sex BMC has bee n found to be lo w e r in
in girls h a s a negative asso c ia tio n w ith vBMD in th e fe m u r an d tibia[51). It has
also b e e n s h o w n th a t ra ise d BMI in childhood can lead to early puberty, th u s
negatively affecting th e ac h ievable p e a k b o n e m ass(52).
Bone is c o m p o sed of a d e n se o u t e r rim of cortical b o n e an d a less d en se in n e r
core t h a t is re fe rr e d to as ‘ca n cello u s’ o r ‘tr a b e c u l a r ’ bone. T ra b e c u la r b o n e has a
la ttic e w o rk s tru c tu re , w ith a fine solid m a trix t h a t is s u r r o u n d e d by b one
m a rr o w . Bone m a r r o w v arie s in its com position; in childhood, hae m a to p o ie tic
m a r r o w p r e d o m in a te s but, as skeletal d e v e lo p m e n t p roc eeds, this is gradually
c o n v e rte d to m o re fatty m a rr o w . In a d d itio n to total body fat having an im p a c t on
b o n e density, th e a m o u n t of fat w ith in th e b o n e m a r r o w also a p p e a rs to have an
effect. The specific im p act o f m a r r o w fat on b o n e d en sity has bee n studied with
QCT analysis of m a r r o w com position. W h e re a s DXA ca n n o t differentiate the
relative p e rc e n ta g e s of tra b e c u la r an d cortical bone, QCT easily distinguishes
th e s e c o m p o n e n ts (5 3 ) . One s tu d y using QCT d e m o n s tr a te d th a t bone s tre n g th
w a s in c re a se d and m a r r o w fat w a s d e c re a s e d in female athletes, with the a u th o rs
suggesting th a t incre ased o s te o b la s t activity, trig g ere d by re d u c e d m a r r o w fat
levels, m ay play a key role in t h e e n h a n c e d b o n e s tre n g th conferre d by
exercise(54).
b e tw e e n u n co m p licated p r e m a tu r ity and low b o n e m a ss in adulthood,
p r e m a tu r ity asso c ia te d w ith v ery low b irth w e ig h t (VLBW] (birth w eig h t less
th a n l,5 0 0 g ) o r o th e r com plications has bee n sh o w n to be associated w ith
im p aired BMD a t th e p o in t of pea k b o n e m a ss in ea rly a d u lth o o d (6 0 ). In addition
to th e findings re g a rd in g b irth w e ig h t and la te r b o n e mass, low BMD in childhood
te n d s to p e r s is t o v e r m e d iu m -te rm follow u p (6 1 ). It has also b e e n sh o w n that,
w ith o u t b one-m odifying interventions, b o n e m ass tra c k s along percen tile curves
in adolesc ence (62, 63].
l.S.iv Exercise
Given th e m alleability of th e developing skeleton an d th e te n d e n c y of BMD to
follow pe rc e n tile curves over time, exercise d u rin g th e perio d of childhood bone
g ro w th is of p a rtic u la r benefit in maximizing b o n e s tre n g th and m inimizing
fractu re risk in ad u lth o o d (6 4 ]. Some in cre ase in BMC an d BMD continues even
b eyond th e age of p u b erty ; it has bee n s h o w n th a t exercise in y o ung m en can also
increase b o th BMC an d b o n e volu m e[6 5 ). However, th e tim e of p e a k effect of
exercise on b o n e s tr u c tu r e an d m in era lisatio n is in childhood and
adolesc en ce [6 6 ]. The perio d of maximal b enefit of exercise on b o n e hea lth in
girls h as bee n suggested to be T a n n e r stage I, before th e perio d of accelerated
skeletal g ro w th associated w ith p u b e r ty ( 6 7 ). Early m o d e ra te ly vigorous physical
activity has b e e n s h o w n in o th e r stu d ies to have a lo n g -term beneficial effect on
BMC in boys[68]. In fact, th e b enefit of w e ig h t b e a rin g exercise in childhood can
be seen well into adulth o o d , in th e form of m e a s u r e d s tru c tu ra l an d m ineral
b e n e fit in te rm s of b o n e h ea lth p a r a m e te r s into a d u lth o o d ev e n if partic ip a tio n in
physical activity ceases[71). Similarly, contin u atio n of childhood exercise
p a rtic ip a tio n from adolesc ence into early a d u lth o o d assists in m a intaining pea k
b o n e m a ss in females[72).
In a d d itio n to th e tim ing of exercise in childhood, t h e type, in tensity an d daily
d u ra tio n of physical activity a r e im p o rta n t d e te r m in a n ts of b o n e health. The type
of exercise chosen d e te r m in e s n o t only w h e th e r t h e r e will be a benefit to b one
h e a lth b u t also w hich bones, if any, will be affected. Aerobic b u t non -w e ig h t
b e a rin g s p o rts re d u c e BMl b u t do n o t te n d to co n fer an in cre ase in bone
m a ss(7 3 , 74). P opu la tio n -b ased exercise p r o g r a m m e s for school aged children
h av e b e e n sho w n to have a beneficial effect on b o n e m ass a n d b o n e size[75). In a
S w edish study, school aged boys parta k in g in th e re c o m m e n d e d 60 m in u te s of
school exercise p e r w e ek w e r e c o m p ared w ith boys p a r ta k in g in 40 m in u te s of
school exercise p e r day; th o se w ith th e higher exercise partic ip a tio n had
i n c re a se d lu m b a r BMC afte r tw o y ea rs(7 6 , 77). One stu d y d e te r m in e d th a t a
positive effect on b o n e m a ss w a s seen w ith just 28 m in u te s p e r day of vigorous
should be performed every day[81).
1.5.V
Sm oking
In addition to the more established non-hereditary influences on bone
health, there is limited evidence to support an association betw een passive
exposure to household cigarette smoke in early adulthood and reduced
prem enopausal bone mass in adult women(82]. There is little in the
literature th at addresses the impact of passive cigarette smoke on bone
health in children.
1.6 Reference Ranges
In adult women, significant differences betw een BMD z-scores calculated from
US and UK reference data suggest that the populations cannot be used
interchangeably for the purpose of calculating Z-scores(83). This may also apply
to paediatric DXA scanning. Analysis of Irish and UK height and weight reference
data by Hoey also revealed significant differences in the trajectory of the
percentile curves betw een the Irish and UK populations(84].
In the lead up to this research an initial audit was undertaken to determine
w h e th e r it would be worthwhile developing an Irish reference range for
pediatric aBMD and
B M D c o r r ( 8 5 ) .The aOMD results of 66 children who were
of p a tie n ts w e r e included; th o s e b o rn small for gestational age an d had
failed to d e m o n s tr a te catch-up g ro w th [n=19), an d a g roup of p a tie n ts with
cystic fibrosis [CF] (n=47).
B M D c o r rw a s calculated for each p a tie n t using the
Kroger m e th o d a n d su b s e q u e n tly co m p a re d to age- and sex-m atched
re fe re n c e d ata from th e N e th e rla n d s(8 6 ). The Dutch s tu d y w a s chosen
b e c a u se its c o h o r t closely r e s e m b le d th e p ro sp e c tiv e Irish c o h o rt of healthy
Caucasian children. In addition, th e stu d y p u b lish ed th e s ta n d a r d deviation
r e q u ir e d to allow calculation of a Z-score. The p a tie n ts ' original Z-score,
calculated from aBMD, an d t h e i r heig h t-a d ju sted Z-score, calculated from
B M D c o r r ,
w e r e c o m p a r e d by a p plying S tu d e n t's t-test. We found th a t th e Z-
scores for BMDcorr differed significantly from Z-scores for aBMD in both
g ro u p s studied. In the SGA g roup, th e m ean aBMD Z-score w a s -1.1 and the
m ean BMDcorr Z-score w a s 0.1 [p=0.000). In th e CF group, th e m ean aBMD Z-
score w a s -1.3 a n d the m ean
B M D c o r rZ-score w a s -0.4 (p=0.002). Overall, the
m e a n aBMD Z-score w a s -1.1 a n d the m ean BMD
c o r rS C O r0 W 3 S
“ 0 . 2(p=0.000). With conve rsion o f aBMD to
B M D c o r r ,t h r e e p a tie n ts w h o initially
had Z-scores th a t w e r e low en o u g h for th em to be co n sid ered ca ndida tes for
b is p h o s p h o n a te o r g ro w th h o r m o n e th e r a p y w e r e found to have BMDcorr Z-
scores above t h e th re s h o ld for tr e a tm e n t. This a u d it w as limited both by th e
a b se n c e of an Irish re fe re n c e ra n g e against w hich to co m p a re th e results
a n d by th e fact t h a t th e Dutch d a ta s e t w a s a c q u ired on a different DXA
s y stem [a GE s c a n n e r b u t of t h e DPXL r a th e r th a n L unar P rodigy subtype).
Despite its lim itations, t h e a u d it p ro v id ed som e s u p p o r t for th e
non-Irish, n o n -L u n a r Prodigy re fe re n c e d a ta s e t w as u s e d to eva lua te s ta n d a r d
deviations from th e m ean.
1.7 Research question
The aim of this s tu d y is to ac q u ire n o rm ativ e DXA d ata for Caucasian Irish
children sca n n ed on a GE L unar Prodigy DXA system . This is w ith a view to
p ro v iding a re le v a n t local re fe re n c e ra n g e th a t facilitates contextualisation of
p a e d ia tric DXA results, allows a d ju s tm e n t for b one size a n d m inim ises th e risk
th a t pa e d ia tric DXA re su lts will e r ro n e o u s ly lead to p h arm acologic in tervention
CHAPTER 2
METHODOLOGY
2.1 P a rticip a n ts
P articipants w e r e re c ru ite d from t h e Dublin a r e a th ro u g h th e National Children’s
Hospital [NCH] in Tallaght. The NCH is a 6 5-bed p a e d ia tric teaching hospital
associated w ith T rinity College Dublin a n d has Accident an d Emergency,
inpatient, o p erativ e an d o u tp a tie n t services; a p p r o x im a te ly 65,000 children
a tte n d th e hospital every year. A d v e rtise m e n ts w e r e placed in th e w aiting areas
of th e p a e d ia tric o u tp a tie n t clinic, o p e r a tin g ro o m and radiology d e p a r t m e n t in
An electronic a d v e r tis e m e n t visible to all staff m e m b e r s a t AMNCH w as also
placed on th e hospital in tr a n e t n o ticeb o a rd ; this w as r e n e w e d every 6 m o n th s
for th e first 18 m o n th s of th e study. T he m ajo rity of r e s p o n d e n ts contacted the
a d m in istra tiv e staff of th e pa e d ia tric d e p a r t m e n t of th e NCH in p e r s o n o r by
te lephone ; th e r e m a in d e r con tac ted th e p rinciple in v estig ato r by email. At least
th r e e a tte m p ts w e r e m a d e by th e p rincipa l in v estig ato r to c o n tac t each
re s p o n d e n t by telephone.
gestational age a t birth, b irth w eight, medical conditions, m edications, allergies
and fra c tu re history. P rospec tive p a rtic ip a n ts w e r e excluded if th e y w e r e not
Caucasian, h ad a diagnosed chronic medical c o ndition [including b one disease,
cystic fibrosis, in flam m ato ry bow el disease an d se v e re asth m a], used
m ed ica tio n s t h a t im p act b o n e hea lth (for e x a m p le oral steroids], had a significant
family h isto ry of p rim a ry o ste o p o ro sis o r had a h isto ry of fractu re (s] associated
w ith no or m inim al tr a u m a (for exam ple following a fall from s ta n d in g height].
Female p a r tic ip a n ts w h o had begun m e n s tr u a tio n w e re sch e d u le d for DXA
imaging b e tw e e n day one an d day ten of th e ir m e n s tru a l cycle. This w a s in
com pliance w ith th e local 'Ten-Day Rule’ re g u la tio n gov ern in g th e use of ionising
ra d ia tio n in females of childbearing potential.
2.2 Consent, Auxiology
Ethical ap p ro v al for th e stu d y w a s g ra n te d by th e joint AMNCH - St Jam es’s
Hospital (SJH] R esearch Ethics Com mittee. At th e tim e of th e ir child o r children's
scan each p a r e n t o r g u a rd ia n signed a form co n se n tin g to th e ir p articipation. The
s tu d y ra d io g ra p h e rs, w h o are tra in e d in t h e c o r re c t p r o c e d u re , p e r fo rm e d
Auxiological asse ssm e n t. Height w a s m e a s u r e d w ith a 'H a rp e n d e n ' s ta d io m e te r
using a s ta n d a r d iz e d te chnique , w ith t h e h e a d in th e F ra n k fu rt plane. W eight w as
a sse sse d using a self-zeroing Seca (H amburg, G erm any] electronic scales, w ith
th e p a r tic ip a n ts w e a rin g light in d o o r clothing a n d no shoes. Height an d w eig h t
w e re ana lyse d by age an d c o m p a r e d to t h e Irish re fe re n c e data. Body m ass index
2.3 Pubertal Assessment
Form al a s s e s s m e n t of p u b e rta l stage w a s offered to m ale p a rtic ip a n ts nine y ea rs
an d o lder an d to female p a rtic ip a n ts eight y e a rs and o lder w h o had n o t y e t had a
m e n s tru a l period. Due to v ery low ra te s of ac cep tan c e to u n d e rg o formal clinical
a sse ssm e n t, optional self-assessm en t of p u b e r ta l stage w a s offered as an
alternative; p u b e rta l se lf-assessm en t form s w e r e given to th e p a r e n t or g uardia n
of re le v a n t p a r tic ip a n ts for com pletion a t hom e. The sta n d a r d is e d m ale and
female forms asked p a rtic ip a n ts or th e i r p a r e n t o r g uardia n to asse ss w hich of a
serie s of s ta n d a r d is e d p h o to g ra p h s c o r re s p o n d in g to T a n n e r stages I to V m o st
closely re sem b le d th e ir p u b erta l stage (Appendix 2](87). The re la tionship of
T a n n e r stage to aBMD an d BMDcorr w a s evaluated.
2.4 Diet and Lifestyle Questionnaire
Diet an d lifestyle w e r e a sse sse d by postal q u estio n n aire . P a rticipants w e re asked
to detail th e ir dietary intake (dairy p ro d u c ts, vegan o r veg e ta rian diet and
d ie ta ry s u p p le m e n ts), physical activity levels, s e d e n ta r y habits, use of p o rtab le
digital devices an d e x p o s u r e to e n v iro n m e n ta l sm o k e ov er th e perio d leading up
to th e ir DXA a s s e ssm e n t. Completed form s w e r e re tu r n e d to th e principal
investig ato r in th e NCH radiology d e p a rtm e n t. Dietary factors w e r e ana lyse d by
2.5 Bone Mineral Density Assessment
Bone d e n s ito m e tr y w a s a s s e sse d using DXA imaging. DXA scanning w as
p e r fo rm e d by one of four pa e d ia tric DXA ra d io g r a p h e r s , ail of w h o m p erform
p a e d ia tric a n d a d u lt DXA scans on a w eek ly basis in AMNCH an d a r e tra in e d in
the use of th e h a r d w a r e an d softw are. All scans w e r e a c q u ired using a GE Lunar
Prodigy DXA s c a n n e r [GE Healthcare, Chalfont St Giles, United Kingdom]. The
s c a n n e r u n d e r g o e s daily quality a s s u ra n c e (QA] using a s ta n d a r d GE p h a n to m [a
p h a n to m is a precisely s ta n d a r d is e d model th a t can be u sed to t e s t th e accuracy
of a piece of imaging eq u ip m e n t). Weekly QA using th e specific lu m b a r spine
p h a n to m [L unar 1 8562) is also p e r fo rm e d a n d th e s c a n n e r is serviced regularly
according to th e GE service schedule. A single a n t e r o p o s te r io r [AP] DXA scan of
th e lu m b a r sp in e w a s p e r fo rm e d on each p artic ip a n t, w ith each DXA scan limited
to the AP p rojec tion of th e l u m b a r spine in o r d e r to m in im ise th e dose of
rad ia tio n im p a r te d to th e p a r tic ip a n ts while still p ro v id in g th e d ata re q u ir e d to
com plete t h e study.
The s ta n d a r d DXA b o n e d ata w a s ac q u ired for each p artic ip a n t, including BMC,
BMD an d v e r te b ra l w id th for each v e rte b ra l level from LI to L4. The DXA s c a n n e r
so ftw a re autom atically p r e s e n ts t h e d ata relative to t h e p r e - p r o g r a m m e d norm al
range, p ro v iding a Z-score base d on th e p a t i e n t ’s age a n d sex. The d ata w e re
t r a n s f e r r e d autom atically to th e p ictu re archiving an d com m u n icatio n system
[PACS) of th e h o spital radiology d e p a r t m e n t and s to r e d as a p e r m a n e n t p a r t of
th e p a r tic ip a n t’s medical record. Scans w e r e re p o r te d using th e s ta n d a r d
to have lov^ aBMD [a Z-score of <1 SD c o m p a r e d to th e age an d sex m atch e d
m e a n ] vi^ere re fe rr e d for clinical p a e d ia tric re v ie w in th e NCH.
2.6 BMD Correction for Bone Size
B M D
re sults w e r e ad ju ste d for b o n e size p ro d u c in g co rrec te d
B M D [ B M D c o r r ]
by
using th e m eth o d p u b lish ed by Kroger et al(18):
B M D c o r r
= BMC/Volume = aBMD x [ 4 /(tt
xW idth)]
2.7 Statistical Analysis of Bone Density
P articipants w e r e g ro u p e d by sex an d age (in single years]. The LMS (Cole and
Green] m e th o d w a s u sed to d e te r m in e th e percen tile curves for aBMD an d for
B M D c o r r
for each g e n d e r using th e G eneralised Additive Models for Location, Scale
a n d Shape (GAMLSS] statistical m odelling package in th e R so ftw a re
language(88-90]. The d istrib u tio n of aBMD an d BMDcorr a t each g roup w a s
su m m a ris e d by th e m ed ian M(AgeO, coefficient of v ariation S(AgeO an d th e Box-
Cox p o w e r L(Agei)- The Box-Cox p o w e r w a s u sed to tra n s f o rm th e d ata to m ak e
th e m norm ally d is trib u te d w ithin a p a r tic u la r age group. A sim p le r m odel using
only m ean s an d v aria n c e s w a s also built, in w hich only th e M an d S c o m p o n e n ts
of th e LMS model w e r e used. W o rm plots w e r e u sed to check th e model.
th e re su lts b u t due to small sa m p le sizes, b o o ts tra p p in g of th e LMS m odel w as
n o t possible. B oo tstrap p in g of th e s im p le r MS m odel w a s found to be possible.
The re la tionship of both aBMD an d BMDcorrto b irth w e ig h t w a s analysed and
dep icte d using sc a tte r plots. S e p arate analysis of th e re la tio n sh ip of b o n e density
to b re a stfe e d in g w a s p e rfo rm e d . D uration of daily exercise w a s analysed by age
ra n g e for m ales a n d for females an d co m p a re d to aBMD an d BMDcorr using a
p a ire d S tu d e n t’s t-test.
In o r d e r to calculate th e s ta n d a r d deviation for aBMD o r BMDcorr in an individual
child th e re le v a n t LMS values for th e ir age and g e n d e r a r e used. The following
form ula calculates th e Z-score for a p a r tic u la r yj (in this case aBMD score) a t age
Agei:
CHAPTER 3
RESULTS
3.1 Study pop ulation
Over th e p e rio d of th e stu d y (January 2 0 1 0 to June 2012), a r e q u e s t for fu r th e r
inform ation a b o u t th e stu d y w as received from ap p ro x im a te ly 180 p a r e n ts o r
g uardians, m a n y of w h o m had m o re th an one child w ithin th e age range covered
by th e study. In total, th e p a r e n ts or g u a rd ia n s of a p p ro x im a te ly 260 children
b e tw e e n th e ages of 6 and 16 y e a rs re s p o n d e d to e ith e r th e p r in te d or electronic
a d v e rtise m e n t. The stu d y could n o t be d iscussed with the p a r e n ts or g u a rd ia n s of
a p p ro x im a te ly 40 children due to in co rrect c o n ta c t details being provided, the
r e s p o n d e n t no longer having in te re st in t h e stu d y o r the r e s p o n d e n t being
u nable to discuss th e stu d y a t the tim e of contact.
The total s tu d y p o p u latio n consisted of 162 h e a lth y Irish Caucasian children [84
male, 78 female] aged b e tw e e n six an d 16 y e a rs (Table 1). All p e r fo rm e d scans
Age (years)
G ender
Total
Fem ale (n)
Male (n)
6-6.9
7
8
15
7-7.9
8
6
14
8-8.9
9
4
13
9-9.9
8
11
19
10-10.9
6
9
15
11-11.9
10
7
17
12-12.9
10
9
19
13-13.9
9
11
20
14-14.9
6
9
15
15-15.9
1
7
8
16-16.9
4
3
7
Total
78
84
162
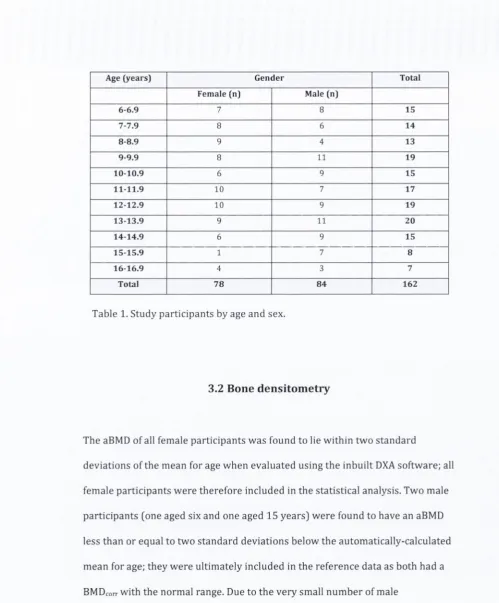
Table 1. Study p artic ip a n ts by age a n d sex.
3.2 Bone densitom etry
The aBMD of all female p a rtic ip a n ts w a s found to lie w ith in tw o sta n d a r d
deviations of th e m e a n for age w h e n e v a lu a te d using th e inbuilt DXA softw are; all
female p a rtic ip a n ts w e r e t h e re fo re included in th e statistical analysis. Two male
p a r tic ip a n ts (one aged six an d one aged 15 y e a rs] w e r e found to have an aBMD
less th a n or equal to tw o s ta n d a r d dev iatio n s belo w th e autom atically-calculated
m e a n for age; th ey w e r e u ltim ate ly included in th e re fe re n c e d ata as b o th had a
BMDcorr w ith th e n o rm al range. Due to t h e v ery small n u m b e r of male
p a r tic ip a n ts aged 16, th e s e p a rtic ip a n ts w e r e o m itted in th e analysis using th e
Cole and Green m ethod. T h re e fu r th e r p o in ts w e re also o m itted from th e m ale
LMS analysis; one low aBMD re su lt in a 14 y e a r old an d tw o low aBMD re su lts in
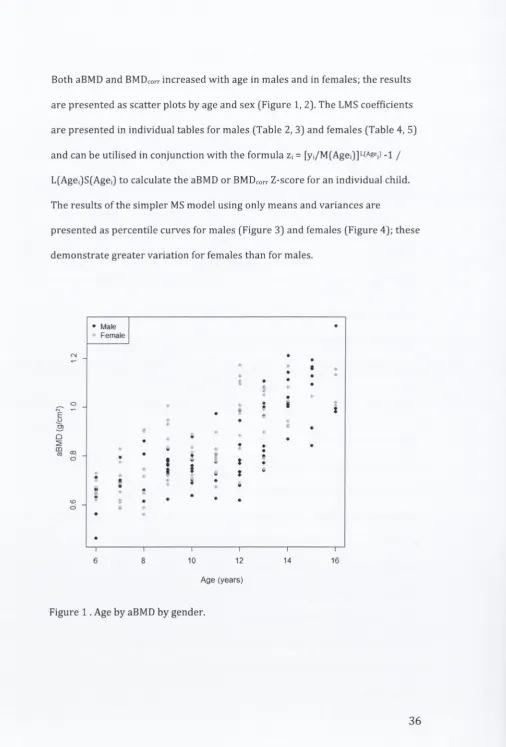
[image:36.520.10.510.40.644.2]B o th aBMD a n d
B M D c o r ri n c r e a s e d w i t h a g e in m a l e s a n d in fe m a le s ; t h e r e s u l t s
a r e p r e s e n t e d a s s c a t t e r p l o t s b y a g e a n d se x (F ig u re 1, 2). T h e LMS c o efficien ts
a r e p r e s e n t e d in in d iv id u a l ta b l e s fo r m a l e s (T a b le 2, 3) a n d f e m a l e s (T ab le 4, 5]
a n d c a n b e u tilis e d in c o n j u n c t i o n w i t h t h e f o r m u l a
z\ =
[yi/M(Agej)]L(Agei) - i
j
L(Agei)S(AgeO to c a lc u la te t h e aBMD o r
B M D c o r rZ -sc o re fo r a n in d iv id u a l child.
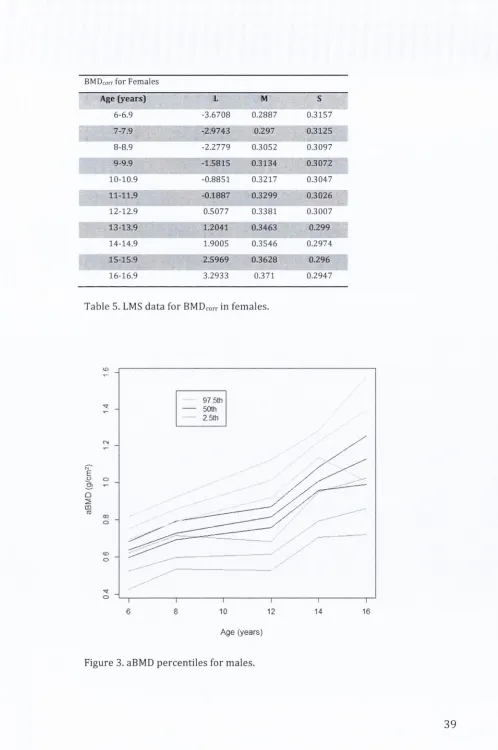
T h e r e s u l t s o f t h e s i m p l e r MS m o d e l u s i n g o n ly m e a n s a n d v a r i a n c e s a r e
p r e s e n t e d a s p e r c e n t i l e c u r v e s fo r m a l e s (F ig u r e 3) a n d f e m a le s (F ig u r e 4); t h e s e
d e m o n s t r a t e g r e a t e r v a r i a t i o n for f e m a le s t h a n fo r m ales.
E
'
5
)m
ra
Male
Female
10
12
A ge (y ears)
— V
14
•
.
• •I
16
[image:37.520.4.511.40.788.2]• Male
Female
- To
Q
5
CO10
I
12
14
16
Age (years)
Figure 2. Age by
B M D c o r rb y gender.
aBMD for Males
Age (years)
L
M
S
6-6.9
4.4744
0.6412
0.1451
7-7.9
3.2363
0.6949
0.1405
8-8.9
2.1516
0.7333
0.1284
9-9.9
1.2635
0.7477
0.1143
10-10.9
0.5507
0.7501
0.1236
j
i i - i i . 9
0.0394
0.7636
0.1567
12-12.9
-0.2644
0.8096
0.1765
13-13.9
-0.4308
0.8996
0.1439
14-14.9
-0.5284
1.0209
0.0806
15-15.9
-0.6007
1.1497
0.0806
[image:38.521.11.512.38.663.2]B M D c o r r
fo r M a les
Age (y ea rs)
L
M
S
6-6.9
1.0701
0.2739
0.4607
7-7.9
-0.0069
0.2772
0.4283
8-8.9
-0.7272
0.2799
0.3991
9-9.9
-0.9303
0.2813
0.3737
10-10.9
-0.6933
0.2824
0.3502
11-11.9
-0.2341
0.2851
0.3264
12-12.9
0.3035
0.2923
0.2996
13-13.9
0.9528
0.3061
0.2692
14-14.9
1.7363
0.326
0.2378
15-15.9
2.606
0.349
0.209
Table 3.
L M S
data for
B M D c o r r
in m ales.
aBMD for F em ales
Age (y ea rs)
L
M
S
6-6.9
-0.9908
0.656
0.088
7-7.9
-0.7609
0.698
0.1591
8-8.9
-0.531
0.74
0.2072
9-9.9
-0.3012
0.7821
0.184
10-10.9
-0.0713
0.8242
0.1502
11-11.9
0.1586
0.8664
0.1527
12-12.9
0.3885
0.9087
0.1654
13-13.9
0.6184
0.951
0.1383
14-14.9
0.8483
0.9934
0.0962
15-15.9
1.0782
1.0357
0.068
16-16.9
1.308
1.0781
0.0533
BMDcorr
for F em ales
Age (years)
L
M
S
6-6.9
-3.6708
0.2887
0.3157
7-7.9
-2.9743
0.297
0.3125
8-8.9
-2.2779
0.3052
0.3097
9-9.9
-1.5815
0.3134
0.3072
10-10.9
-0.8851
0.3217
0.3047
11-11.9
-0.1887
0.3299
0.3026
12-12.9
0.5077
0.3381
0.3007
13-13.9
1.2041
0.3463
0.299
14-14.9
1.9005
0.3546
0.2974
15-15.9
2.5969
0.3628
0.296
16-16.9
3.2933
0.371
0.2947
Table 5.
LMS
data for
BMDcorr
in fem ales.
<£)
97 5th
50th
25th
o
CO
o
CD
O
'3'
O
6
8
10
12
14
16
A ge (years)
[image:40.521.10.508.37.787.2]97.5th
50th
2 5th
o
00
o
<D
d
6
810
1214
16
[image:41.520.8.512.33.605.2]Age (years)
Figure 4. aBMD percentiles fo r females.
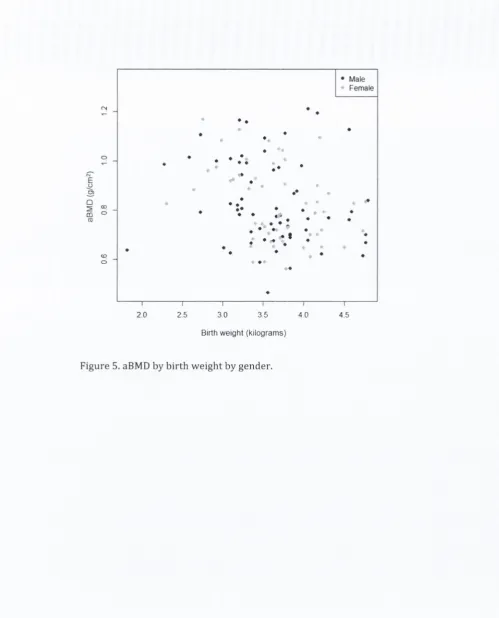
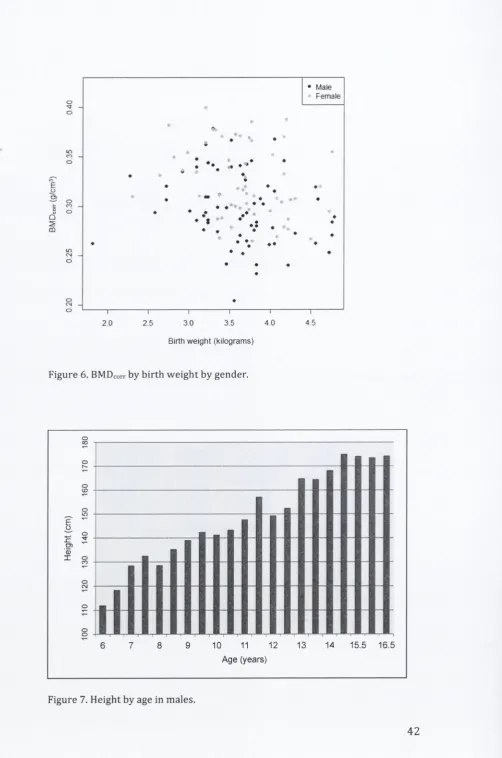
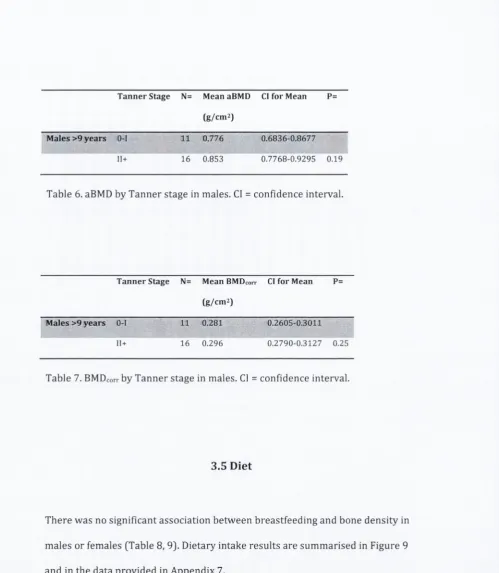
3.3 Birth Weight, Height, Weight, BMI
B irth w e ig h t did n o t corre la te w ith aBMD o r
B M D c o r rin la te r ch ild h o o d [F ig u re 5,
6). As expected, heig h t increased w ith age fo r b o th male and fem ale p a rtic ip a n ts
(Figure 7, 8). O verall the fem ale p a rtic ip a n ts in th e study c o h o rt w e re
s ig n ific a n tly ta lle r than the Iris h reference standard [p = 0 .0 0 0 3 5 ]; th e male
p a rtic ip a n ts w ere also ta lle r b u t th is was n o t sig n ific a n t [p = 1 .7 5 ]. Height, w e ig h t
• Male
* Female
♦
♦
*
• ♦
•
♦
*
•
♦
♦
. •
• •
•
-♦
•
•
♦♦
♦
♦ •
•
«
**
^
♦
♦
•
•
♦
•
•
.
* 1
•
•
«■«
•
♦
•
•
•
♦
4>
« •
•
•
•
♦
\--- 1---1--- 1--- 1---r ~
2 0
2.5
3 0
3 5
4 0
4
5
Birth weight (kilograms)
[image:42.520.13.513.38.657.2]in CO o
♦ Male
• Female
Q
2
CO
•
V
•
• • •
<N
O
— I
---
\--- 1
--- 1
---
r-2 0
2,5
3.0
3.5
4 0
Birth weight (l<liograms)
4 5
Figure 6. BMDcorr by birth weight by gender.
)0
16
0
17
0
180
i ' ' ... ...!
______ ■ ■
JLX
i
i
.
j j m11
.
—
-H
e
ig
h
t
(c
m
)
0
11
0
12
0
13
0
14
0
IE
L .
___
_________________jJ
1
1
I
1
[image:43.520.7.510.29.788.2], 1
... !' T ? ! ? ! t I ' ! 1 1 : ■ I ! 1 • ’ 1
6
7
8
9
10
11
12
13
14
15.5
16.5
A ge (years)
Illllll
JlU
il
Age (years)
Figure 8. Height by age in females.
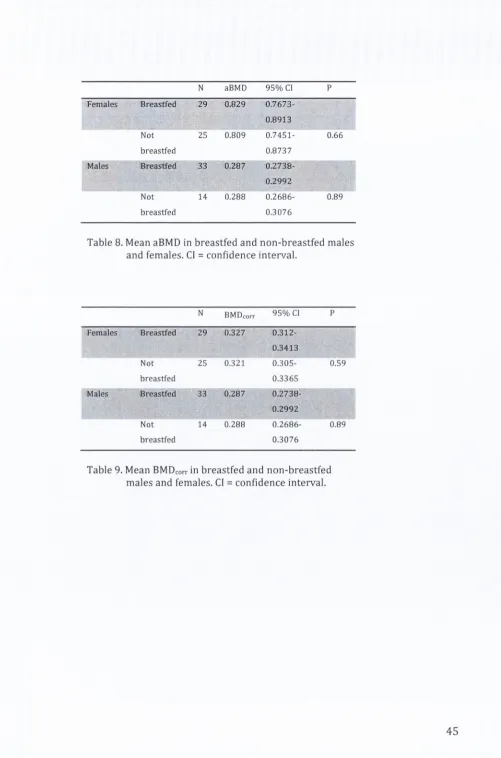
3.4 Pubertal Stage
P u b ertal self-a sse ssm e n t w a s c o m p leted by 27 females w h o w e r e 8 y ea rs or
o ld e r an d by 27 m ales w h o w e r e 9 y e a rs o r o lder a t th e tim e of th e ir DXA
exam ination. P u b ertal stage d ata is su m m a ris e d in A ppendix 6. Male aBMD and
B M D c o r r
re su lts for T a n n e r stages O-I an d 11+ a r e sh o w n b e lo w (Table 6, 7). All
[image:44.520.17.509.40.543.2]T a n n e r Stage
N=
Mean aBMD
Cl for Mean
P=
(g/cm 2)
M ales >9 y e a rs
0-1
11
0.776
0.6836-0.8677
11+
16
0.853
0.7768-0.9295
0.19
Table 6. aBMD by T a n n e r stage in males. Cl = confidence interval.
T a n n e r Stage
N=
Mean BMDcorr
Cl for Mean
P=
(g/cm 2)
M ales
>9
y e a rs
O-I
11
0,281
0.2605-0.3011
11+
16
0.296
0.2790-0.3127
0.25
Table 7.
B M D c o r rby T a n n e r stage in males. Cl = confidence interval.
3.5 Diet
T h e r e w a s no significant association b e tw e e n b re a stfe e d in g an d b one d e n sity in
m ales o r females [Table 8, 9). Dietary intake re su lts are s u m m a ris e d in Figure 9
[image:45.520.10.510.23.597.2]N
a B M D
9 5 % Cl
P
Females
Breastfed
29
0.829
0.7673-0.8913
Not
25
0.809
0.7451-
0.66
breastfed
0.8737
Males
Breastfed
33
0.287
0.2738-0.2992
Not
14
0.288
0.2686-
0.89
breastfed
0.3076
Table 8. Mean aBMD in breastfed and n o n -b re a stfe d m a les
and fem ales. Cl
=
co n fid e n c e interval.
N
BM Dcorr95%
Cl PFemales
Breastfed
29
0.327
0.312-0.3413
Not
breastfed
25
0.321
0.305-0.3365
0.59
Males
Breastfed
33
0.287
0.2738-0.2992
Not
breastfed
14
0.288
0.2686-0.3076
0.89
[image:46.521.7.508.31.789.2]n
I
I
I
I
I
[image:47.520.12.507.24.537.2]■I ■■
■
l | l | III I
I I l l I
B re a s tfe d B re s tfe d > 3
m o n th s
C h e e s e
Milk
Y o g h u rt
Vit D
M ultivitam in
s u p p le m e n t
O % of male respondents
■ % of female respondents
Figure 9. S u m m a ry of dietary intak e re sults in male and female re s p o n d e n ts.
3.6 Exercise
A total of 54 females an d 47 m ales r e tu r n e d exercise data. For m ales of all ages
an d females in th e 6-10 y e a r age range t h e r e w a s no significant difference in
aBMD o r BMDcorr b e tw e e n th o s e w h o exercised less t h a n one h o u r p e r d ay and
th o se w h o exercised m o r e th a n on e h o u r p e r day [Table 1 0 ,1 1 ) . For females
aged 11-16 y e a rs t h e r e w a s a significant inverse re la tio n sh ip b e tw e e n both
aBMD an d BMDcorr an d exercise of one h o u r o r m o re p e r day (p=0.0009 and
Exercise
N=
Mean aBMD
Cl for Mean
P=
(g/cm 2)
All m a les
<1 h o u r/d ay
20
0.786
0.7181-0.8S42
>1 hour/day
27
0.783
0.7244-0.8415
0.94
Table 10. aBMD and e x er c ise in m ales. Cl = c o nfidence
interval.
Exercise
N=
Mean BMDcorr
Cl fo r Mean
P=
(g/cm 2)
All M ales
<1 h o u r/d ay
20
0.285
0.2685-0.3011
>1 hour/day
27
0.289
0.2746-0.3027
0.72
Table 11.
B M D co rr
and ex e r c ise in m ales. CF = confidence
interval.
Exercise
N=
Mean aBMD
(g/cm 2)
Cl for Mean
P=
All fem ales
<1 hou r/d ay
23
0.909
0.8492-0.9694
>1 hour/day
31
0.753
0.7015-0.8051
0.66
6-10.9 y e a rs
<1 hour/day
9
0.768
0.6854-0.8500
>1 hour/day
21
0.729
0.6750-0.7828
0.43
11-16.9 y e a rs
<1 hou r/d ay
14
1
0.9323-1.068
>1 hour/day
10
0.804
0.7240-0.8850
0.0009
[image:48.521.9.509.37.775.2]Exercise
N=
Mean
B M D c o r rCl for Mean
P=
(g/cm2)
All females
<1 hour/day
23
0.342
0.3270-0.3572
>1 hour/day
31
0.31
0.2974-0.3234
0.0024
6-10.9 years
<1 hour/day
9
0.315
0.2904-0.3387
>1 hour/day
21
0.31
0.2942-0.3259
0.75
11-16.9 years
<1 hour/day
14
0.36
0.3426-0.3771
>1 hour/day
10
0.311
0.2908-0.3316
0.001
Table 13. B M D co rr an d exercise in females. Cl
= confidence interval.
Males c o ntinued to exercise in both th e h o m e an d school e n v iro n m e n ts
t h r o u g h o u t th e age ra n g e studied (Figure 10]. Females, on th e o th e r hand,
te n d e d to re d u c e th e ir daily exercise (b o th at h o m e and at school) after th e age of
12 y e a rs (Figure 11).
Age
[image:49.521.6.509.25.799.2]Figure 10. Exercise at home and in school by age in males.
O
o
o
O)
o
0 0
o
o
<D
O
kO
o
o
CO
o
CN
O
O
Age
■ Females some exercise at home
□ Females some exercise in school
Figure 11. Exercise at home and in school by age in females.
3.7 Sedentary pastimes
Analysis o f tim e spent in sedentary pastimes revealed that the m ajority of both
males and females watched between one and three hours o f television per day
[Figure 12). Approxim ately h alf o f participants o f both sexes also played up to an
[image:50.520.15.510.38.547.2]“cr
o
CD
O LO
O
O CO
o
CNJ
o
No TV
0-1 hrs per day
1-3 hrs per day
> 3 h rs p e rd a y
□ % o f male respondents
■ % of female respondents
Figure 12. D aily television w a tc h in g in male and fem ale respondents.
o
CD
O
<=> I
CM
No computer games
0-1 hrs per day
□ % of male respondents
■ % of female respondents
[image:51.521.8.510.25.663.2]3.8 Cigarette Smoke Exposure
V e ry few respondents re p o rte d being exposed to smoi<e in the hom e and none
re p o rte d exposure to smoke in the car (Figure 14).
<D ["■
Smoker at home in the
Smoker at home outside
house
Smoker in car
□ % of male respondents
■ % o f female respondents
[image:52.520.13.513.38.783.2]CHAPTER 4
DISCUSSION
Despite ad v a n c e s in QCT technology, DXA re m a in s a very im p o r ta n t tool in the
evaluation of children at risk of low b o n e density, n o t least be c a u se of its
ubiquity. Radiologists and clinicians w h o o v ersee p a e d ia tric DXA sca nning have a
re sp o n sib ility to o ptim ise p a tie n t care by m aking th e re su lts th e y g e n e ra te as
a c c u ra te an d as re le v a n t as possible. The use of DXA in th e p a e d ia tric setting
re q u ir e s a t h o ro u g h k n o w led g e of th e com plexity of b one d e v e lo p m e n t and b one
health. A ttention to detail is re q u ir e d in th e acquisition an d in te rp re ta tio n of DXA
data. P aediatric DXA re c o m m e n d a tio n s clearly a d d r e s s a n u m b e r of key areas,