The Ecological Effects of Light Pollution:
A three site (Bull Island, Trinity College Dublin & Killiney Hill)
comparative study.
Biodiversity MSc and Conservation 2015/2016 Name: Claire Daly
Student Number: 15305927
Supervisors: Dr Ainhoa González Del Campo and Dr Brian Espey
TABLE OF CONTENTS: Page
DECLARATION i
ACKNOWLEDGEMENTS ii
ABSTRACT iii
LIST OF FIGURES iv
1. INTRODUCTION 1
1.1. Light Pollution 1
1.1.1. What is Light Pollution? 1
1.2.1 The Current Trends in Light Pollution 2
1.2. The Impacts of Light Pollution 3
1.2.1. Impacts on Fauna 3
1.2.2. Effects on Circadian Rhythms of Species 3
1.2.3. Effects on Migration and Orientation 4
1.2.4. The Effects on Predator-Prey Relationships 5
1.2.5. Effects on Birds 5
1.2.6. Effects on Flora 6
1.3. Light Pollution in Ireland 7
1.3.1. Current Status of Light Pollution in Ireland 7
1.3.2. Measures to Eradicate Light Pollution 8
1.4. Dublin Study Sites (Bull Island, Trinity College Dublin and Killiney Hill) 9
1.4.1. Study Site Location and Background 9
1.4.2. Bull Island 10
1.4.3. Killiney Hill 10
1.4.4. Trinity College Dublin 11
1.4.5. Previous Studies 12
1.5. Project Aims and Research Questions 13
2. RESEARCH METHODS 15
2.1. Habitat Profile 15
2.1.1. Pre-Habitat Survey Practices 15
2.1.2. Study Site Visits 15
2.2.1. Light Levels Analysis 16 2.2.2. Study Site Characteristics and Habitats Data/Information 17 Collection
2.3. GIS Analysis 18
2.3.1. Light Level Mapping 18
2.3.2. Study Site Characteristics and Habitat Mapping 19 2.3.3. Habitat and Species Maps for the Light Meter Locations 19
2.4. Light Meter Data Analysis 20
2.4.1. Data Display 20
3. RESULTS 21
3.1. Light Pollution Trends 21
3.1.1. Artificial Light Results 21
3.1.2. Changes in Dublin Light Pollution Trends 22 3.2. Study Site Characteristics and Habitat Mapping Results 25
3.2.1. Bedrock and Soils of Dublin 25
3.2.2. Land Uses of Dublin and the Three Study Sites 27
3.3. Light Meter Locations and Habitats 29
3.3.1. Habitat Mapping of Light Meter Locations- Bull Island, Trinity 29 College Dublin and Killiney Hill
3.4. Species Risk 32
3.4.1. Protected Species of the Study Sites 32
3.4.2. Light Meter Results 36
3.4.3. Protected Species and Light Pollution 41
4. DISCUSSION 44
4.1. Light Pollution in Ireland Examined Through Satellite Imagery 44 4.2. Light Pollution in Dublin and the Light Meter Locations- Bull Island, 45 Trinity College Dublin and Killiney Hill
4.3. Mitigation Measures 45
4.4. The Ecological Impacts of Light Pollution 46
4.5. Comparison to Previous Studies in Ireland 49
5. CONCLUSION 50
REFERENCES 52
i DECLARATION
I, Claire Daly, declare that this dissertation;
I. Has not been submitted as an exercise for a degree at this or any other University. II. Is entirely my own unless stated otherwise, referenced in the text or in the
acknowledgments.
III. That Trinity College Library may lend or copy this dissertation upon request. This covers only single copies for study purposes, subject to normal conditions of acknowledgement.
ii ACKNOWLEDGMENTS
I would like express my deep gratitude and thanks to my supervisors Dr Ainhoa Gonzáles Del Campo and Dr Brian Espey for all their guidance and assistance throughout my dissertation. Thank you for sharing your expertise, knowledge and materials to allow me to carry out this study. Thanks also to my fellow classmates and lecturers for making this year unforgettable.
iii ABSTRACT
The increasing trend of artificial light in the night sky is of global concern. The ecological impacts of light pollution in Ireland has not yet been established. Previous studies have been carried out in rural Ireland in County Mayo, however studies have not been carried out in urban Ireland. Increases in artificial light in the night sky can have both ecological and human impacts. Artificial light levels can alter a number of behaviours in humans, flora and fauna. Disruptions can occur to the circadian rhythm, migration patterns, orientation ability and predator-prey relationships of species. Light level trends in Ireland were determined through the use of satellite imagery of the night sky provided by the Defence Meteorological Satellite Program’s Operational Linescan System (DMSP/OLS). Imagery for the year 1992 which was the first year of the programme was compared to 2013 imagery showing the most recent night sky satellite imagery. A significant increase in light levels was recorded across Ireland over the two decades. Further analysis of the phases of the “Celtic Tiger” (2001-pre “Celtic Tiger”, 2007- “Celtic Tiger” and 2013- post “Celtic Tiger”) showed a great increase in light levels leading up to the year 2007 when construction in Ireland was carried out intensively. Examination of the light levels in Ireland was carried out with the use of Sky Quality Meters (SQM) at three locations to determine the levels of light in the night sky of Dublin. A number of selected species were chosen for this study to identify any possible ecological impact to these species as a results of artificial light pollution. High levels of light in the night sky was recorded at all three light meter locations. The levels of light recorded were well out of the range provided by the International Dark-Sky Association (IDA) for the designation of these areas as dark sky reserves/parks. These high levels are a risk to all the protected species selected in this study. These risks include disruption to migration patterns, reproduction alterations and some species listed may be impacted indirectly. To further develop knowledge of the ecological impacts of light further studies like this are required in Ireland to develop a national light pollution database that will assist in tackling both the increasing level and concerns regarding light pollution. Without establishing a knowledge of the ecological impacts of light pollution appropriate conservation measures cannot be put in place.
KEYWORDS
iv
LIST OF FIGURES PAGE
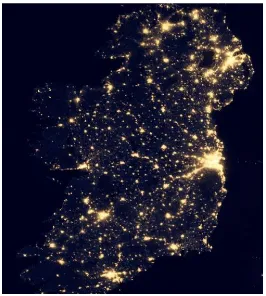
Figure 1. Imagery from the International Space Station displaying the hotspots 8 of Light Pollution in Ireland.
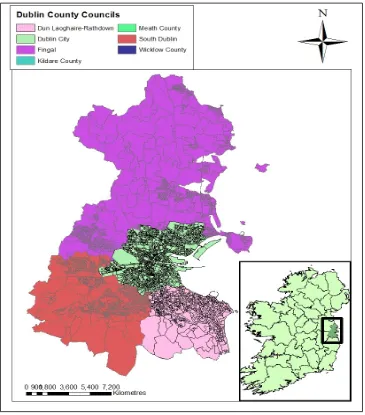
Figure 2. The division of the Dublin and City County Councils of Dublin. 9 Figure 3. The locations of the three study sites- Bull Island, Trinity College Dublin 12
and Killiney Hill.
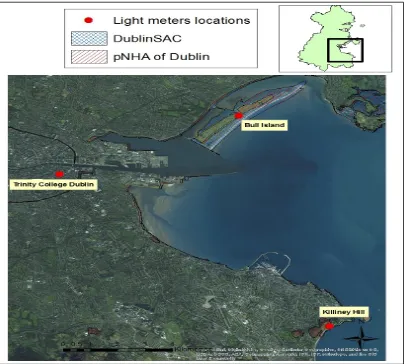
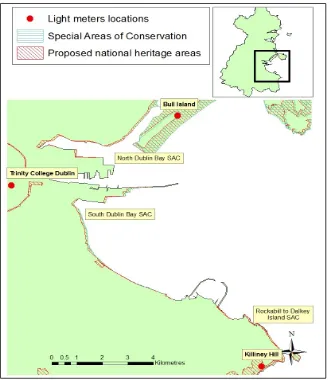
Figure 4. The location of the three light meters within the special areas of conservation 18 (SAC) and the proposed National Heritage Areas (pNHA) displayed.
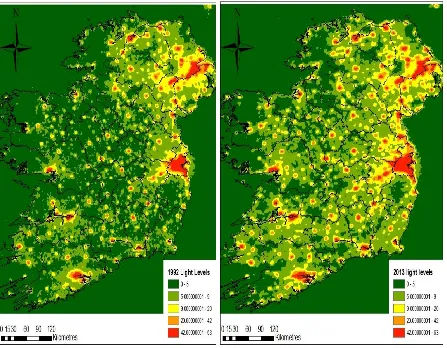
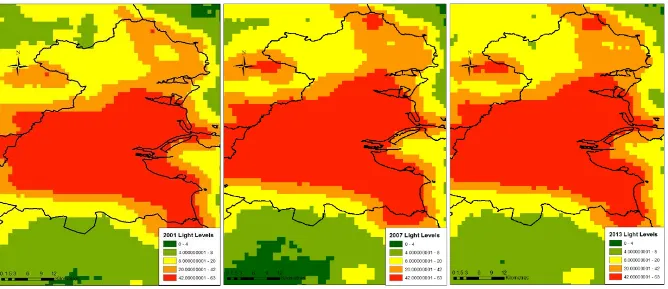
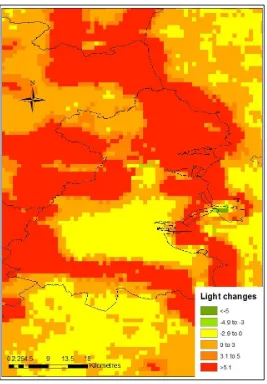
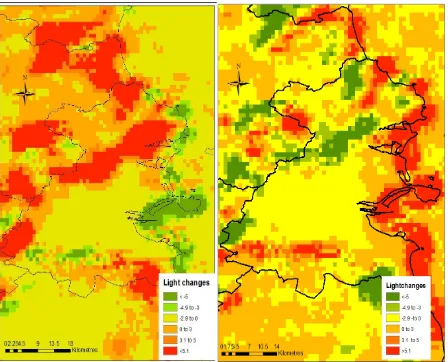
Figure 5. The changes in light trends in Ireland between 1992 and 2013. 22 Figure 6. The changes in light trends in Ireland in 2001, 2007 and 2013. 23 Figure 7. The changes in brightness in Dublin between 1992 and 2013. 24 Figure 8. The changes in brightness in Dublin between 2001-2007 and 2007-2013. 25
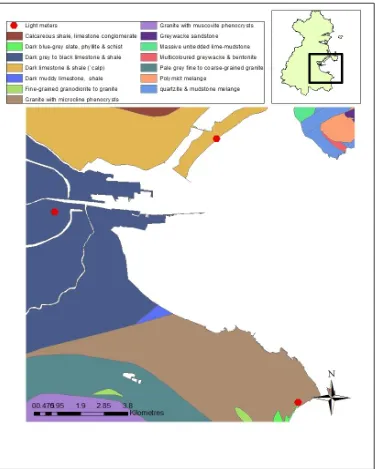
Figure 9. The bedrock of study sites in Dublin. 26
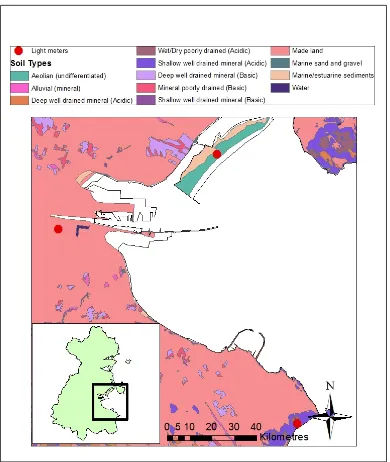
Figure 10. The soil types of study sites in Dublin. 27
Figure 11. The Land uses of the three study sites and the surrounding areas in Dublin. 28 Figure 12. The surrounding habitats of the light meter located on Bull Island. 30 Figure 13. The surrounding habitats of the light meter located in Trinity College Dublin. 31 Figure 14. The surrounding habitats of the light meter located on Killiney Hill. 32 Table 1. The list of the selected species of this study. 34 Figure 15. Boxplot of the night sky measurements for the 26th of March 2016 for 36
all three study sites- Bull Island, Trinity College Dublin and Killiney Hill.
Figure 16. Scatterplot of the night sky measurements for the 26th of March 2016 37
for all three study sites- Bull Island, Trinity College Dublin and Killiney Hill.
Figure 17. Light readings for Trinity College Dublin from February 8th until the 15th 2016. 39
v Figure 19. Light readings for Trinity College Dublin from February 22nd until the 29th 2016. 40
Figure 20. Light readings for Bull Island from February 22nd until the 29th 2016. 40
1 1. INTRODUCTION
1.1.Light pollution.
1.1.1. What is Light Pollution?
The night sky has been greatly altered by humans through the introduction of artificial lighting during hours of darkness. The night sky’s characteristics have been greatly modified over the last one hundred years (Longcore et al. 2007). It is estimated that the night skies of a large number of cities across the world are one hundred times brighter than the natural light levels which normally occur at night (IDA- International Dark Sky Association). The increase in artificial brightness in the night sky results in the stars and natural light emitters becoming harder to view with the naked eye. This excess artificial light is known as light pollution. Light pollution is believed to have widespread consequences for humans, wildlife species both animals and plants and to the global climate. Approximately 30% of all vertebrates and 60% of invertebrates are nocturnal, an alteration in the light regime will therefore have a vast and wide impact on biodiversity (Holker et al. 2010, Thomas et al. 2016). The International Dark-Sky Association (IDA) defines light pollution as “the inappropriate or excessive use of artificial light” (http://darksky.org/light-pollution/). Other organisations such as the National Lighting Product Information Programme (NLPIP) further explains light pollution as “an unwanted consequence of outdoor lighting and includes such effects as sky glow, light trespass, and glare” (National Lighting Product Information Programme (NLPIP) (2003) Lighting Answers. Rensselaer Polytechnic Institute. Vol 7, Iss 2. pp 2). It is essentially light which is wasted and has no function. Light pollution occurs as a result of the increased use of artificial light sources utilised by civilisation globally. The increased use of artificial light in both interior and exterior lighting of households, commercial units, street lighting, the lighting of venues and stadiums, factories and offices has led to increases in artificial light pollution. Concerns over light pollution in terms of the changes in the characteristics of the night sky were first voiced by astronomers (Riegel 1973). Recently, the impacts of light pollution on animal and plant species has been the focus of many studies (Longcore et al. 2007, Davies et al. 2013, Rodríguez et al. 2015, Bliss-Ketchum et al. 2016). The United Nations (UN) announced 2015 as the International
“Year of the Light”, while its scope was on light science and its uses, light pollution was also discussed (Bruning et al. 2016).
Light pollution consists of a number of components. These components include:
Glare,
Sky glow,
Light trespass,
2 These components of light pollution greatly differ from each other, Mc Colgan 2003 describes in detail the characteristics of all these components.
Glare: Artificial lighting may cause glare, this is as a result of the incorrect use and installation of
artificial lighting. Glare can reduce visibility or cause discomfort to view an area. This can affect both humans and animals. The development of equipment which produces less light may reduce glare (Mc Colgan 2003).
Sky Glow: The occurrence of sky glow is present naturally and as a result of artificial light. Sky glow is
present through natural sources such as the reflection of sunlight from the moon and earth’s surfaces, as well as the reflection of sunlight off interplanetary dust, the light glow in the upper atmosphere, the scattering of light from starlight through the atmosphere and natural lighting from distant and faint stars and nebulae. Sky glow is also as a result of human introduction of artificial lighting. As a result of this artificial lighting the level of brightness in the night sky has increased. This light enters the night sky by the direct emitting of light to the sky or by the reflection of downward light off the ground into the atmosphere through the scattering by particles in the atmosphere such as gas and dust (Mc Colgan 2003). Sky glow increases during periods of bad weather when there are more particles present in the atmosphere causing the sky glow to be more evident and obvious (Kyba et al., 2011). It is visible as an orange glow over an urban area and can be visible from up to 200km away (Duffek 2009).
Light Trespass: Light trespassing is as a result of artificial light where the installation of lighting devices
are reaching unwanted targets. An example of this is the installation of lighting to illuminate a pathway through a wood, the surrounding woodlands will receive artificial light as a result of this installation. This can have great impacts on the species which utilise this woodland habitat. The correct installation of lighting devices by focusing the light on the intended target will greatly reduce light trespassing. Light trespass also impacts humans as street lighting will enter the windows of households which may lead to effects on sleep patterns (Mc Colgan 2003).
Clutter: The excessive grouping of lighting equipment leads to the clutter of artificial lighting.
Cluttering of lighting results in high concentrations of artificial lighting to an area. This can cause confusion to many species and can result is disorientation in these species. Clutter lighting is common in urban areas (Mc Colgan 2003).
1.1.2. The Current Trends in Light Pollution
3 rate of 6% annually (Khorram et al. 2014). This is identified as a high threat to flora and fauna, light pollution being ranked in the top ten emerging issues in biodiversity (Holker et al. 2010, Stone et al. 2012, Newman et al. 2015). At the current rate of use, the generation of artificial light requires 19% of the global electricity, which generates approximately 1900 Mt. of carbon dioxide annually. With the increase of global population, this figure may increase considerably as a result of the increase in supply and demand (Raap et al. 2015). In 2001, it was found that 19% of the world’s surface area is receiving artificial light intensities above the recommended pollution level threshold (Bennie et al. 2014). When countries and continents are examined separately, these figures further increase. For example, it is believed that 23% of the land surface of the USA receives a level of artificial light intensity over the threshold, while 37% of Europe receives artificial light over the set threshold (Cinzano et al. 2001, Gaston et al. 2013). An estimated two thirds of the world’s human population are living in areas with a polluted sky as a result of artificial light (Rodríguez et al. 2015).
1.2. The impacts of Light Pollution
1.2.1. Impacts on Fauna
The changes in the number of hours of brightness impacts a vast number of species including humans. The extent of these impacts vary from species to species. From previous studies it has been found that artificial lighting affects species in a number of different ways, including alterations to their foraging behaviours, reproduction, communication, orientation and prey/predator relationships (Longcore et al. 2004, Kempenaers et al. 2010, Rotics et al. 2011). All these impacts can lead to stress on a species
and may result in population declines in an area of high light pollution. A number of studies have focused on the impacts of light pollution on the circadian rhythm of species including humans. Throughout many species, the photoperiod plays a huge role in their daily behaviours. The length of the day and night influences the period in which species are active or resting (Royal Commission on Environmental Pollution 2009). Light pollution alterations to this rhythm may results in impacts like those discussed above (Rich et al. 2006, Royal Commission 2009). Studies have found that light which is blue-rich has great impacts on the circadian rhythms of many mammal species (Berson et al. 2002). A vast range of animals are impacted by light pollution with various different effects being reported as further discussed below. The impacts found are not exclusive to one habitat, with impacts being recorded in both marine and terrestrial habitats.
1.2.2. Effects on Circadian Rhythms of Species
4 food preference is at its highest supply (Jones et al. 1994, Downs et al. 2003). These changes in behaviour may result in weak and nutrient-deficient bats, causing problems in the success and the recruitment of the population. Artificial light sources may indirectly affect a species; for example insects, may be attracted to these light sources. As insects are the main component of the diet of many species they will be influenced to follow the insects to the area were the light source is located (Eisenbeis 2006). A study by Bruning et al. (2015) discussed the impacts of artificial light on the production of melatonin in fish species. Melatonin is essential in controlling the day and night sleep patterns of a species. Melatonin production is greatly reduced during hours of brightness while optimal production occurs during darkness. Extra hours of brightness in the night reduces melatonin production levels and greatly impacts the fish species. This paper also discusses the importance of light in the timing of reproduction of fish, reproduction readiness and the production of the sex steroid which is triggered by the gonadotropins, luteinising hormone and stimulation of the follicle hormone. The changes of the melatonin levels in a fish species can hinder and prevent gonadotropin production. It has also been found that sexual maturity can be delayed or prevented due to the suppression of gonadotropin (Khan et al. 1996, Amano et al. 2000, Chattoraj et al. 2005, Bhattacharya et al. 2007, Sebert et al. 2008, Carnevali et al. 2011). This will greatly affect the spawning success and recruitment of fish species, and spawning outside of the regular season may also occur.
1.2.3. Effects on Migration and Orientation
5 (UNEP2008). This causes disorientation of hatchling and female turtles and has been identified to have led to thousands of deaths of hatchlings in Florida as they follow the artificial light away from the ocean (Salmon 2003). Disorientation can cause stress to the female turtles and can lead to exhaustion due to unnecessary excessive travelling along the beach.
1.2.4. The effects on predator-prey relationships
The changes in the hours of brightness may affect the lifestyle traits of many species. The success of many habitats is aided by the division of diurnal, nocturnal and crepuscular species. This prevents over competition for shelter, space and food. The increased brightness may disrupt these patterns and may cause ecosystem disturbance (Kronfeld-Schor et al. 2003, Gutman et al. 2005). During active hours, these species will prey on certain other species, however if the hours of activity are altered this relationship may change and predators may prey on species which they would normally not consume. This may result in ecosystem imbalance as a result of the over consumption of one species. During hours of brightness preyed upon species are most susceptible to predation, as a response to this they may reduce the hours in which they are active during the day causing a reduction in prey availability (Gaston et al. 2013). These behavioural changes are believed to be costly in terms of energy output (Smit et al. 2011). It has been reported that prey species will forage in close proximity to light sources as their food source species are attracted to the light and congregate around it. This is evident in orb-web spiders Larinioides sclopelarius which build their orb-webs close to light sources as high numbers of insects are found in these areas. This behaviour is natural, however with artificial light sources increasing the effect is exaggerated, spiders are encouraged to these areas to build webs and to forage (Heiling 1999).
1.2.5. Effects on Birds
6 disruption of their activities resulting in increased mortality (Snyder et al. 2013). The excessive use of artificial light has great impacts on a number of song birds. Song is normally heard during hours of brightness, sun rise and sunset, however when artificial light extends the hours of brightness the birds continue to sing. This can result in sleep loss for the birds (Kempenaers et al. 2010, Dominoni et al. 2013a, Dominoni et al. 2013b, Schlict et al. 2014, Da Silva et al. 2014). From previous studies carried out examining the interaction between bird species migration and light pollution, it has been found that management is required in terms of the spectral composition of light (Poot et al. 2008). The migration direction of the European robin Erithacus rubecula is known to be determined by the use of blue and green photoreceptors. The altering of the natural light in the atmosphere may hinder the migration path of this species (Wiltschko et al. 2007). In contrast, the migration of silvereyes Zosterops l. lateralis is greatly disrupted by red light (Wiltschko et al. 1993).
1.2.6. Effects on Flora
The exploration of the impact of light pollution on plant species has yet to be carried out to the same extent as those studies carried out on vertebrates and invertebrates. Photosynthesis is affected by the length of brightness in the day. Photosynthesis is at its peak during hours of brightness and is reduced during hours of darkness. Although this affect is believed to be relatively low, a study by Raven et al. (2006) found that photosynthesis during hours of brightness was increased in the presence of sky glow and moonlight. The reduction of hours of brightness has been hypothesised to affect the recovery and repair time which is essential for many species. The reduction of hours of brightness can be used to explain the ozone injury in plants found in areas of high altitudes (Vollsnes et al. 2009). This is supported by the relationship between artificial light and ozone pollution (Cinzano et al. 2001). As with animals, the extension of the photoperiod will reduce the limitation on growth and on the reproductive processes of plant and tree species. This was the case in the study carried out by Bennie et al. (2015) where it was found that artificial lighting influenced the growth and the reproductive
7 the 1960s with the introduction and installation of high pressure sodium (HPS) lamps. These lamps emit both red and infrared spectral light of a high intensity.
1.3. Light Pollution in Ireland
1.3.1. Current Status of Light Pollution in Ireland
8 Figure 1. Imagery from the International Space Station displaying the hotspots of Light Pollution in Ireland. High light levels can be seen in the capital city of Dublin when compared to rural regions of Ireland (Source: www.globeatnight.org).
1.3.2. Measures to Eradicate Light Pollution
9 the light will be reduced. It has been identified that blue light is more damaging and has the potential to cause greater impacts (Gaston et al. 2012).
1.4. Dublin Study Sites (Bull Island, Trinity College Dublin and Killiney Hill)
1.4.1. Study Site Locations and Background
[image:18.595.116.481.263.678.2]This study is focused on highly populated urban areas of Dublin. The land use and land types at the study sites (i.e.- Bull Island, Trinity College Dublin and Killiney Hill) vary greatly from each other. These three sites were selected for a number of reasons. Due to the high population density of Dublin there are a number of City and County Council Divisions in the County of Dublin Figure 2.
10 1.4.2. Bull Island
Bull Island is situated in the northwest section of Dublin Bay on the East coast of Ireland. Dublin Bay is located in the heart of urban Dublin and receives a lot of shipping traffic. The Island was formed as a result of deposition of sand along the Bull Wall, this formation occurred within a 200 year period. Bull Island has been a designated Nature Reserve for a number of years, in the 1930’s it was first designated as a Bird Sanctuary. The Island was then recognised as a UNESCO Biosphere Reserve in 1981 and was then further upgraded as a Nature Reserve in 1988. Bull Island is widely used by tourists accessing Dollymount Beach and its golf courses and as a popular walking site. It is managed and categorised as a public park by Dublin City Council. A number of rare and sensitive habitats are found on the island making it an important area were conservation is required. Much of the biodiversity of the island is protected under Annexes I and II of the EU Habitats Directive (Council Directive 92/43/EEC of 21 May 1992 on the conservation of natural habitats and of wild fauna and flora). Bull Island was selected as a study site as it is located on the outskirts of the city centre and provides information on light pollution in suburban Dublin (Figure 3).
1.4.3. Killiney Hill
11 1.4.4. Trinity College Dublin
Trinity College Dublin is located in the heart of Dublin city centre, it is located on the south side of the City. The University was first opened in the 1500s and since has expanded greatly in size and in student population. The University provides many functions primarily education and research with approximately 16,000 students carrying out their studies on the campus. Trinity College is a very popular tourist attraction with high levels of tourists visiting the Book of Kells annually. The expansion of many of the faculty buildings has reduced the greenery within the University grounds. The growth of the student population in the University has led to the development of off-site buildings to facilitate the demand. However, green areas can still be seen throughout the college grounds used for recreation, research and landscaping. The areas surrounding Trinity College Dublin receive high volumes of both vehicular and pedestrian traffic. Tall buildings surround the grounds of the University, these building functioning as offices, retail establishments and accommodation. Historical buildings and public parks are also found in close proximity to Trinity College Dublin. Including Trinity College Dublin as a study site in this research will provide information on intense urban light pollution as this site is located in the city centre.
12 Figure 3. The locations of the three study sites- Bull Island, Trinity College Dublin and Killiney Hill. 1.4.5. Previous Studies
Previous studies have focused on the impact of light pollution on human health (e.g. Griefahm et al. 2006, Kantermann et al. 2009) and on the impact of light pollution on terrestrial animal species (e.g. Davies et al. 2012, Kempenaers et al. 2010, Lewanzik et al. 2014). In recent years, an increased number of studies have examined the impacts of light pollution on aquatic species with a focus on species used in aquaculture (Yeh et al. 2014, Boeuf et al. 1999) Artificial light in aquaculture was examined in terms of improving the growth of the species in question, the control of reproductive periods and reducing stress on fish. Raap et al. (2015) reports that while in depth laboratory studies of the impacts on organisms due to artificial lighting have been carried out there are only a few field studies on free-living animals which examine the experimental manipulations of light conditions in the wild.
13 many studies. This research should be carried out to further current knowledge. Studies on the composition of light should be examined, as species will be impacted by different spectra and characteristics of light. For example, as previously discussed, sea turtle orientation is greatly dependant on the natural light of the moon. Therefore, the introduction of white artificial light into the environment causes disorientation. Nevertheless it has been found that sea turtles are not sensitive to red light (Salmon et al. 1995). This knowledge is very useful in preventing harm and protecting sea turtles. Species impacts vary depending on the spectrum of light they are sensitive to, studying species to determine what spectrum is most harmful to them will be of great benefit for the development of management plans.
A study was previously undertaken to look at the ecological impacts of light pollution in rural Ireland, the study site of the Owenduff/Nephin Beg Complex SAC, SPA and pNHA was selected. This site is found on the west coast of Ireland in County Mayo. A number of protected species are found at this study site. This study found pristine night skies at three of the study sites, while the fourth study site of Ballycroy had localised light pollution. This localised light pollution has the potential to impact the sensitive species of the area. This study provides evidence that light pollution is not only a concern in relation to cities but also to rural Ireland. Further studies, like this study detailed, are required in Ireland to identify light pollution hotspots and the species which are being impacted by this form of pollution. It is possible that a number of species which are being effected by light pollution are protected under Irish legislation, therefore the problem of light pollution must be eradicated or reduced.
1.5. Project Aims and Research Questions
This research work will focus on answering the research question: what are the ecological impacts of light pollution in highly populated areas of Ireland such as Dublin city. The objectives and tasks to achieve the overall goal above are as follows:
Objective 1:
Gain a knowledge and identify the effects of light pollution on a number of species, including those considered to be light-sensitive.
14
o were located will be developed identifying sites which may be vulnerable and sensitive to light pollution.
o The distribution of sensitive species at the study sites will be identified and mapped through Geographic Information System (GIS) software with data from the National Biodiversity Data Centre (NBDC).
o Light data provided by Dr Brian Espey of the Department of Physics Trinity College Dublin will be analysed to determine the light levels at the three monitoring sites. When the light levels are determined the impacts on the sensitive species found in the areas of the study site can be determined by reviewing previous literature on these species.
Objective 2:
To study the changes of light pollution in Ireland and to examine the growing trends in light pollution.
o The changes in light levels in Ireland, with a focus on Dublin, over the last two decades will be examined to identify the full extent of the increase of light levels. Light maps were acquired from the National Centres for Environmental Information (NCEI) and the National Oceanic and Atmospheric Administration (NOAA), with data provided by the Defence Meteorological Satellite Program’s Operational Linescan System (DMSP/OLS). These data are freely available at
http://maps.ngdc.noaa.gov/viewers/dmsp_gcv4/and
http://ngdc.noaa.gov/eog/dmsp/downloadV4composites.html
o The light level data will be used to identify areas which are at high risk of excessive light by comparing the increases of levels over a number of selected years. The areas of the three study sites of Dublin will be compared to determine the extent of light level changes.
Objective 3:
The findings of this study will be compared to a previous study carried out in rural Ireland last year. This will assist in the development of a country-wide database on the effects of light pollution on sensitive species.
15 2. RESEARCH METHODS
2.1. Habitat Profile
2.1.1. Pre-habitat Surveys
Literature on each of the study sites was gathered and reviewed to develop an insight and knowledge of these sites. Data on the species present at the study site areas were retrieved from NPWS and the NBDC. Previous studies carried out at the sites were gathered to further understand the importance of the locations as well as identifying previous issues which have affected the area. Using the World Imagery layer available in AcrGIS 10.3.1 the locations of the light metres were located and the surrounding features and habitats were displayed and examined to allow for digitisation. ArcGIS 10.3.1 was selected for this study as this software assisted in spatial analysis and has a range of tools to aid in the representation of the data of this study. Contact was also made with a number of organisations, such as Dublin City Council, NPWS, NBDC and Dún Laoghaire-Rathdown County Council, to obtain an insight into the survey sites and for details on the species present, however this was mainly unsuccessful. Obtaining data from these organisations was unsuccessful for a number of reasons such as the organisations being unable to release sensitive data, a lack of staff to reply to emails and data request forms or the organisations did not have the data required.
With the data provided by the NPWS and the NBDC a profile of the study sites was developed, this included existing habitats and species, land uses and the soil and bedrock types. Site visits were undertaken to further gather a knowledge of these habitats and to determine where the light meters are located to allow for habitat verification. These site visits allowed for any issues encountered during the pre-survey practises to be overcome and for intense light sources to be identified.
2.1.2. Study Site Visits
Site visits were carried out over a number of days. Site visits to Bull Island and Trinity College Dublin were carried out on the 6th of July 2016, while a site visit to Killiney Hill was carried out on the 9th of
July 2016 with a follow up visit carried out on the 11th of July 2016. The study site at Killiney had a
16 a high number of species present in this area and it is a popular attraction. The sites of Bull Island, Trinity College Dublin and Killiney Hill are all open to the public therefore permission was not required to visit these sites. All the sites were accessed in a safe manner and no risk was involved in reaching the sites. The purpose of the site visits was to verify the habitat classification determined during the pre-survey tasks and to identify any features or issues in the areas which were not obvious or visible when mapping dominant habitats. During the site visits to all the selected study sites (i.e. Bull Island, Killiney Hill and Trinity College Dublin) the areas surrounding the location of the light meters were surveyed on foot to identify any features and habitats that were missed or were not visible on the satellite imagery. The dominant habitats of the area were recorded and small patched habitats were noted. Any light sources surrounding the location of the light meters were also identified and recorded. Site visits assisted in the development of profiles of the location of the light meters as well as identifying any disturbances to any of the three sites. After the site visits a number of corrections were made to the habitat maps.
2.2. Collection and Analysis
2.2.1. Light Levels Analysis
Two aspects of light levels were analysed. The first involved the changes of light levels in Ireland over a 20 year period. The data provided by the Defence Meteorological Satellite Program (DMSP) were used during this analysis. Data from 1992 was first examined as it is the earliest light level records provided by DMSP. Further data from 2001, 2007 and 2013 were examined. 2001 displays data showing light levels previous to the “Celtic Tiger” era when construction was at a low level. Light levels from 2007 were selected as these data were collected during the boom years of the “Celtic Tiger” when Ireland, especially Dublin, became very developed and populated. The most recent data provided by the DMSP is for the year 2013, therefore these data were included in this study, and this provides information on the most recent update status of light pollution in Ireland.
Data on the light measurements of the three light meter locations of Bull Island, Trinity College Dublin and Killiney Hill were provided by Dr Brian Espey of the Physics Department of Trinity College Dublin. Two separate aspects of analysis were carried out; the analysis was separated into two as data for Killiney Hill did not contain as much information in comparison to the light level datasets for Bull Island and Trinity College Dublin. Analysis of light levels in Bull Island, Trinity College Dublin and Killiney Hill for the 26th of March 2016 were examined and the results for each study site were compared to each
other (Figure 4). Data for the 26th of March were selected as it was the only date in which data was
17 8thto the 15th of February 2016 were analysed for both these sites to show the changes in light levels
over this seven day period between the study sites. The new moon phase was selected in this study as during the new moon light reflected by the moon is at its lowest level, therefore the levels of artificial light are evident in the readings from the light meter on site. Further analysis was carried out on data collected during the full moon phase from the 22nd to the 29th of February 2016 for both Bull
Island and Trinity College Dublin, to again examine the changes in light levels and to compare the two sites to each other. Data collected during the full moon phase provides information on the levels of artificial light pollution at night combined with the high levels of light reflected by the moon.
2.2.2. Study Site Characteristics and Habitats Data/information Collection
Further spatial analysis allowed for the over-lay of a number of datasets to develop study site profiles. Datasets such as predetermined sensitive species present in the areas, the habitat types of the sites, the bedrock of Dublin, the soil types of the study sites and the waterbodies of the area. Habitat profiles for each of the selected sites were developed based on a compilation of data and information. Habitat datasets were freely downloaded from the (NPWS) website. Further information was gathered from an officer of NPWS, greatest detail was provided on the study site of Bull Island. Information on Killiney Hill habitats was obtained from the information provided in the “Killiney Hill: Biodiversity Education Programme: An action of Dún Laoghaire-Rathdown Biodiversity Plan 2009-2013” (Irish Wildlife Trust 2009). Data relating to designation classifications were also gathered from the National Parks and Wildlife Services, these classification include Special Areas of Conservation (SAC), Special Areas of Protection (SPA), National Heritage Areas (NHA) and proposed National Heritage Areas (pNHA). Land cover, lakes and river, soil types and the bedrock of Dublin datasets were all downloaded from the Geological Survey of Ireland (GIS) and the Environmental Protection Agency (EPA). The County Council divisions of Dublin were provided by Geofabrick. As a result of the high population density of Dublin the county has a number of City and County Council divisions. The Councils of the study site and the surrounding areas include Fingal, Dún Laoghaire-Rathdown, Dublin City and South Dublin County Councils. A species list was developed based on information from the literature on species sensitive to light pollution and information provided by the NPWS officer on the sensitive species present at the three research sites. All the species selected for the study are all protected under legislation both on a National or International level. Further data on the location of the sensitive species were downloaded from the NBDC. Data from the NBDC were provided at various resolutions these include 10km2, 2km2, 1km2 and 100m2 scales. Species data to a scale of 1km2 were selected for all the chosen
species as it represented the species distribution at the study sites and the surrounding areas appropriately. Data to a scale of 1km2 were available for all the species selected in this study. Species
18 study are both sensitive and protected, data at this resolution was not available for all the selected species therefore it was omitted. Species represented at a scale of 2km2 were omitted from this study
[image:27.595.134.464.138.518.2]as the 1km2 represented the species appropriately to a finer scale.
Figure 4. The three comparative study sites displaying the location of the light meters at these sites. The Special Areas of Conservation (SAC) and the proposed National Heritage Areas (pNHA) are also displayed.
2.3. GIS Analysis
2.3.1. Light Level Mapping
19 intensity levels of the area of focus with digital numbers (DN) on a scale of 0 (low light levels) to 63 (high light levels). All images of the different light levels in Ireland for the selected study years of 1992, 2001, 2007 and 2013 were set under the exact same range to allow a comparison between the images to identify an increase or decrease in the light levels over the selected years of this study. Determining the changes in light levels over the study periods was carried by taking the DN counts for each year away from each successive year to identify the increases or decreases in the light levels between the periods. Comparison of the light levels was carried out between 2001 and 2007, between 2007 and 2013, and between 1992 (the earliest light record by the DMSP) and 2013 (the most recent light level records provided by the DMSP). The comparison of these images will show the changes of light levels in Dublin over three equal time periods (2001, 2007 and 2013) as well as showing the changes of light levels in Dublin from the first record (1992) up to the most recent recording (2013). These light level maps were then further referenced to aerial imagery of Dublin to identify the features and buildings which emit high levels of light.
2.3.2. Study site characteristics and habitat mapping
The characteristics of the study sites were developed through mapping the various datasets as previously discussed during data collection. Shapefiles detailing the underlying bedrock and soil types of Dublin were provided by the GSI and the National Soils Database were provided by the EPA. Unlike many counties of Ireland Dublin has a number of City and County Councils dedicated to the county due to the high population density. Datasets for the County Councils boundaries were downloaded from Geofabrick and were mapped to identify the County Council designated to each study site. Each designated Council has various biodiversity plans allocated to the relevant district and therefore the efforts made for the protection of biodiversity may vary between these Councils. Data displaying the land uses of Dublin (i.e. CORINE (Co-Ordinated Information on the Environment) Landcover 2012) were downloaded from the EPA, CORINE. Land use data from CORINE Landcover 2006 was also mapped to identify any changes of the land uses in Dublin and in doing so explore if these changes may relate to variation in the light levels of Dublin. The area of the various different land use types were calculated and compared between 2006 and 2012 to identify the scale of the increase or decrease of the land use type. The locations of the study sites were displayed in each of these characteristic maps to show and develop the profile of the three sites.
2.3.3. Habitat and Species Maps for the Light Meter Locations
20 The maps on Killiney Hill habitats from the information sourced (Irish Wildlife Trust 2009) were digitised to ArcGIS by creating new feature classes and manually digitising habitat type polygons to fill in the missing habitat information. Indicative habitats were also mapped by examining aerial photographs and as previously discussed manually digitising these habitats by creating feature classes. These indicative habitats were then verified through site visits. Much of the land area of Dublin has been urbanised and this fact was detailed in the habitat maps, this is especially the case at the study site of Trinity College Dublin. The selected species for this study were mapped from the data provided by the NBDC, this was done effectively through the use of the ArcGIS plugin GeoWizard which produced grid squares at a predetermined square size, which allowed for the species occurrence data to be digitised in the same location as that on the same location on the maps provided by the NBDC. All species were mapped to a 1km2 scale. The location of the light meters were represented on these
species maps to show the locations of the species in relation to the light meters. Variations between the species present at the different light meter locations were displayed visually.
2.4. Light Meter Data Analysis
2.4.1. Data Analysis
Light meter data for the three study sites (i.e. - Bull Island, Trinity College Dublin and Killiney Hill) recorded the Sky Quality Meter (SQMs) level at each site. The SQM value provides information on the light intensity at the study sites, it is the measure of light intensity at the study sites recorded in square arcseconds (Kyba et al. 2011). A vast amount of data were collected from the light meters of Trinity College Dublin and Bull Island, while light data for Killiney Hill were considerably less. Data were only collected on one day, 26th of March in Killiney Hill. Unlike the sites of Bull Island and Trinity College
Dublin, the site at Killiney Hill was not monitored by an automated light meter. Therefore light levels were recorded using a manual light meter over the course of one day. An automated light metre would allow for monitoring over a longer duration. Data were selected for the same time for the other sites of Trinity College Dublin and Bull Island to allow comparison between the research sites. Boxplots and scatterplots (Figure 15 and 16) were produced for the light levels of these locations to display the difference in the SQM at the three study sites. Further in-depth analysis was carried out between Bull Island and Trinity College Dublin. Data collected during the new moon (darkest moon phase) for the 8th to the 15th of February 2016 and data for the full moon (brightest moon phase) from the 22nd to
the 29th of February 2016 (leap year) were analysed and compared between the two sites. These
21 These two phases of the moon were graphed with the use of R 3.3.1, scatter plots were produced with the use of this software. This software allows for a wide range of statistical analysis and outputs high quality graphs. These scatterplots allow for trends to be identified when the moon is fully present and when the brightness of the moon is reduced.
3. RESULTS
3.1. Light Pollution Trends
3.1.1 Artificial Light Result
The light levels recorded for 1992, the first years of recording by Operational Linescan System (DMSP/OLS) and 2013, the most recent year of lighting recordings by DMSP/OLS are shown in Figure 5. Maps showing the levels of light in Ireland for 2001 (Pre-“Celtic Tiger” period), 2007 (“Celtic Tiger”) and 2013 (post “Celtic Tiger”/recession) are also detailed (Figure 6). All the light maps display the light levels on a scale of 0 to 63 DN, this range is represented on a green (low) increasing to a red (high) scale based on the digital number. Rural areas of little light pollution are represented as a green colour while areas of high light pollution such as urban areas are represented by a red colour, red is commonly surrounded by a yellow/orange colour representing the surrounding suburbs of these urban areas. Light maps from 1992 show light levels on a low to moderate level, levels of high light can be seen in the cities of Cork, Dublin and Belfast. The spread of light to the suburbs is on a much lower scale when compared to the map detailing the 2013 light levels where much of the high levels of light extends from Dublin to counties such as Meath and Kildare. An increase in levels of readings of 63 DN can also be seen in the 2013 light map, therefore there is an increase in red levels on Figure 6. While there is a reduction in green areas on the map.
22 Figure 5. The changes in light trends between 1992 (left) and 2013 (right) can be seen. Changes in the saturation of light is evident in 2013, where the spread and the saturation of light has increased.
3.1.2. Changes in Dublin Light Pollution Trends
24 Figure 7. The changes in brightness between 1992 (the first year of recording) and 2013 (the most recent year of recording) in Dublin County. The means of the two periods were compared to show the increase or decrease of light levels between the two periods.
25 Figure 8. The changes in brightness in Dublin between 2001-2007 (left) and 2007-2013 (right). The means of the two periods were compared to show the increase or decrease of light levels between the two periods.
3.2. Study Site Characteristics and Habitat Mapping Results
3.2.1. Bedrock and Soils of Dublin
26 Figure 9. The bedrock of the study sites in Dublin. The location of the three light meter are detailed. The bedrock of Dublin and the study areas is mainly composed of granite, various types of limestone and shale.
27 Hill has lithosols and regosols soils, described as a shallow well drained mineral soil derived from mainly non-calcareous parent materials.
Figure 10. The soil types of the study sites in Dublin. The location of the three light meters are detailed. The area of Dublin is found on land classified by the National Parks and Wildlife Services as made/ built land.
3.2.2. Land Uses of Dublin and the Three Study Sites
28 significant area of the land is classified as continuous urban fabric which is described by CORINE as land where by “most of the land is covered by structures and the transport network. Buildings, roads and artificially surfaced areas cover more than 80% of the total surface.” (CORINE. Part Two- Nomenclature: illustrations CORINE land cover. pp 101). The land uses between the three study sites vary from each other, Bull Island is widely used for sports and leisure as it incorporates Dollymount beach, Trinity College Dublin is classified with a land use of continuous urban fabric while Killiney Hill is categorised as discontinuous urban fabric. Comparison between the CORINE 2006 and the 2012 shows increases in both continuous and discontinuous urban fabric, this shows an increase in development over these years.
29 3.3. Light Meter Location Habitats
3.3.1. Habitat Mapping of Light Meter Locations- Bull Island, Trinity College Dublin and Killiney Hill
30 Figure 12. The surrounding habitats of the light meter location on Bull Island. The area is classified with fixed coastal sand dunes and non-saltmarsh habitats. Areas close to the light meter location are proposed National Heritage Areas (pNHA).
31 the various College buildings. The light meter for this site was located on the top of the Fitzgerald’s Building in Trinity College Dublin.
Figure 13. The surrounding habitats of the light meter location in Trinity College Dublin. The area is classified as continuous urban fabric and grasslands categorised by landscaping, recreation, research and urban green areas.
32 Figure 14. The surrounding habitats of the light meter location on Killiney Hill. The area is classified as a number of habitats these include scrub habitat, deciduous woodlands, European dry health and discontinuous urban fabric.
3.4. Species at Risk
3.4.1. Protected Species of the Study Site
34 SPECIES- COMMON NAME SCIENTIFIC NAME CONSERVATION ISSUES LEGISLATIVE PROTECTION MAXIMUM LIGHT LEVELS EXPOSED TO AT STUDY AREA
IMPACTS BASE ON LITERATURE
OTTER Lutra lutra Populations are stable in Ireland, however many European pollutions are threatened, declining, rare, or extinct.
EU Habitats Directive Annex 92/43 II & IV, Wildlife Act 1976/2000, Bern Convention Appendix III.
17.85 mag/arcsec2 Undetermined.
COMMON FROG Rana temporaria
Widespread throughout Ireland but vulnerable in Europe.
EU Habitats Directive Annex V, Wildlife Act.
17.85 mag/arcsec2 Possible disruption to
circadian rhythm.
RED SQUIRREL Sciurus vulgaris
Under pressure due the growth of the grey squirrel population.
Wildlife Act 1976/2000, Bern Convention Appendix III.
19.42 mag/arcsec2 Possible indirect
impacts.
BROWN LONG EARED BAT
Plecotus auritus
In decline due to habitat loss, poisoning and a reduction in food supply.
EU Habitats Directive Annex 92/43 IV, Wildlife Act 1976/2000, Bern Convention Appendix II.
19.42 mag/arcsec2 Discourage species
from area.
WHISKERED BAT Myotis mystacinus
In decline due to habitat lose, small litter’s leads to longer population recovery and food reduction.
EU Habitats Directive Annex 92/43 IV, Wildlife Act 1976/2000, Bern Convention Appendix II.
17.85 mag/arcsec2 Discourage species
from area.
NATTERERS BAT Myotis nattereri
One of the rarest bats in Ireland. Vulnerable as a result of habitat loss, reduction of food and poisoning.
EU Habitats Directive Annex 92/43 IV, Wildlife Act 1976/2000, Bern Convention Appendix II.
19.42 mag/arcsec2 Discourage species
from area.
GREY SEAL Halichoerus grypus
Populations previously declined due to hunting. Now under pressure due to disease, disturbance to habitat, illegal shooting and decreasing water quality.
EU Habitats Directive Annex 92/43 V, Wildlife Act 1976/2000, Bern Convention Appendix III.
19.42 mag/arcsec2 Possible indirect
impacts.
PINE MARTEN Martes martes Main threat is
accidently
poisoning. Impacted by habitat loss.
EU Habitats Directive Annex 92/43 II & V, Wildlife Act 1976/2000, Bern Convention Appendix III.
19.42 mag/arcsec2 Undetermined.
RAZORBILL Alca torda Amber-listed species. Breeding by the majority of the Irish population occurs at less than ten sites.
Wildlife Acts 1976/2000, Birds of Conservation Concern- Amber List.
35 Table 1. Details the selected species with information provided on the conservation issues of these species, the legislation which protects each species and the average light levels these species receive at the study site. The impacts of light pollution based on the literature is also detailed.
KINGFISHER Alcedo atthis Amber-listed species. European population accessed to be depleted.
Wildlife Acts, EU Birds Directive Annex I, Birds of Conservation Concern- Amber List.
18.61 mag/arcsec2 Changes to circadian
rhythm.
BADGER Meles meles Killed by human through badger baiting and
accidental road kills.
Wildlife Act 1976/2000, Bern Convention Appendix III.
19.42 mag/arcsec2 Possible impacts to
reproduction.
SAND TERN Sterna
sandvicensis
Amber-listed species. Breeding is localised. European population accessed to be depleted.
Wildlife Acts 1976/2000, EU Birds Directive Annex I, Birds of Conservation Concern- Amber List.
17.85 mag/arcsec2 Undetermined.
SHORT EARED OWL Asio flammeus Amber-listed
species. Breeding is localised. European population accessed to be depleted.
Wildlife Acts 1976/2000, EU Birds Directive Annex I, Birds of Conservation Concern- Amber List.
18.61 mag/arcsec2 Changes in
predator/prey relationship
RED KITE Milvus milvus Previously extinct in Ireland due to poisoning and habitat loss. Reintroduced to Ireland in 2007.
Wildlife Acts 1976/2000, Birds of Conservation Concern- Amber List.
19.42 mag/arcsec2 Undetermined.
PEREGRINE FALCON
Falco peregrinus
No longer in decline, previously
threatened due to chemicals reducing reproduction.
Wildlife Acts 1976/2000, EU Birds Directive 2009/147 EC Annex I.
19.42 mag/arcsec2 Early reproduction.
WIGEON Anas penelope Amber-listed species.
Wintering by the majority of the Irish population occurs at less than ten sites.
Wildlife Acts 1976/2000, EU Birds Directive Annex II & III, Birds of
Conservation Concern- Amber List.
18.61 mag/arcsec2 Changes to circadian
rhythm.
KESTREL Falco
tinnunculus
Amber-listed species. European population is in decline.
Wildlife Acts 1976/2000, Birds of Conservation Concern- Amber List.
18.61 mag/arcsec2 Undetermined.
MUTE SWAM Cygnus olor Amber-listed species.
Wintering of 20% of the European population occurs in Ireland.
Wildlife Acts 1976/2000, Birds of Conservation Concern- Amber List.
19.42 mag/arcsec2 Undetermined.
KEMPS LOGGERHEAD TURTLE Lepidochelys kempii Migrant species. Listed as
endangered by IUCN (International Union for Conservation of Nature) red list.
EU Habitats Directive 92/43 Annex IV, Wildlife Act 1976/2000.
18.61 mag/arcsec2 Impacts to migration
36 3.4.2. Light Meter Results
The light data collected by the light meters for the three study sites is displayed in Figures 15 and 16. As data at the light meter at Killiney Hill was only recorded on one day, the corresponding comparison data for the three sites for the 26th of March 2016 was analysed. The spread of the data shows that
[image:45.595.80.517.347.719.2]the light meter readings for both Killiney Hill and Bull Island have an equal spread of data with equal numbers above and below the median values showing a gradual increase of night sky darkness in the night. This displays decrease of light levels from daylight hours to night time hours. In contrast, the majority of data for Trinity College Dublin show the values of the light meter to fall below the median showing that the night’s sky does not become as dark in comparison to the other two study sites (Figure 15). This shows a greater intensity of artificial light at night at the light meter location of Trinity College in comparison to Killiney Hill and Bull Island. Light levels of brightness are constant at Trinity College Dublin as a result. This indicates that a high number of artificial lighting sources are installed at this site.
Figure 15. Boxplot of the night sky measurements for the 26th of March 2016 for all three study sites-
Bull Island, Trinity College Dublin and Killiney Hill.
Bull Island Killiney Hill TCD
37 The light meters provide evidence that the study site of Killiney Hill has the darkest night skies of all the three study sites with an average reading of 19.42 mag/arcsec2. The study site of Bull Island was
in the midrange with an average of 18.61 mag/arcsec2 in comparison to the other two sites. While
Trinity College Dublin had the brightest sky at night with an average reading of 17.85 mag/arcsec2
showing the highest levels of light pollution out of all three sites. The International Dark-Sky Association (IDA) has developed a three category system for consideration when designating dark sky reserves. These categories indicate the quality of the skies of the reserve based on the mag/arcsec2.
These categories are as follows: Gold (>21.75 mag/arcsec2), Silver (21.74-21.00 mag/arcsec2) and
finally Bronze (20.99- 20.00 mag/arcsec2). A dark sky reserve categorised as Gold would be a dark night
[image:46.595.103.494.381.692.2]sky with little light pollution. When the values of these three dark sky reserve categories are compared to the values collected at the three study sites it is evident that all three sites are not suitable to be considered as a dark sky reserve as they receive an excessive amount of artificial light preventing dark skies classification. The light level values of all three research sites significantly fall below these IDA categories this shows the pure quality of the skies and the high levels of artificial light in the night sky.
Figure 16. Scatterplot of the night sky measurements for the 26th of March 2016 for all three study
sites- Bull Island, Trinity College Dublin and Killiney Hill. Killiney Hill shows areas of dark night skies, while Trinity College Dublin had the brightest sky at night.
18.0 18.5 19.0 19.5
5 10 15
Light levels (Mag/arcsec^2)
D
at
e
&
T
ime
(U
ni
ve
rsa
l T
ime
)
38 Light meter data were collected for Bull Island and Trinity College Dublin over a long period of time when compared to the dataset collected from Killiney Hill where light levels were only recorded on the 26th of March. Further analysis was carried out on these larger datasets. Relevant data were
selected from the datasets for both Bull Island and Trinity College Dublin. Data from February 8th until
the 15th February 2016 during a period of a new moon were selected as these were recorded during a
phase when illumination reflected from the moon was at its lowest, providing information on the darkest skies these areas receive. Readings from Trinity College Dublin showed higher levels of light pollution in comparison to Bull Island during a new moon (Figure 17 and 18). The average reading for Trinity College Dublin was 15.36 mag/arcsec2 while the average reading for Bull Island was found to
be 17.03 mag/arcsec2. These values as above do not fit the categories for designation of these selected
sites as dark sky reserves, therefore the quality of the skies for all three sites are of poor quality and record high levels of artificial light. Figures 19 and 20 details the analysis carried out on the data collected during the period of a full moon at both of the study sites. The full moon phase is the brightest stage of the lunar cycle. This is evident in the average light reading at each of the study locations, the average reading for Trinity College Dublin was found to be 15.35 mag/arcsec2 and the
average light reading for Bull Island decreased to 16.46 mag/arcsec2. Both these values show a slight
39 Figure 17. Light readings at Trinity College Dublin. These readings were recorded from February 8th
until the 15th 2016 during a period of a new moon when illumination reflected from the moon was at
[image:48.595.75.512.439.638.2]its lowest, these provide information on the darkest skies this area receives.
Figure 18. Light readings at Bull Island. These readings were recorded from February 8th until the 15th
40 Figure 19. Light readings at Trinity College Dublin. These readings were recorded from February 22nd
until the 29h 2016 during a period of a full moon when illumination reflected from the moon was at
its highest, these provide information on the brightest skies this area receives.
Figure 20. Light readings at Bull Island. These readings were recorded from February 22nd until the 29th
[image:49.595.73.513.448.646.2]41 3.4.3 Protected Species and Light Pollution
Figure 21 provides information on the distribution of the protected species selected for this study based on data accessed on the NBDC website and the information provided by NPWS. Mammals, birds, reptiles and amphibians are all represented. As discussed in section 1.2.1- 1.2.6 light pollution can affect these selected species in a number of ways. In this study, the distribution of three bat species (i.e. - Brown long eared bat Plecotus auritus, Natterer’s bat Myotis nattereri and Whiskered bat Myotis mystacinus) was displayed. These nocturnal species were recorded mainly to the North of the study area in close proximity to Killiney Hill. The Brown Long Eared bat was found to be the most abundant species in the study site.
Other nocturnal species examined in this research include the pine marten, badger and otter. Badgers Meles meles are mainly found in the South of the study area, however distributions have also been
recorded close to the study site of Bull Island. While the distribution of pine marten Martes martes in the study area is much rarer and mainly to the West. Otters Lutra lutra are wide spread throughout the study site and have a high concentration at the water bodies of the areas surrounding Trinity College Dublin. The red squirrel Sciurus vulgaris was included in this studies to examine the impacts of a diurnal species. The direct impacts may be less when compared to the impacts on nocturnal species, however they may be impacted indirectly. The highest abundances of red squirrels was found in both the north and south of the study areas. Grey seals Halichoerus grypus were one of two marine mammals examined in this study, this species was mainly reported in the south of the of the species distribution map.
The increased level artificial light at night may impact species which are uncommon to Ireland. Kemp’s Ridley Lepidochelys kempii were used to examine the impacts of species which may not be common to Ireland. Kemp’s Ridley sea turtles have been recorded on the Southern side of Howth, close to the study site of Bull Island. The only amphibian species included in this study was the common frog Rana temporaria which was found to be wide spread throughout all the three study sites and the
surrounding areas.
42 recorded at Bull Island. The razorbill, sand tern and short eared owl all practise localised breeding in Ireland. The only swan species discussed in this study was the mute swan Cygnus olor which winters in Ireland, this species was found to be primarily to the north west of the study area. Recordings for the red kite Milvus milvus were sparely distributed to the south close to Killiney Hill. Kestrels Falco tinnunculus distributions were recorded in both the north and south of the study area, with the highest
44 4. DISCUSSION
4.1. Light Pollution in Ireland Examined Through Satellite Imagery
As a result of an examination of the changes of brightness in Ireland, using the data gathered from the DMSP/OLS, the results show considerable increases in brightness between the years 1992 to 2013. The analysis of the first satellite imagery taken in 1992 shows saturated light levels in cities such as Dublin, Belfast and Cork. When this imagery is compared to that analysed for the year 2013 it is evident that the spread of saturated light levels have increased and light pollution is reaching areas of semi-rural Dublin. Areas with little or no light pollution in 1992 are found to have increased to moderate light pollution by 2013. The imagery of this research study shows that light pollution is spreading across the County of Ireland in various levels which is a change from the patchy light pollution seen in 1992. The increases in light pollution across Ireland found in this research study is supported by a ground-based study carried out by Espey et al. 2014. This study identified the lack of ground based light level data and developed an Irish light level database. The outcome of this study similarly found the highest light intensities in the capital of Dublin when satellite imagery was analysed. The results of this study, where urban and highly developed areas of a country are found to have the highest levels of light levels at night, has been supported by a study carried out in Greece (Chalkiasa et al. 2006). Athens, the capital of Greece was found to have high levels of light pollution which, like Dublin, has increased greatly in recent years.