Abstract—The overall objective of this research is to design, develop, and evaluate an onboard high-performance Positron Emission Tomography (PET) that will be integrated into an existing CT image-guided small animal precision X-ray radiation therapy system (CT/RT). This new PET/CT/RT will enable streamlined PET/CT biology functional and organ anatomic dual-modality images to guide the therapy, and provide substantially improved beam targeting accuracy and therapy response evaluation. Both simulation and experiment studies were conducted to investigate the detector design with different resolutions, sensitivities, readout methods, and PET system configurations with different image field of view (FOV) and image performance tradeoffs. The results have shown that the 1.0 mm PET uniform image resolution and ~4% system sensitivity can be achieved within a 80 mm trans-axial and 30 mm axial image FOV. A prototype detector that has been developed and evaluated can achieve energy, coincidence timing, and depth-of-interaction resolutions at ~16%, 1.14 ns, and <3.0 mm respectively. In summary, the overall PET detector and system design studies have been successfully conducted for establishing solid technical solutions to develop the PET/CT/RT system.
Index Terms— Positron Emission Tomography, depth-of-interaction, PET/CT image guided radiotherapy, small animal translational radiation therapy research.
I. INTRODUCTION
IOLOGICAL effects and responses to external beam radiation have long been studied with animal disease models [1-3]. In contrast to the conventional studies that irradiate the entire animal or large body sections with broad beams, latest advanced technology development in image-guided small animal precision irradiation systems may open the door for extremely valuable translational radiation therapy (RT) studies with clinically-relevant “targeted radiation” techniques and procedures to effectively mimic and tackle current clinical RT problems. With this new capability, novel radiation oncology methods and
Manuscript submitted February 11, 2018. This work was supported in Corresponding author: Yiping Shao, phone: 215-645-1274; fax: 214-645-7389; e-mail: [email protected].
All authors are with Division of Medical Physics and Engineering, Department of Radiation Oncology, The University of Texas Southwestern Medical Center, Dallas, TX 75390, USA.
approaches can also be thoroughly investigated with animal studies and be potentially translated to the clinical studies. Newly developed small animal RT systems are equipped with a high-resolution small animal Computer Tomography (CT) and capable of high-precision multiple-angle beam deliveries [4-6]. These systems (CT/RT for short) can provide CT image-guided radiation therapy (IGRT) to irradiate small size tumors.
Based on using both tumor anatomic and biological function/status information, Positron Emission Tomography (PET) and CT dual-modality imaging is much more effective and accurate than CT imaging alone to delineate a therapeutic target and evaluate the treatment effectiveness. Since PET/CT IGRT has been the standard clinical RT practice for over a decade, analogous PET/CT IGRT for small animal RT is also required in order to conduct effective clinically-relevant translational RT researches [7, 8]. The problem is that all current CT/RT systems do not equipped with PET, thus it is usually very difficult solely based on CT images to accurately define the target of a soft tissue tumor and to predict the therapy response.
The goal of this project is to solve the above problem by developing an advanced small animal PET and integrating it with an existing small animal CT/RT. This integrated PET/CT/RT will provide streamlined high resolution PET/CT onboard dual-modality imaging, X-ray radiation, follow-up therapy response evaluations and adaptive fractionated treatments all within the same system. The hardware fused PET and CT image provides significant imaging performance advantages compared to software fused separately acquired PET and CT images and is particularly preferred in the radiation therapy applications.
The overall PET/CT/RT concept is shown in Fig. 1. Basically, a compact and high-performance small animal PET along with a second linear translation stage will be integrated inside an existing CT/RT. The overall CT/RT setups, procedures and controls will remain the same. The sequential PET and CT imaging will be achieved by translating the animal between the dual-modality image scanners on the same bed.
This paper focuses on the design studies of the PET image performance and detector and front-end readout electronics development. We will describe the methods and materials applied for the study for the PET system and detector, the results that have been obtained so far, and the prospective of the future development of the PET/CT/RT to
Design Studies of A High-Performance
Onboard Positron Emission Tomography
For Integrated Small Animal PET/CT/RT
Radiation Research Systems
Yiping Shao, Yuncheng Zhong, Xinyi Cheng, and Kun Hu
be completed by this research project.
X-ray tube
Linear stage
moving bed
PET
Mechanical support & for PET cabling
X-ray detector X-ray tube
animal Rotating gantry
bed 3D-stage Positioning-table
X-ray
X-ray detector
X-ray tube
Linear stage
moving bed
PET
Mechanical support & for PET cabling
X-ray detector
X-ray tube
animal Rotating gantry
bed 3D-stage Positioning-table
X-ray
[image:2.595.73.273.83.378.2]X-ray detector
Fig. 1. Concept of integrated PET/CT/RT. Top part shows the configuration of an existing CT/RT (Precision X-Rays Inc., RAD 225Cx), along with an inserted CT/RT interior photo. Bottom part shows the integration of a PET and a second translation stage with the CT/RT. The animal position for RT will still be controlled by the same 3D positioning table, while the sequential PET and CT image acquisitions will be achieved by translating the animal between the two modality imaging systems.
II. MATERIAL AND METHOD
A. PET Image Performance Study
Simulations were conducted to investigate the PET image performance with different system parameters of crystal size, field-of-view (FOV), and depth-of-interaction (DOI) measurement resolution, etc.
GATE simulation package was used for the study [9]. Detailed physical processes of radioisotope distribution and decay, positron emission, positron-electron annihilation and coincident 511 KeV gamma ray emissions, gamma ray interaction and detection, and coincident image data selection and acquisition were simulated on an event-by-event basis to generate list-mode (e.g. time sequentially acquired) data that mimic the online PET acquisition. Data corrections for attenuation and scatter events, image reconstruction, and image analyses were applied offline. Standard OSEM list-mode reconstruction algorithm was applied [10]4. Entire online simulations were running on a >1000 node computer cluster for accelerating the simulation process.
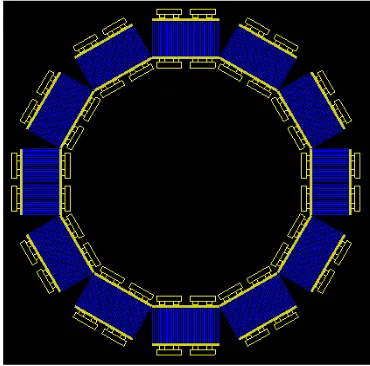
The trans-axial view of a PET configuration generated by the simulation is shown in Fig. 2. PET scanner consists of a ring of 12 modular detector panels in a stationary multi-polygon shape. Each detector panel consists of four detectors that are tiled in a 2×2 matrix. Total 48 detectors will be developed to assemble 12 detector panels for PET
[image:2.595.338.523.86.269.2]scanner assembly. The trans-axial and axial imaging FOV sizes are 8.0 cm (diameter) and 3.2 cm respectively.
Fig. 2. Simulated PET configuration consists of 12 modular detector panels in a dodecagon (twelve-sided polygon). Each detector panel consists of four detectors tiled in a 2x2 matrix. Within each detector, scintillator crystals (blue color) are optically coupled to photon sensors of Silicon Photomultipliers (yellow) at each crystal end to detect gamma ray interaction generated scintillation light photons. The overall FOV sizes are 8.0 cm diameter trans-axially and 3.2 cm axially, which is suited for small laboratory animal (e.g. mice and rats) imaging studies.
Various radioactive sources and phantoms were generated in silico and used to simulate the detector response and system and image performances, include a 22Na point and uniform flood sources, a hot-rod phantom with different rod sizes that filled with 18F solution to evaluate the image resolutions, and a digital rat phantom that contains different body organs with different 18F-FDG radiotracer uptake concentrations to evaluate the image performance of PET and the capability of dual PET/CT imaging for tumor delineation and radiation target definition. More detailed information of these radioactive sources and phantoms, such as the geometries and material compositions, are detailed in section III.
B. PET Detector
Each PET detector consists of a 15×15 array of 1×1x20 mm3 Cerium-doped Lutetium Yttrium Oxyorthosilicate (LYSO) scintillator crystals, with each end of a crystal array optically coupled to an 8×8 array of 2×2 mm2 Silicon Photomultiplier (SiPM) array (Fig. 3). Four such detectors can be tightly tiled together to form a detector panel (Fig. 2).
The overall crystal array size of each detector is about 17.5×17.5 mm2, which matches well with the SiPM (Hamamatsu Photonics, K.K. Multi Pixel Photon Counter, S13361-2050AE-08) array size of 17.8 × 17.8 mm2. Each crystal’s surfaces have treated to a desired optical roughness for enhancing the DOI measurement resolution [11]. Thin optical reflectors (3M Vuitiki Enhanced Speculative Reflector Film) were used between crystals for improving the light output from each crystal and minimizing the optical crosstalk among different crystals.
C. Front-End Readout Electronics
Total 64 signal output channels of one SiPM array were combined into 8 rows and 8 columns to reduce the number of detector signal readout channels to 16, while at the same time without compromising the detector performance in terms of detection and measurement of gamma interaction energy, time, and position capabilities.
Signals from two SiPM arrays at both ends of the LYSO scintillator array were acquired and processed by a 64-channel ASIC time-based SiPM readout electronics, which converts the analog signals into digital pulses and be processed by an onboard FPGA. The details of the electronics and acquisition system are described in previous publications [12-14].
D. Detector Performance Evaluation
[image:3.595.331.535.356.493.2]Basic detection and imaging capabilities of a single detector were evaluated with 22Na point and uniform flood radiation sources. The experiment setup is shown in Fig. 4.
Fig. 4. Experiment setup for detector performance evaluation. A detector is placed at the center of the setup; two preliminary testing boards are on the top and bottom to transfer signals, through flex cables, from SiPM arrays to a 64-ch ASIC detector readout and processing board. The ASIC board is connected to a PC computer (not shown) for data transfer and storage.
For the interaction energy and positioning evaluation, a 22Na uniform flood source irradiated the detector, with summed signals acquired from both SiPM arrays to calculate the event energy and interaction position.
For coincidence timing resolution measurement, an additional reference detector that consisted of a single 1×1×10 mm3 LYSO scintillator coupled to a fast PMT (not shown in Fig. 4) was placed about 8 cm away from the detector, with a 22Na point source being placed between the two detectors. The detected coincident events between the two detectors provided timing difference between them and
were used to calculate the time spectrum for timing resolution measurement [15].
Crystal DOI measurement capability was measured based on an established dual-end scintillator readout method [16]. Basically, the ratios of signals measured from both ends of the detector were calculated and used to calculate the relationship between the signal ratios and DOI positions. Such pre-calculated (or calibrated) response function between the measured signal ratios and DOI can then be used to estimate the DOI in an imaging acquisition [17, 18].
III. RESULTS
Fig. 5 shows simulated hot-rod phantom trans-axial image acquired by the PET. Image shows 4 sections of hot-rods, with their rod diameters being 0.75, 1.0, 1.5, and 2.0 mm respectively. The distance between the nearest neighboring rods within each section is twice of the rod diameter. The phantom was placed at the center of FOV. Each rod filled with 18F radioisotopes. No radioactivity in the background. No data correction of partial volume effect was applied in this initial study.
Except the rods with 0.75 mm section, all rods in 1.0 to 2.0 mm diameter regions are well separated, indicating the imaging capability to achieve at least1.0 mm under simulated conditions.
Fig. 5. Image acquired from a simulated hot-rod phantom that was filled with 18F radioisotopes.
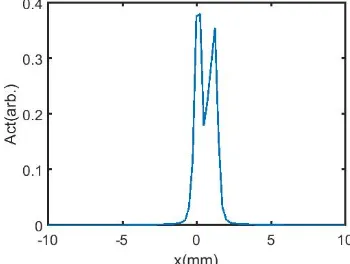
To further quantitatively evaluate the resolution, two 22Na point radioactive sources were placed at the center of FOV with a 1.0 mm center-to-center separation. The intensity profile of the acquired point image across the centers of the sources is shown in Fig. 6. It shows clear separation of the two point sources. The full-with-at-half-maximum (FWHM) equals to ~1.0 mm.
Fig. 6. Image intensity profile from two 22Na point sources shows the
[image:3.595.55.288.413.583.2] [image:3.595.316.491.619.751.2]The image resolution uniformity across the FOV was investigated with simulated multiple 22Na sources arranged radially along a line at different positions off the FOV center, with their images being reconstructed and resolutions along radial, tangential, and axial directions being calculated.
Fig. 7. Top to bottom show: 1) the image of multiple 22Na sources at
different off FOV center distances with the DOI resolution being 5 mm; and 2) measured resolutions along radial, tangential, and axial directions with different DOI measurement resolutions, from 0.0 mm (perfect DOI measurement capability), to 2.0 and 5.0 mm.
As seen from Fig. 7, there is off FOV center distance dependent trans-axial resolution elongation along the radial and tangential directions. This resolution worsening is expected with a limited DOI resolution, as this non-uniform resolution becomes severer at near the edge of FOV. The quantitative resolution changes were measured and also shown in Fig. 7. As indicated by the simulations, if a around <3.0 mm DOI measurement resolution can be achieved, image resolutions along all directions, within the FOV of 8.0 cm diameter and 3.2 cm axial coverage, will achieve 1.0 mm or better.
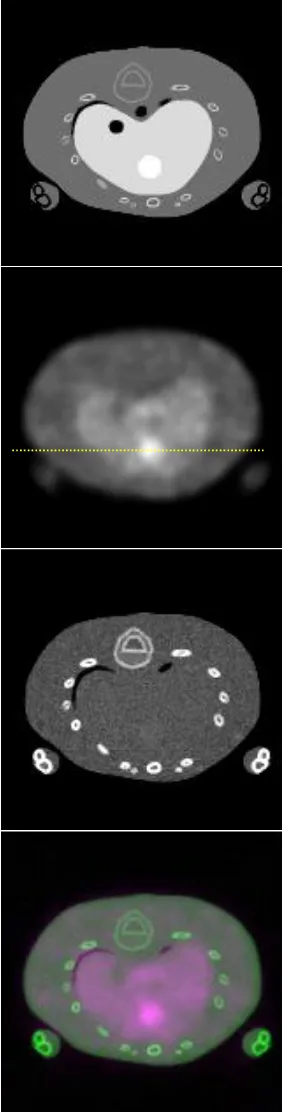
Fig. 8. Top to bottom: 18F-FDG activity concentrations at different regions;
[image:4.595.356.498.203.759.2]Rat phantom image studies are shown in Fig. 8. A 6.0 mm diameter tumor was embedded inside liver. 18F-FDG radioactivities were 6, 3.2, and 2 µCi/cc at tumor, liver, and the rest body parts. Fused PET and CT images show clear tumor identification and localization. The measured radioactivity distribution from an intensity profile drawn from Fig. 8 (dashed yellow line in PET image) is shown in Fig. 9, which shows measured activity ratios matched very well with the input activity radios over different regions.
Fig. 9. Image intensity profile drawn from the PET image shown in Fig. 8 (along the yellow line). The measured mean intensity ratios over tumor, liver and body are 2.7:1.6:1.0, which matches very well with the input radioactivity ratios of 3.0:1.6:1.0.
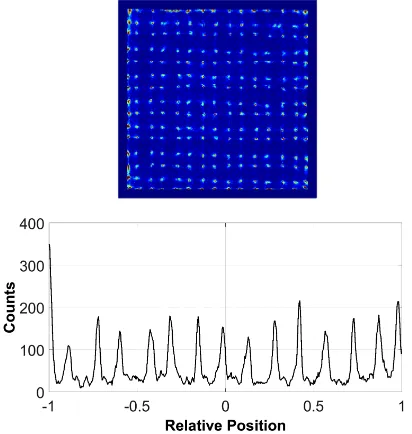
The measured detector crystal identification map from a 22Na uniform flood source is shown in Fig. 10. Most 15
[image:5.595.326.528.80.182.2]×15 crystals are clearly separated and identifiable, indicating that gamma interaction position can be well located. The intensity profile across one typical row near the center of the crystal identification map shows well separated 15 peaks, with average peak to valley ratio about 3.8:1.
Fig. 10. Uniform flood radiation generated crystal identification map and an intensity profile across one row of crystals near the map center.
The energy spectra extracted from one crystal, irradiated by both 22Na (511 KeV) and 137Cs (662 KeV) are shown in Fig. 11. By fitting a Gaussian, the measured energy resolution (FWHM) at 511 KeV photopeak is ~16%, which is good as considering it was measured from a small 1×1×20
[image:5.595.82.246.177.308.2]mm3 LYSO scintillator crystal.
Fig. 11. Energy spectra measured from a typical scintillator crystal with
22Na and 137Cs point isotope sources. Energy scale was calibrated based on
the known energy difference between the 511 and 662 KeV photopeaks.
[image:5.595.319.520.269.374.2]The measured coincidence timing spectrum is shown in Fig. 12. The measured FWHM is 1.14 ns, which is sufficient for small animal imaging applications.
Fig. 12. The measured coincidence timing spectrum fitted with a Gaussian for calculating the FWHM.
The histogram of ratios of signals measured from two SiPM arrays at the both ends of the detector is shown in Fig. 13, with the ratio of the signals being calculated as
Ratio
=
S
1S
1+
S
2(1)
Where S1 and S2 being individual signals from two SiPM arrays.
Fig. 13. Histogram of the ratios of signals measured from SiPM arrays at both ends of the detector.
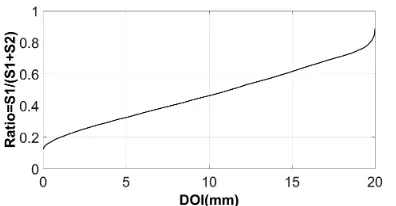
The corresponding response function between the above signal ratios and the DOI positions was calculated and shown in Fig. 14. It shows an almost linear and step response function over most DOI regions. The estimated DOI measurement resolution is between 2.0 and 3.0 mm over a 2.0 to 18.0 mm DOI region, demonstrating desired DOI measurement capability of the prototype detector [19].
Na-22
[image:5.595.65.271.467.684.2] [image:5.595.308.511.522.634.2]Fig. 14. Calculated response function between the DOI positions and the ratios of signals measured from the scintillator dual ends.
IV. DISCUSSION
The full detector coincidence timing performance should be evaluated with two detectors. However, at this point, we only have developed one prototype detector and are still evaluating its performance before finalizing the design. However, we will evaluate the dual detector based coincidence timing and imaging study in the near future.
More detector performance optimization can be conducted such as adjusting the SiPM bias voltage to further improve the scintillation light detection and collection, although the tradeoff with the increased dark count noise should be considered as well. The number of readout electronics channels can be further reduced at the system level if the same reduction method described in III.C will be expanded and applied to the detector panel.
Within the scope of this project, all PET image acquisition and data processing will be controlled by an additional computer, so as the PET/CT image fusion and radiation target definition. The rest RT treatment plan and beam delivery will still be controlled by the CT/RT computer, although it will modify the treatment to incorporate PET/CT image to guide the treatment plan.
The next step in the project is to develop two detectors to conduct the initial experimental image studies by rotating detectors [20]. The success of such study with the new detectors will lead to the finalized detector and system design and PET construction.
V. CONCLUSION
Design studies have been conducted for developing a compact and high-performance small animal PET and integrating it with an existing small animal CT/RT. Simulation study has shown that excellent PET image performance with 1.0 mm uniform image resolution within 8.0 cm trans-axial FOV can be achieved when the detectors can provide a <3.0 mm DOI measurement resolution. First prototype detector has been developed and evaluated. It can achieve 1.0 mm resolution with all of its 15×15 LYSO scintillator crystals being well identified. The measured energy, coincidence timing, and DOI measurement resolutions are around 16%, 1.14 ns, and <3.0 mm respectively. Overall, this study has demonstrated that the required PET image performance can be achieved based on the current system design and the prototype detector capability.
REFERENCES
[1] Mouse models of human cancer. Hoboken, NJ: John Wiley &
Sons, Inc., 2004.
[2] J. Cox and K. Ang, Radiation Oncology 9th ed. Philadelphia: Mosby, 2010.
[3] C. Washington and D. Leaver, Principles and practice of
radiation therapy 3rd ed. New York C.V. Mosby Co. , 2009.
[4] J. Wong, E. Armour, P. Kazanzides, I. Iordachita, E. Tryggestad, H. Deng, et al., "High-resolution, small animal radiation research platform with x-ray tomographic guidance capabilities," Int J Radiat Oncol Biol Phys, vol. 71, pp. 1591-9, Aug 1 2008.
[5] R. Clarkson, P. E. Lindsay, S. Ansell, G. Wilson, S. Jelveh, R. P. Hill, et al., "Characterization of image quality and image-guidance performance of a preclinical microirradiator," Med
Phys, vol. 38, pp. 845-56, Feb 2011.
[6] A. W. Bigelow, C. R. Geard, G. Randers-Pehrson, and D. J. Brenner, "Microbeam-integrated multiphoton imaging system,"
Rev Sci Instrum, vol. 79, p. 123707, Dec 2008.
[7] G. von Schulthess, "Positron emission tomography versus positron emission tomography/computed tomography: from "unclear" to "new-clear" medicine," Mol Imaging Biol., vol. 6, p. 183, 2004.
[8] M. G. Pomper and J. Gelovani, Molecular Imaging in Oncology. New York: Informa Health 2008.
[9] S. Jan, G. Santin, D. Strul, S. Staelens, K. Assié, D. Autret, et al., "GATE: a simulation toolkit for PET and SPECT," Phys
Med Biol, vol. 49, pp. 4543-4561 2004.
[10] R. H. Huesman, G. J. Klein, W. W. Moses, J. Qi, B. W. Reutter, and P. R. Virador, "List-mode maximum-likelihood reconstruction applied to positron emission mammography (PEM) with irregular sampling," IEEE Trans Med Imaging, vol. 19, pp. 532-7, May 2000.
[11] C. Bircher and Y. Shao, "Investigation of Crystal Surface Finish and Geometry on Single LYSO Scintillator Detector Performance for Depth-of-Interaction Measurement with Silicon Photomultipliers," Nucl Instrum Methods Phys Res A, vol. 693, pp. 236-243, Nov 21 2012.
[12] Z. Deng, A. K. Lan, X. S. Sun, C. Bircher, Y. N. Liu, and Y. P. Shao, "Development of an Eight-Channel Time-Based Readout ASIC for PET Applications," IEEE Transactions on Nuclear
Science, vol. 58, pp. 3212-3218, Dec 2011.
[13] X. Sun, A. K. Lan, Z. Deng, X. Zhu, Y. Liu, and Y. Shao, "Evaluation of the second version time based readout ASIC for SSPM based PET applications," presented at the IEEE Nuclear Science Symposium and Medical Imaging Conference, Anaheim, California 2012.
[14] X. Sun, A. K. Lan, C. Bircher, Z. Deng, Y. Liu, and Y. Shao, "Energy and Timing Measurement with Time-Based Detector Readout for PET Applications: Principle and Validation with Discrete Circuit Components," Nucl Instrum Methods Phys Res A, vol. 641, pp. 128-135, Jun 11 2011.
[15] Y. Shao, H. Li, and K. Gao, "Initial experimental studies of using solid-state photomultiplier for PET applications," Nuclear Instruments & Methods in Physics Research Section
a-Accelerators Spectrometers Detectors and Associated
Equipment, vol. 580, pp. 944-950, Oct 1 2007.
[16] W. W. Moses and S. E. Derenzo, "Design studies for a PET detector module using a PIN photodiode to measure depth of interaction," Nuclear Science, IEEE Transactions on, vol. 41, pp. 1441-1445, 1994.
[17] Y. Shao, R. Yao, and T. Ma, "A novel method to calibrate DOI function of a PET detector with a daul-ended-scintillator readout " Med Phys, vol. 35, pp. 5829-5840, 2008.
[18] C. Bircher and Y. P. Shao, "Use of internal scintillator radioactivity to calibrate DOI function of a PET detector with a dual-ended-scintillator readout," Medical Physics, vol. 39, pp. 777-787, Feb 2012.
[19] Y. Shao, X. Sun, K. Lan, C. Bircher, K. Lou, and Z. Deng, "Development of a prototype PET scanner with depth-of-interaction measurement using solid-state photomultiplier arrays and parallel readout electronics " Phys Med Biol, vol. (In press, 1/29/2014) 2014.