Abstract—Remote homology detection plays a pivotal role in bioinformatics and can be used to detect functional and structural relationships between proteins that have a low sequence identity. While good discriminative methods for remote homology detection have been developed recently, the accurate representation of various protein features for homology detection remains a challenge. A hybrid support vector machine method (SVM-hybrid) for protein remote homology detection that combines the support vector machine auto-cross covariance (SVM-ACC) and support vector machine physicochemical distance transformation (SVM-PDT) methods was proposed. A distance transformation was used to extract evolutionary and physicochemical data from protein sequences. A mean receiver operating characteristic (ROC) of 0.959 was achieved using the SCOP 1.53 benchmark datasets. A mean accuracy of 95%, a specificity of 0.894, a sensitivity of 0.988 and a Matthews correlation coefficient (MCC) score of a 0.887 were obtained on opsin protein datasets. The SVM-hybrid method is capable of remote homology detection and has the potential to be used for further protein research.
Index Terms—protein remote homology, support vector machine, protein family detection
I. INTRODUCTION
ROTEINS in the same family always have similar structures and functions. Additional information about an unknown protein can be obtained according to its family. Protein remote homology detection is a branch of biological information science with the purpose of determining whether This work was partially supported by the National Key R&D Program of China [No. 2017YFB0701501], the Project of NSFS [No. 17ZR1409900], the Major Research Plan of NSFC [No. 31500827], and the Project of Young Eastern Scholar [NO. QD2015033].
Jiang Xie is with School of Computer Engineering and Science, Shanghai University, 99 Shang Da Road, Shanghai, China (phone: +86 13817877880; email: [email protected]).
Dongfang Lu is a postgraduate student in the School of Computer Engineering and Science, Shanghai University, 99 Shang Da Road, Shanghai, China (e-mail: [email protected]).
Junhui Shu is a graduate student in the School of Computer Engineering and Science, Shanghai University, 99 Shang Da Road, Shanghai, China (e-mail: [email protected]).
Jiao Wang is a teacher in Laboratory of Molecular Neural Biology, School of Life Sciences, Shanghai University, 99 Shang Da Road, Shanghai, China (phone: +86 18019439942; email:[email protected]).
Haiya Wang is an attending doctor in Department of Geriatrics, Ren-Ji Hospital, Shanghai Jiao-Tong University Medical School, Shanghai, China (email: [email protected]).
Chao Meng is an attending doctor in Department of Geriatrics, Ren-Ji Hospital, Shanghai Jiao-Tong University Medical School, Shanghai, China (email: [email protected]).
Wu Zhang is a professor in School of Computer Engineering and Science, Shanghai University, 99 Shang Da Road, Shanghai, China (email: [email protected]).
a protein belongs to a family.
Many methods for remote homology detection have been developed, and these methods can be divided into three categories: pairwise sequence comparisons, generative models and discriminative methods. In pairwise sequence comparisons, the similarity between two sequences is calculated through protein pairwise alignment and used for remote homology detection. Common pairwise sequence comparison methods include BLAST[1], the Smith-Waterman local alignment algorithm[2], and ClustalW[3]. However, these methods exhibit poor performance in cases with low protein sequence similarities. Generative models utilize probability models to identify proteins. One such model, the hidden Markov model (HMM)[4, 5], can be trained by labeling or not labeling input protein samples for one protein family to generate positive protein sets. Discriminative methods are different from generative models; they use both positive and negative samples to determine the protein family.
As a typical discriminative methods, support vector machines (SVMs) are well-known [6] by its highly accurate computational capabilities and high-dimensional data processing. By using learning algorithms for classification, they are widely used in protein structure classifier and other bio-fields[7][8]. Compared to the multi-layer perceptron, SVMs overcome the drawback that the outputs are class posterior probability estimates[9]. With a set of training samples that are labeled as positive and negative and a kernel function, the SVM maps the samples to a non-linear and high-dimensional feature space. SVMs are commonly used in protein remote homology detection and represent the highest level of development for classification. SVM-pairwise[10] and SVM-Fisher[11] are two well-known discriminative methods that are based on SVMs. In the SVM-pairwise method, each protein sequence will be replaced by E-value scores from the Smith-Waterman algorithm based on the pairwise aligned protein sequences with training sets. Similarly, the SVM-Fisher method considers a vector that consists of a series of scores formed by HMM models that are built for each protein family as one protein sequence. Later studies have focused on sequence-based kernels that use potential subsequence similarities as vectors between pairs of protein sequences[12]. Several studies have also investigated other types of methods, including SVM-HMMSTR[13], SVM-I-sites[14], N-gram[15], and motif searches[16-18]. Recently, profile-based methods have emerged due to the need to improve the accuracy rate of remote homology detection. In these methods, each protein sequence is searched and aligned with sequences from the NCBI non-redundant (NR) database via three iterations and a 0.001
A Hybrid Support Vector Machine Method for
Protein Remote Homology Detection
Jiang Xie*, Dongfang Lu, Junhui Shu, Jiao Wang*, Haiya Wang, Chao Meng, Wu Zhang
E-value parameter. The position-specific scoring matrix (PSSM) profile can be represented as the formula (1) in which (i <=N; j <=20) represents the probability that amino acid j occurs in the protein sequence at position i, and N represents the total number of amino acids. In previous studies[21, 23, 26], protein evolutionary data were primarily extracted from sequence profiles, which were obtained by PSI-BLAST[29]. SVM-recurrence quantification analysis (SVM-RQA)[19] uses amino acid properties obtained from the Amino Acid Index (AAIndex) database[20] through recurrence quantification analyses.
1,1 1,2 1,20
2,1 2,2 2,20
,1 ,2 ,20
(1)
N N N
S S S
S S S
PSSM
S S S
In the SVM-auto-cross covariance (SVM-ACC) method[21], the PSSM is converted to a fixed-length vector by means of auto-cross covariance. BioSVM-2L[22] uses a multi-layer classifier with a bio-kernel, which can increase the accuracy of the protein family classification. The SVM-physicochemical distance transformation (SVM-PDT) method[23] estimates the distance between two amino acids from the physicochemical values separated by a specific distance within the protein sequence. To improve the generalization ability of the pseudo amino acid composition (PseAAC) method, PseAACIndex-Profile[24] uses profiles obtained from the AAIndex database. The AAIndex database is a collector that contains biochemical and physicochemical features of the amino acids, and it consists of three collections: AAIndex1, AAIndex2 and AAIndex3. AAIndex1 contains 544 amino acid indices, AAIndex2 contains 94 amino acid mutation matrices, and AAIndex3 comprises 47 statistical protein contact potential matrices. The SVM incorporating the context of the physicochemical properties (SVM-CP) method[25] considers a position-weighted sliding window and selects a set of specific physicochemical properties that vary for each protein family. Several other profile-based methods[26-28] have also been presented recently.
Because many studies consider only evolutionary or physicochemical data extracted from proteins, the methods do not reflect the maximum number of features present in the protein sequences. Considering the evolutionary and physicochemical data of the proteins, this paper proposes a hybrid SVM (SVM-hybrid) method. The following experiments demonstrate that the SVM-hybrid method is highly comparable with other SVM methods.
II. SVM-HYBRID METHOD
Based on recent studies[19, 21-26], the process of discriminative SVM-based methods to detect remote homology can be summarized as:
1) Use efficient and accurate mathematical formulas to transform the amino acid sequences from datasets into dimension-fixed vectors; and
2) Input sequence vectors to feed a SVM classifier and use a cross-validation test to adjust the SVM classifier model.
The proposed SVM-hybrid method also uses these two steps.
A. Sequence distance transformation
SVMs and related machine learning methods, such as neural networks, are trained on fixed-dimension vectors. Because the protein sequences have variable lengths, the extraction of such sequence data in the sequence-to-vector transformation is vital.
This study proposes a hybrid distance transformation that combines the evolutionary distance and physicochemical distance transformations to better interpret the inherent characteristics of the protein sequences. The principles of the SVM-ACC and SVM-PDT methods are considered.
Fig.1. Summary of the transformation steps 1) Hybrid distance transformation
Based on the hybrid distance transformation, the protein sequence can be transformed into a fixed-dimension vector.
e
V
is defined as the evolutionary distance vector, andV
p is defined as the physicochemical distance vector. Therefore, a protein sequence hybrid distance vectorV
h is defined as:( )
( )
( ) (
2)
h e p
V i
V i
V i
2) Evolutionary distance transformation
The evolutionary data can also be captured by the PSSM; however, these data cannot be directly applied to a classifier. Fortunately, the SVM-ACC method can be used to provide a sufficient evolutionary distance transformation. In this paper, an evolutionary distance vector
V
e composed ofd
e1 and2 e
d
is transformed by each protein sequence’s PSSM profile.The correlation of a given property is measured by the variable de1 to show the two separated residues distance of
, which can be calculated as:, ,
1
(
)( )
(, ) (3)
L
i j i i j i
e
j
S S S S
d i L
where
L
indicates the protein sequence’s length,i
is the sequence’s residue position,S
ij represents theith
amino acid’s score at positionj
, andS
i represents the amino acids’ average score.Based on the correlation of different protein properties, the variable
d
e2 is defined by the two residues separated by the distance μ in the sequence, which is formulated as:1, 1 2, 2
1 2
( )( )
( 1, 2, ) (4)
L
i j i i j i
j e
S S S S
d i i
L
where
i
1
andi
2
represent two different amino acids, and 1i
S
andS
i2 are the average PSSM scores for amino acids1
i
andi
2
.3) Physicochemical distance transformation
Physicochemical characteristics are important properties in remote homology detection and vary from sequence to sequence. In this study, we introduce the AAIndex database to extract the physicochemical and biochemical features for every pair of amino acids, and we select 531 properties from AAIndex1 by removing any incomplete data and any indices with all zeros. The SVM-PDT method was used to determine the physicochemical distance transformation. First, the values of the 531 AAIndex indices were normalized:
20 , , 1 , 20 20 , 2 , 1 1 20 ( ) 2 ) 0 20 (5 i k i j k i j i k i u u k A A P A A
where the property value
A
ij represents the amino acid with positionj
in AAIndex.The sequence’s physicochemical order information can be calculated as follows:
2
, ,
1
( )
( ) (6)
L
i j i j
i p P P d L
along the protein sequence where the two amino acids’ distance is indicated by μ.
The dimension of a single protein sequence’s evolutionary distance vector is 400∗ α, where α is the maximum distance for
(1, 2,..., ), and the physicochemical distance vector is 531*α. Thus, the dimension of the hybrid distance vector is 931*α.B. Sequence distance transformation
We used the open source package LIBSVM[30], which is an open source package for support vector classification (C-SVC, nu-SVC), regression (epsilon-SVR, nu-SVR) and distribution estimation (one-class SVM) that was developed by Chih-Jen Lin Taiwan, China. The radial basis function (RBF) kernel was employed as the kernel function. The values of γ and the regularization parameter C of the RBF kernel were optimized based on the training samples by cross validation.
C. Figures
Format and save your graphic images using a suitable graphics processing program that will allow you to create the images as PostScript (PS), Encapsulated PostScript (EPS), or Tagged Image File Format (TIFF), sizes them, and adjusts the resolution settings. If you created your source files in one of the following you will be able to submit the graphics without converting to a PS, EPS, or TIFF file: Microsoft Word, Microsoft PowerPoint, Microsoft Excel, or Portable Document Format (PDF).
We used the open source package LIBSVM[30], which is an open source package for support vector classification (C-SVC, nu-SVC), regression (epsilon-SVR, nu-SVR) and distribution estimation (one-class SVM) that was developed by Chih-Jen Lin Taiwan, China. The radial basis function (RBF) kernel was employed as the kernel function. The values of γ and the regularization parameter C of the RBF kernel were optimized based on the training samples by cross validation.
III. RESULTS AND DISCUSSION A. SCOP 1.53 family dataset
Datasets
Performance measures
Due to the imbalanced samples in the benchmark, it is not sufficient to evaluate the performance by measuring the accuracy of the identification. The receiver operating characteristic (ROC) is especially for evaluating the classification of unbalanced datasets, and is stable when the distribution of negative and positive samples vary with time [32]. The ROC score is the area under the plot created by the true positive rate (TPR) against the false positive rate (FPR) at various threshold settings.
Performance of different values for α
The value of α (i.e., the maximum value of ) will influence the classification performance. Figure 3 shows the mean ROC scores of the SVM-ACC, SVM-PDT and SVM-hybrid methods for different values of α. We implemented the SVM-ACC and SVM-PDT methods. The default parameters of LIBSVM (γ=1/k, c=1) were used, where k is the number of vector dimensions for one sample.
As shown in Fig. 3, the proposed SVM-hybrid method is better than the other two methods as measured by the ROC scores with varying values of α. The optimal value of α was 10, which provided the best performance. Thus, α=10 was used for the subsequent experiments.
[image:4.595.302.551.121.248.2]Fig.3. The ROC performance
Table 1. Comparison with other methods
Method Mean ROC Source
SVM-hybrid (α=10) 0.959 This study
PseAACIndex-Profile (l=5) 0.922 [24]
SVM-DT (dmax=150) 0.948 [27]
SVM-LA (β=0.5) 0.934 [19]
SVM-PDT (β= 8) 0.916 [23]
BioSVM-2L (1st+2nd layers) 0.927 [22]
DisPseACC (D=5, λ=9) 0.922 [28]
SVM-CP (sliding window:0.93462) 0.934 [25]
SVM-pairwise 0.908 [10]
HHSearch PSI-BLAST
0.915 0.675
[23] [21]
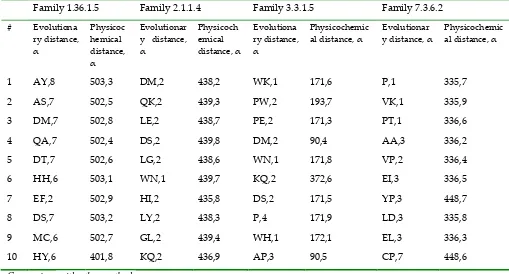
Table 2. Ordered list of discriminative features. The evolutionary distance refers to the cumulative evolutionary change between two protein sequences that were derived from a common ancestral sequence (e.g., properties ‘A’ and ‘Y’ for an α value of 8 have the strongest influences in family 1.36.1.5 as well as in family 2.1.1.4, family 3.3.1.5, and family 7.3.6.2).
Family 1.36.1.5 Family 2.1.1.4 Family 3.3.1.5 Family 7.3.6.2
# Evolutiona ry distance, α
Physicoc hemical distance, α
Evolutionar y distance, α
Physicoch emical distance, α
Evolutiona ry distance, α
Physicochemic al distance, α
Evolutionar y distance, α
Physicochemic al distance, α
1 AY,8 503,3 DM,2 438,2 WK,1 171,6 P,1 335,7
2 AS,7 502,5 QK,2 439,3 PW,2 193,7 VK,1 335,9
3 DM,7 502,8 LE,2 438,7 PE,2 171,3 PT,1 336,6
4 QA,7 502,4 DS,2 439,8 DM,2 90,4 AA,3 336,2
5 DT,7 502,6 LG,2 438,6 WN,1 171,8 VP,2 336,4
6 HH,6 503,1 WN,1 439,7 KQ,2 372,6 EI,3 336,5
7 EF,2 502,9 HI,2 435,8 DS,2 171,5 YP,3 448,7
8 DS,7 503,2 LY,2 438,3 P,4 171,9 LD,3 335,8
9 MC,6 502,7 GL,2 439,4 WH,1 172,1 EL,3 336,3
10 HY,6 401,8 KQ,2 436,9 AP,3 90,5 CP,7 448,6
[image:4.595.113.489.288.460.2] [image:4.595.40.549.506.780.2]We then compared several methods, including PseAACIndex-Profile, SVM-DT[27], SVM-pairwise, SVM-LA[19], SVM-PDT-Profile[23], BioSVM-2L[22], HHSearch[23], and disPseACC[28], with the SVM-hybrid method. We adopted the same benchmark SCOP 1.53 and ROC score to measure the performance of our method. The mean ROC score is the sum of the number of families divided by 54 (the total number of families of the benchmark), and they are listed in Table 1. It was then optimized in SVM-hybrid using a 10-cross-validation test. The results show that the proposed SVM-hybrid method had the highest ROC score of 0.959.
Correlations between discriminative features and protein families
To determine the features’ importance, we used the weights obtained from the model to compute the discriminant weight of each feature in the SVM training. Following a previous study[31], after the kernel-based training, let
1 2
[ ,
,
,
N]
T
be a set of N sequences’ weightvectors and M be the sequence representatives’ matrix. The discriminative weight vector ω is calculated as follows:
(7)
M
Four families were chosen from the SCOP 1.53 benchmark dataset, and the top 10 discriminative features of the evolutionary and physicochemical information were then calculated. The results are listed in Table 2. The evolutionary distance features include the correlation of a given property and different properties between two residues. The properties ‘A’ and ‘Y’ for α value of 8 have a strong influence in family 1.36.1.5. In family 2.1.1.4, most of the evolutionary distance features have the same α value of 2, which indicates the significance of α for this family. The top evolutionary distance feature for family 7.3.6.2 is ‘P’, which indicates that the property ‘P’ between two residues is essential for this family. AAIndex was used to construct the physicochemical distance features. The majority of the top 10 physicochemical distances were focused on index 502 (buriability) and 503 (linker index) of AAIndex for family 1.36.1.5. The influence of the burial of the amino acid residues’ protein stability was revealed by the buriability (the regression slopes of 20 amino acid residues)[35], and the length and composition of the linkers have been shown to influence the protein stability, collapse and domain–domain orientation[36]. These two indices may be essential for family 1.36.1.5. For family 3.3.1.5, index 171 (normalized frequency of the alpha-helix) shows strong discriminative characteristics. Based on this analysis, the different features reflect a variety of structural and functional information for each family, which can be useful for further remote homology research.
B. Opsin family datasets Datasets
In 2005, the revolution called optogenetics occurred with the discovery of a microbial opsin, which could be used to control the electrical activity of neurons[37]. This may realize the dream of fully understanding neural circuits with single-cell precision and shows the potential for clinical translation in treating neurological disorders[38]. Considering the vast contributions of opsin, it is vital for researchers to identify additional light-sensitive proteins with better efficiency, which may enable simpler, more powerful
ontogenetic. The effective identification of opsins has become important. We retrieved opsin and non-opsin protein data from the UniProt database[39]. CD-HIT[40] was used to remove a 90% threshold of redundant sequences from both sets. Additionally, sequences of fewer than 20 amino acid residues were removed. The final opsin family dataset consisted of 170 opsin sequences and 170 non-opsin sequences.
Performance measures
The specificity (SP), sensitivity (SN), accuracy (ACC), and Matthews correlation coefficient (MCC) were used to evaluate the performances of the opsin family datasets. The evaluation indices were formulated as follows:
(8) TN Specificity
TN FP
(9) TP Sensitivity
TP FN
(10)
TP TN Accuracy
TP FP TN FN
( ) ( )
( ))( )( )( ) (11)
TP TN FP FN
MCC
TP FP TP FN TN FP TN FN
where TP is the number of true positives, TN is the number of true negatives, FP is the number of false positives, and FN is the number of false negatives.
The 10-fold cross-validation test and LOOCV test
Using the 10-fold cross-validation test, we compared our method with the SVM-ACC and SVM-PDT methods. Table 3 lists the accuracy of the opsin prediction. The SVM-hybrid method had a mean accuracy of 95%, which provides better performance than the SVM-ACC and SVM-PDT methods. We also tested the prediction model using the LOOCV test. The SVM-hybrid method had a mean SP of 0.894, an SN of 0.988 and an MCC score of 0.887 (see Table 4). The experimental results showed that our method could also detect opsin protein families, even other families.
IV. CONCLUSIONS
The challenge in remote homology detection is determining how to reflect the maximum number of features in a protein sequence. In this paper, we proposed a hybrid remote homology detection method that combines evolutionary and physicochemical distance transformations. This method fully determined the inherent characteristics of protein sequences. In a benchmark test on 4,352 protein datasets, our method achieved a high ROC score of 0.959. Furthermore, we predicted the opsin protein family on a dataset of 170 opsin proteins and 170 non-opsin proteins and achieved a mean accuracy of 95%, a specificity of 0.894, a sensitivity of 0.988 and an MCC score of 0.887. These results showed that our method outperforms other existing methods on benchmark and specific protein family datasets. The SVM-hybrid method will be beneficial for further studies on protein function and structure.
REFERENCES
[2] Pavlopoulos, G. A., Malliarakis, D., Papanikolaou, et al.: ‘Visualizing genome and systems biology: technologies, tools, implementation techniques and trends, past, present and future’, GigaScience, 2015, 4, (1), pp. 1.
[3] Sievers F, Higgins D G. Clustal Omega.: ‘accurate alignment of very large numbers of sequences’, Multiple sequence alignment methods, 2014, 1079, pp. 105-116.
[4] Kaushik, S., Nair, A. G., Mutt, E., et al.: ‘Rapid and enhanced remote homology detection by cascading hidden Markov model searches in sequence space’, Bioinformatics, 2016, 32, (3), pp. 338-344.
[5] Liu B, Zhang D, Xu R, et al.: ‘Combining evolutionary information extracted from frequency profiles with sequence-based kernels for protein remote homology detection’, Bioinformatics, 2014, 30, (4), pp. 472-479.
[6] Vapnik V N.: ‘Statistical learning theory’, in Wiley: New York, 1998, pp. 11-199.
[7] Singh R, Singh R, Kaur D P.: ‘Improved Protein Function Classification Using Support Vector Machine’, International Journal of Computer Science and Information Technologies, 2015, 6, (2), pp. 964-968. [8] Guermeur Y, Thomarat F.: ‘Estimating the class posterior probabilities
in protein secondary structure prediction. IAPR International Conference on Pattern Recognition in Bioinformatics’, in springer Berlin Heidelberg, 2011, pp. 260-271.
[9] Zhao Z, Xu S, Kang B H, et al.: ‘Investigation and improvement of multi-layer perceptron neural networks for credit scoring’, Expert Systems with Applications, 2015, 42, (7), pp. 3508-3516.
[10] Liao L, Noble WS.: ‘Combining pairwise sequence similarity and support vector machines for detecting remote protein evolutionary and structural relationships’, Journal of computational biology, 2003, 10, (6), pp. 857-868.
[11] Liu, B., Xu, J., Zou, Q., Xu, R., Wang, X., Chen, Q.: ‘Using distances between Top-n-gram and residue pairs for protein remote homology detection’, BMC bioinformatics, 2014, 15, (2), pp. S3.
[12] Pandey G, Kumar V, Steinbach M.: ‘Computational Approaches for Protein Function Prediction: A Survey’, Wiley-Interscience, 2006, pp. 267-271.
[13] Yan R., Xu D., Yang J, et al.: ‘A comparative assessment and analysis of 20 representative sequence alignment methods for protein structure prediction’, Scientific Reports, 2013, 3, pp. 2619-2027.
[14] Hou Y, Hsu W, Lee ML, et al.: ‘Efficient remote homology detection using local structure’, Bioinformatics, 2003, 19, (17), pp. 2294-2301. [15] Li, L., Aoki-Kinoshita, K. F., et al.: ‘On using physico-chemical
properties of amino acids in string kernels for protein classification via support vector machines’, Journal of Systems Science and Complexity, 2015, 28, (2), pp. 504-516.
[16] Saigo H, Vert J-P, Ueda N, et al.: ‘Protein homology detection using string alignment kernels’, Bioinformatics, 2004, 20, (11), pp. 1682-1689.
[17] Chen J, Liu B, Huang D.: ‘Protein Remote Homology Detection Based on an Ensemble Learning Approach’, BioMed research international, 2016, 2016, (4), pp. 1-11.
[18] Liu, B., Wang, X., Xu, R., et al.: ‘Protein Remote Homology Detection by Combining Profile-based Protein Representation with Local Alignment Kernel’, Journal of Medical and Bioengineering 2014, 3, (1), pp. 17-22.
[19] Jiang H, Ching W K, Zheng Z.: ‘Kernel techniques in support vector machines for classification of biological data’, International Journal of Information Technology and Computer Science 2011, 3, (2), pp. 1-8. [20] Kawashima S, Kanehisa M.: ‘AAindex: amino acid index database’.
Nucleic acids research, 2000, 28, (1), pp. 374-374.
[21] Liu X, Zhao L, Dong Q.: ‘Protein remote homology detection based on auto-cross covariance transformation’, Computers in biology and medicine, 2011, 41, (8), pp. 640-647.
[22] Muda HM, Saad P, Othman RM.: ‘Remote protein homology detection and fold recognition using two-layer support vector machine classifiers’, Computers in biology and medicine, 2011, 41, (8), pp. 687-699. [23] Liu B, Wang X, Chen Q, et al.: ‘Using amino acid physicochemical
distance transformation for fast protein remote homology detection’, PLoS One, 2012, 7, (9), pp. e46633.
[24] Liu B, Wang X, Zou Q, et al.: ‘Protein Remote Homology Detection by Combining Chou’s Pseudo Amino Acid Composition and Profile‐
Based Protein Representation’, Molecular Informatics, 2013, 32, (9‐
10), pp. 775-782.
[25] Bedoya O, Tischer I.: ‘Remote homology detection incorporating the context of physicochemical properties’, Computers in biology and medicine, 2014, 45, pp. 43-50.
[26] Liu B, Wang X, Xu R, et al.: ‘Protein Remote Homology Detection by Combining Profile-based Protein Representation with Local Alignment Kernel’, Journal of Medical and Bioengineering, 2014, 3, (1), pp. 17-22. [27] Liu B, Xu J, Zou Q, et al.: ‘Using distances between Top-n-gram and residue pairs for protein remote homology detection, BMC bioinformatics, 2014, 15, (Suppl 2), pp. S3.
[28] Liu B, Chen J, Wang X.: ‘Protein remote homology detection by combining Chou’s distance-pair pseudo amino acid composition and principal component analysis’, Molecular Genetics and Genomics, 2015, 290, (5), pp. 1919-1931.
[29] Benson D A, Cavanaugh M, Clark K, et al. GenBank. Nucleic acids research, 2013, 41, (D1), pp. D36-D42.
[30] Chang C-C, Lin C-J.: ‘LIBSVM: a library for support vector machines’, ACM Transactions on Intelligent Systems and Technology, 2011, 2, (3), pp. 27.
[31] Boratyn G M, Schäffer A. A, Agarwala R, et al.: ‘Domain enhanced lookup time accelerated BLAST’, Biology direct, 2012, 7, (1), pp. 1. [32] Kuhn M, Johnson K.: ‘Applied predictive modeling’, in Springer, New
York, 2013, pp. 28-63.
[33] Weiß C L, Schultz J.: ‘Identification of divergent WH2 motifs by HMM-HMM alignments’, BMC research notes, 2015, 8, (1), pp. 1. [34] Morgenstern B, Zhu B, Horwege S, et al.: ‘Estimating evolutionary
distances between genomic sequences from spaced-word matches’, Algorithms for Molecular Biology, 2015, 10, (1), pp. 1.
[35] Echave J, Spielman S J, Wilke C O.: ‘Causes of evolutionary rate variation among protein sites’, Nature Reviews Genetics, 2016, 17, (2), pp. 109.
[36] Zhao Q.: ‘Nature of protein dynamics and thermodynamics’, Reviews in Theoretical Science, 2013, 1, (1), pp. 83-101.
[37] Boyden, E. S., Zhang, F., et al.: ‘Millisecond-timescale, genetically targeted optical control of neural activity’, Nature neuroscience, 2005, 8, (9), pp. 1263-1268.
[38] Boyden, E.S.: ‘Optogenetics and the future of neuroscience’, Nature neuroscience, 2015, 18, (9), pp. 1200-1211.
[39] Consortium U.: ‘The universal protein resource (UniProt)’, Nucleic acids research, 2008, 36, (suppl 1), pp. D190-D195.