Abstract—Continuous extractive distillation is widely used to
separate the mixture of methylal and methanol. The selection of separation agent (entrainer) for extractive distillation of binary mixture is usually based on the analysis of relative volatility diagrams of components as residue curve map (RCM). Tetra-ethylene-glycol as entrainer is possible to obtain high purity of methylal in the extractive distillation process. A practical method to propose the design of the extractive distillation column (EDC) has been obtained by response surface methodology (RSM) with the study of the effect of factors and their interactions on the requirement of energy consumption and methylal purity. The reboiler heat duty of EDC is directly related to mass reflux ratio, entrainer feed stage, temperature of entrainer, and entrainer to feed ratio. While the purity of methylal is related to the entrainer feed stage only. The optimal operation for EDC can be found by using the point prediction of RSM that is sufficient and efficient.
Index Terms—Azeotropic mixture, Extractive distillation,
Optimization, Response surface methodology
I. INTRODUCTION
HE most common process for a thermal separation
technology is distillation which is performed based on the different boiling point. Distillation is the important unit operations that need highly energy consumption. To isolate the azeotropic mixture, there are many techniques such as membrane pervaporation, pressure swing distillation, azeotropic distillation, and extractive distillation [1-3]. In the chemical industrial, extractive distillation is most frequently used because of a greater variety of entrainers and a wider range of operation conditions. Moreover, the feed of entrainers may be controlled by heat and material balances [4].
Methylal (Dimethoxymethane, DMM) is a colorless
W. Weerachaipichasgul is with the Division of Chemical Engineering, Department of Industrial Engineering, Faculty of Engineering, Naresuan University, Phitsanulok, 65000 Thailand (corresponding author to provide phone: +66-55-961000 ext. 4203; fax.: +66-55-961000; e-mail:
A. Chanpirak is with the Division of Chemical Engineering, Department of Industrial Engineering, Faculty of Engineering, Naresuan University,
Phitsanulok, 65000 Thailand(e-mail: [email protected]).
P. Kittisupakorn is with the Department of Chemical Engineering, Faculty of Engineering, Chulalongkorn University, Bangkok, 10330,
Thailand (e-mail: [email protected]).
liquid, a presence of 42 % oxygen by weight, 100% miscible with diesel, and low soot in the combustion. As a result, methylal can be used to be additive in the diesel fuel to reduced gas pollutants [5-6]. Normally, Methylal is synthesized by the reversible reaction of methanol and formaldehyde or paraformaldehyde with heterogeneous acidic catalyst. To overcome the restrictions of chemical equilibrium, an excess of methanol is fed to the reactor [7-9]. Therefore, the mixture of methanol and methylal occurs in the production. However, methylal and methanol form a minimum-boiling azeotropic mixture at atmospheric pressure with 94.06 wt.% methylal [10]. Thus, conventional distillation cannot apply to separate completely the mixture of methylal and methanol.
Extractive distillation is widely used for separation of azeotropes. The most important step is to choose an entrainer (low toxicity, easy recovery, thermal stability, high boiling point, high relative volatility between key components, and high capacity) [10]. There are several researchers investigate the different entrainers to separate the mixture of methanol and methylal such as dimethylformamide (DMF), the mixture of DMF and ionic liquid, and ethylene glycol [10]. Although the selectivity of methylal to methanol of DMF is higher than that ethylene glycol, the ethylene glycol has a low toxicity [11].
The consideration of the toxicity level, ethylene glycol has a considerable toxicity level while the other entrainers is non-toxic. Therefore, the development should drive for safety process. Tetra-ethylene-glycol can be potential entrainer to substitute ethylene glycol such as in the ethanol process industries [12]. To intensify the separation of methylal and methanol, it is necessary to identify new entrainer such as tetra-ethylene-glycol.
The purpose of this work is to design an extractive distillation process to separate methylal by using tetra ethylene-glycol as entrainer. The residue curve maps (RCMs) for the methylal/methanol/ tetra-ethylene-glycol are essential graphical tools for demonstration the potential effect of tetra-ethylene-glycol that can eliminate the azeotropic mixture of methylal and methanol. Moreover, the steady state design involves the selection of the appropriate thermodynamic model and the study of the effect of the main design variables to give the methylal is higher than 99.9%.
Response Surface Methodology in Optimization
of Separation Process for Methylal /Methanol
Based on Process Simulation of Extractive
Distillation
W. Weerachaipichasgul, A. Chanpirak, P. Kittisupakorn
II. STEADY STATE DESIGN
A. Residue Curve Map
The extractive distillation process considered in this study is simulated based on commercial software (Aspen plus). The NRTL activity model is selected as the property package in the simulation using the built-in binary interaction parameters in the simulator. Residue curve map (RCM) is used to design and analyze for distillation boundaries and tie lines in the ternary phase diagram. The residue curve map of methylal/methanol/tetra-ethylene- glycol system at 1 atm as showed in Fig.1, tetra-ethylene glycol gives a good performance to modify the vapor-liquid equilibrium curve from an unstable node (the binary azeotrope) to a stable node.
METHANOL
(64.53 C) (329.33 C)TETRA-EG
METHYLAL(41.95 C)
0.10 0.20 0.30 0.40 0.50 0.60 0.70 0.80 0.90 0.05
0.10 0.15 0.20 0.25 0.30 0.35 0.40 0.45 0.50 0.55 0.60 0.65 0.70 0.75 0.80 0.85 0.90 0.95
[image:2.595.72.267.241.389.2]41.36 C
Fig. 1. Residue curve map for the system methylal/methanol/tetra-ethylene-glycol at 1 atm
B. Process Design
The process flowsheet of the extractive distillation as showed in Fig. 2, that has two columns, one for extractive separation and another for solvent recuperation. The azeotropic mixture (F) and the entrainer (E) streams are fed to extractive distillation column (EDC), where the desired compound takes place to the top of the extractive distillation column. The bottom product of the extractive distillation column feeds to the entrainer recovery column, where the solvent is separated from methanol and is recycled to the extractive distillation column.
Makeup Entrainer
Entrainer Recycle
D2 Methanol D1
Methylal
F Azeotropic Feed
Entrainer Recovery Column Extractive
Distillation Column
Heat Exchanger E
B1
B2
Fig. 2. Typical process flowsheet for the purification ofmethylal using
distillation
In this paper, the excess methanol is fed into the reversible reaction to shift the equilibrium reaction to the right-hand side. Hence the mixture in the production stream combines with methanol, methylal, and water. After pretreatment, water is removed from the feed stream of the extractive distillation process. In order to optimize, the
feeding rate is fixed flow rate at 100 kg/h, and temperature at 40C, respectively. Moreover, mass fraction of methylal methanol are 94.06 wt. % and 5.94 wt. %, respectively. Feed stream is connected to EDC of 15 trays at the tray 8.
III. RESPONSE SURFACE METHODOLOGY
Response surface methodology (RSM) is one of statistical methods that can be helpful for optimization processes. RSM is applied to predict the relative significance of several variables [13].
Central composite design (CCD) is a standard RSM design that is applied to find the optimal condition in the extractive distillation column. The desired model response of the independent variables is obtained by using RSM and regression analysis. The predicted optimal condition is given
0
1 1 1 1,
ˆ k i i k ii i i k k ij i j
i i i j j i
y x x x x x
(1)where yˆ is the predicted responsexi is the levels of the
independent variables, i, j, ij, and ii is the linear coefficient, the quadratic coefficient, the interaction effect, and the squared effect, respectively. Moreover, is the random error, and is the regression coefficients of the independent variables [13].
The interaction between the process parameters and response is investigated by using Analysis of variance (ANOVA). To fit the polynomial model, the quality of this model is inspected by R2 and statistical significance is
evaluated by P-value. Moreover, the predicted optimal operating conditions are presented in 3D plot.
In general, the variables in the polynomial model are not necessarily having the same dimension which makes it difficult to compare their coefficients. Therefore, the variables are coded, all vary between the same minimum and maximum values (-2 and 2). In this work, there are four levels per factor to study and the coded variables are shown in Table I
TABLEI
VARIABLES AND SIMULATION DOMAIN FOR EDC
Factor -2 -1 Level 0 1 2
Reflux ratio (RF) 0.5 3 5.5 8 10.5
Entrainer feed stage (ES) 1 3 5 7 9
Entrainer to Feed ratio (E/F) 1.5 2 2.5 3 3.5
Temperature of Entrainer (Temp (E)) 45 80 115 150 185
To obtain the best model, ANOVA is used to analysis. A quadratic model of RSM is applied to simulate data as followed by the eliminating the term to find statistically insignificant. The model summary statistic demonstrates the high coefficient of determination R2 (>0.9) and a P-value
lower than 0.05 to suggest the models for product purity and energy consumption of the extractive distillation column
IV. RESULTS AND DISCUSSION
TABLEII
SIMULATIONS GENERATED FOR THE EXTRACTIVE DISTILLATION COLUMN
No Rf E/F Es Temp (E) Methylal % Qr
(MJ/hr)
1 8(1) 7(1) 2(-1) 80(-1) 99.626 305.799
2 5.5(0) 5(0) 2.5(0) 115(0) 99.999 216.238
3 3(-1) 3(-1) 2(-1) 80(-1) 100.000 146.307
4 8(1) 3(-1) 2(-1) 150(1) 99.999 273.363
5 5.5(0) 5(0) 2.5(0) 45(-2) 99.998 252.672
6 5.5(0) 5(0) 3.5(2) 115(0) 100.000 229.142
7 5.5(0) 5 (0) 2.5(0) 115(0) 99.999 216.238
8 5.5(0) 5(0) 1.5(-2) 115(0) 99.975 204.818
9 3(-1) 7(1) 3(1) 150(1) 99.987 120.516
10 8(1) 3(-1) 2(-1) 80(-1) 99.998 303.856
11 8(1) 7(1) 2(-1) 150(1) 99.706 274.894
12 5.5(0) 5(0) 2.5(0) 115(0) 99.999 216.238
13 5.5(0) 5(0) 2.5(0) 185(2) 100.000 176.524
14 8(1) 3(-1) 3(1) 150(1) 100.000 278.023
15 8(1) 7(1) 3(1) 80(-1) 99.900 324.254
16 5.5(0) 5(0) 2.5(0) 115(0) 99.999 216.238
17 5.5(0) 5(0) 2.5(0) 45(-2) 99.998 252.672
18 3(-1) 7(1) 3(1) 80(-1) 99.986 166.242
19 3(-1) 7(1) 3(1) 150(1) 99.987 120.516
20 3(-1) 3(-1) 3(1) 80(-1) 100.000 166.214
21 3(-1) 3(-1) 3(1) 150(1) 100.000 120.484
22 10.5(2) 5(0) 2.5(0) 115(0) 99.979 373.921
23 5.5(0) 5(0) 1.5(-2) 115(0) 99.975 204.818
24 5.5(0) 5(0) 2.5(0) 185(2) 100.000 176.524
25 8(1) 7(1) 3 (1) 80(-1) 99.900 324.254
26 5.5(0) 5(0) 2.5 (0) 115(0) 99.999 216.238
27 5.5(0) 5(0) 2.5 (0) 115(0) 99.999 216.238
28 5.5(0) 5(0) 2.5 (0) 115(0) 99.999 216.238
29 8(1) 7(1) 3(1) 150(1) 99.932 278.363
30 8(1) 3(-1) 2(-1) 80(-1) 99.998 303.856
31 5.5(0) 5(0) 2.5(0) 115(0) 99.999 216.238
32 5.5(0) 5(0) 2.5(0) 115(0) 99.999 216.238
33 3(-1) 3(-1) 3(1) 150(1) 100.000 120.484
34 5.5(0) 9(2) 2.5(0) 115(0) 97.756 223.583
35 3(-1) 7(1) 3(1) 80(-1) 99.986 166.242
36 5.5(0) 5(0) 2.5(0) 115(0) 99.999 216.238
37 8(1) 7(1) 2(-1) 150(1) 99.706 274.894
38 5.5(0) 1(-2) 2.5(0) 115(0) 54.751 121.423
39 8(1) 3(-1) 3(1) 150(1) 100.000 278.023
40 5.5 (0) 5 (0) 3.5 (2) 115(0) 100.000 229.142
41 3(-1) 3(-1) 2(-1) 80(-1) 100.000 146.307
42 3(-1) 3(-1) 2(-1) 150(1) 100.000 115.820
43 5.5(0) 1(-2) 2.5(0) 115(0) 54.751 121.423
44 5.5(0) 5(0) 2.5(0) 115(0) 99.999 216.238
45 8(1) 7(1) 2(-1) 80(-1) 99.626 305.799
46 10.5(2) 5(0) 2.5(0) 115(0) 99.979 373.921
47 0.5(-2) 5(0) 2.5(0) 115(0) 99.869 58.768
48 8(1) 7(1) 3(1) 150(1) 99.932 278.363
49 3(-1) 7(1) 2(-1) 150(1) 99.968 115.890
50 3(-1) 7(1) 2(-1) 80(-1) 99.951 146.417
51 8(1) 3(-1) 3(1) 80(-1) 100.000 323.754
52 0.5(-2) 5(0) 2.5(0) 115(0) 99.869 58.768
53 5.5(0) 5(0) 2.5(0) 115(0) 99.999 216.238
54 5.5(0) 5(0) 2.5(0) 115(0) 99.999 216.238
55 3(-1) 7(1) 2(-1) 80(-1) 99.951 146.417
56 5.5(0) 5(0) 2.5(0) 115(0) 99.999 216.238
57 3(-1) 7(1) 2(-1) 150(1) 99.968 115.890
58 8(1) 3(-1) 2(-1) 150(1) 99.999 273.363
59 3(-1) 3(-1) 2(-1) 150(1) 100.000 115.820
60 8(1) 3(-1) 3(1) 80(-1) 100.000 323.754
61 5.5(0) 9(2) 2.5(0) 115(0) 97.756 223.583
62 3(-1) 3(-1) 3(1) 80(-1) 100.000 166.214
The results of ANOVA analysis for all response are shown in Table III. A high R2 coefficient confirms that a
satisfactory match of quadratic model to simulate the data. In this work, data of methylal purity cannot be explained by the model; on the other hand, data of heat duty have the
variation in the process data only 0.03% that the response cannot be explained by the model. Moreover, the F-value are much higher than 5 and P-value is lesser than 0.05, implying that the model terms are statistically [13].
TABLEIII
ANOVA ANALYSIS FOR RESPONSE
Source %Methylal Qr (MJ/hr)
F-value P-value F-value P-value
Model 4.850 0.000 135.520 0.000
Linear 4.350 0.004 465.210 0.000
1
x:Rf 0.000 0.980 1728.910 0.000
2
x :Es 17.520 0.000 21.010 0.000
3
x :E/F 0.000 0.976 10.010 0.003
4
x :Temp (E) 0.000 0.995 100.930 0.000
Square 12.580 0.000 8.420 0.000
2 1
x 1.550 0.220 1.180 0.284
2 2
x 40.760 0.000 27.220 0.000
2 3
x 1.600 0.213 1.380 0.246
2 4
x 1.610 0.211 0.690 0.409
Interaction 0.000 1.000 0.450 0.843
1 2
x x 0.000 0.965 0.010 0.913
1 3
x x 0.000 0.979 0.000 0.946
1 4
x x 0.000 0.995 0.000 0.988
2 3
x x 0.000 0.974 0.010 0.941
2 4
x x 0.000 0.994 0.000 0.987
3 4
x x 0.000 0.997 2.660 0.110
R2 59.07% 97.58%
Adjust R2 46.48% 96.86%
Pred R2 18.43% 95.18%
Independent terms the interactions are statistically significant if the P- value is lesser than 0.05. In Table III, ANOVA analysis results indicate the reboiler heat duty of EDC is directly related to mass reflux ratio (Rf), entrainer feed stage (Es), and mass of the entrainer to feed ratio (E/F). While the purity of methylal is related to Es only. The overall equation for the model relating the reboiler heat duty of EDC of code factors is given by
1 2 3 4
2 2 2 2
1 2 3 4
4 1 2 1 3 1 4
4
2 3 2 4 3 4
7.26992 28.3674 27.2506 2.40788 0.270574
0.301736 2.26865 8.17924 0.00118310
0.0509445 0.126974 3.92468
0.172217 5.41133 0.216664
Qr x x x x
x x x x
x x x x e x x
x x e x x x x
(2)
The graphic analysis of the response surface and contour plot for the reboiler heat duty of EDC and the purity of methylal are illustrate in Fig.3 and Fig. 4, respectively. The interaction between parameters that affect the heat duty are presented in Fig. 3 (a) – Fig. 3 (l). Moreover, the effect of the interaction between parameters for and product purity are presented in Fig. 4 (a) – Fig. 4 (l).
response for the optimal condition to predict the point option by RSM is presented in Fig.5. The optimized entrainer feed is on stage 2.54, which should be on stage 3.
200 150 100 150 100 200 1.8 2.4 50 3.0 3.6 Q r(MJ/h) Temp (E) E/F RF 3 ES 3 Hold Values (a) Temp (E) E/ F 175 150 125 100 75 50 3.5 3.0 2.5 2.0 1.5 RF 3 ES 3 Hold Values > – – – < 120 120 150 150 180 180 210 210 Qr(MJ/h) (b) 200 150 100 150 100 0.0 200 2.5 5.0 50 7.5 Q r(MJ/h) Temp (E) ES RF 3 E/F 2 Hold Values (c) ES Te m p (E) 9 8 7 6 5 4 3 2 1 175 150 125 100 75 50 RF 3 E/F 2 Hold Values > – – – < 80 80 120 120 160 160 200 200 Qr(MJ/h) (d) 3.6 3.0 100 200 2.4 300 0 400 1.8 4 8 12 Q r(MJ/h) E/F RF ES 3
Temp (E) 80 Hold Values (e) RF E/ F 10 9 8 7 6 5 4 3 2 1 3.5 3.0 2.5 2.0 1.5 ES 3
T emp (E) 80 Hold Values > – – – < 100 100 200 200 300 300 400 400 Qr(MJ/h) (f) 3.6 3.0 100 2.4 150 200
0.0 2.5 1.8
5.0 7.5 Q r(MJ/h)
E/F
ES
RF 3
T emp (E) 80 Hold Values (g) ES E/ F 9 8 7 6 5 4 3 2 1 3.5 3.0 2.5 2.0 1.5 RF 3
Temp (E) 80 Hold Values > – – – < 120 120 150 150 180 180 210 210 Qr(MJ/h) (h) 7.5 0 5.0 150 300 0 2.5 450 4 8 0.0 12 Qr(MJ/h) ES RF E/F 2
Temp (E) 80 Hold Values (i) RF ES 10 9 8 7 6 5 4 3 2 1 9 8 7 6 5 4 3 2 1 E/F 2
Temp (E) 80 Hold Values > – – – < 100 100 200 200 300 300 400 400 Qr(MJ/h) (j) 200 150 0 150 100 300 0 450
4 8 50
12 Q r(MJ/h) Temp (E) RF ES 3 E/F 2 Hold Values
(k) RF
[image:4.595.47.561.47.617.2]Te m p (E) 10 9 8 7 6 5 4 3 2 1 175 150 125 100 75 50 ES 3 E/F 2 Hold Values > – – – < 100 100 200 200 300 300 400 400 Qr(MJ/h) (l)
Fig. 3. Response surface for heat reboiler duty connecting of the entrainer to feed ratio (E/F) and temperature of entrainer (Temp (E)) (a),(b); the entrainer feed stage (Es) and temperature of entrainer (Temp (E)) (c),(d); reflux ratio (RF) and entrainer to feed ratio (E/F) (e), (f); entrainer feed stage (Es) and reflux ratio (RF) (i), (j); reflux ratio (RF) and temperature of entrainer (Temp (E)) (k),(l).
TABLEIV
OPTIMUM PARAMETER OF EDC
Rf Es E/F Temp (E)
0.5 2.54 (3) 1.5 45
200 150 94 96 100 98 100
1.8 2.4 50
3.0 3.6 %Methylal Temp (E) E/F RF 3 ES 3 Hold Values (a) E/F Te m p ( E) 3.5 3.0 2.5 2.0 1.5 175 150 125 100 75 50 RF 3 ES 3 Hold Values > – – – < 94.0 94.0 96.0 96.0 98.0 98.0 99.9 99.9 %Methylal (b) 200 150 80 90 100 100 0.0 110
2.5 5.0 50
7.5 %Methylal Temp (E) ES RF 3 E/F 2 Hold Values (c) ES Te m p (E) 9 8 7 6 5 4 3 2 1 175 150 125 100 75 50 RF 3 E/F 2 Hold Values > – – – < 80.0 80.0 88.0 88.0 96.0 96.0 99.9 99.9 %Methylal (d) 3.6 3.0 94 96 2.4 98 0 100 1.8 4 8 12 %Methylal E/F RF ES 3
T emp (E) 80 Hold Values
(e) RF
E/ F 10 9 8 7 6 5 4 3 2 1 3.5 3.0 2.5 2.0 1.5 ES 3
Temp (E) 80
Hold Values
> – – – < 94.0 94.0 96.0 96.0 98.0 98.0 99.9 99.9 %Methylal (f) 3.6 3.0 80 2.4 90 100 0.0 110 2.5 1.8 5.0 7.5 %Methylal E/F ES RF 3
T emp (E) 80 Hold Values
(g) ES
E/ F 9 8 7 6 5 4 3 2 1 3.5 3.0 2.5 2.0 1.5 RF 3
T emp (E) 80
Hold Values
> – – – < 80.0 80.0 88.0 88.0 96.0 96.0 99.9 99.9 %Methylal (h) 7.5 80 5.0 90 100 0 2.5 110 4 8 0.0 12 %Methylal ES RF E/F 2
T emp (E) 80 Hold Values
(i) RF
ES 10 9 8 7 6 5 4 3 2 1 9 8 7 6 5 4 3 2 1 E/F 2 T emp (E) 80
Hold Values
> – – – < 80.0 80.0 88.0 88.0 96.0 96.0 99.9 99.9 %Methylal (j) 200 150 94 96 100 98 0 100
4 8 50
[image:4.595.332.523.648.777.2]12 %Methylal Temp (E) RF ES 3 E/F 2 Hold Values (k) RF Te m p (E ) 10 9 8 7 6 5 4 3 2 1 175 150 125 100 75 50 ES 3 E/F 2 Hold Values > – – – < 94.0 94.0 96.0 96.0 98.0 98.0 99.9 99.9 %Methylal (l)
Fig. 4. Response surface for purity of methylal connecting of the entrainer to feed ratio (E/F) and temperature of entrainer (Temp (E)) (a),(b); the entrainer feed stage (Es) and temperature of entrainer (Temp (E)) (c),(d); reflux ratio (RF) and entrainer to feed ratio (E/F) (e), (f); entrainer feed stage (Es) and reflux ratio (RF) (i), (j); reflux ratio (RF) and temperature of entrainer (Temp (E)) (k),(l).
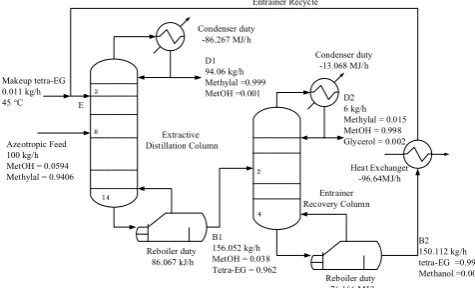
Moreover, the final design for the extractive distillation process that consists of the recovery entrainer column and condition to operation are presented in Fig. 6. The extractive distillation process, the feed of azeotropic mixture is on stage 8 and the position and temperature of tetra-ethylene-glycol stream are on stage 3 and 45 C, respectively. In EDC, methylal (99.99 wt. %) is withdrawn into the overhead and the bottom stream (the mixture of tetra-ethylene-glycol and methanol) is connected to entrainer recovery column on stage 2.
Entrainer Recycle
Entrainer Recovery Column Extractive
Distillation Column E
B2 150.112 kg/h tetra-EG =0.999 Methanol =0.001
3
8
14
2
4
Condenser duty -86.267 MJ/h
Makeup tetra-EG 0.011 kg/h 45 °C
Azeotropic Feed 100 kg/h MetOH = 0.0594
Methylal = 0.9406 Heat Exchanger-96.64MJ/h
D1 94.06 kg/h Methylal =0.999 MetOH =0.001
Reboiler duty 86.067 kJ/h
Reboiler duty
76.166 MJ/h
B1 156.052 kg/h MetOH = 0.038 Tetra-EG = 0.962
D2 6 kg/h Methylal = 0.015 MetOH = 0.998 Glycerol = 0.002 Condenser duty
[image:5.595.47.285.188.332.2]-13.068 MJ/h
Fig. 6. Final flowsheet design for the extractive distillation process to separate methylal-methanol system
V. CONCLUSION
In this work, the separation of methylal and methanol by extractive distillation is intensified by tetra-ethylene-glycol as entrainer. For this system, NRTL model in the commercial simulator (Aspen plus) is used to simulate. The residue curve map (RCM) of the methylal / methanol / tetra-ethylene-glycol is prior analysis. Tetra-tetra-ethylene-glycol as entrainer is possible to obtain high purity of methylal in the extractive distillation process. A practical method to propose the design of the extractive distillation column (EDC) has been obtained by response surface methodology (RSM) with the study of the effect of factors and their interactions on the requirement of energy consumption and methylal purity. The reboiler heat duty of EDC is directly related to mass reflux ratio (Rf), entrainer feed stage (Es), temperature of entrainer (Temp(E)), and entrainer to feed ratio (E/F). While the purity of methylal is related to Es only. To obtain the optimal operating conditions, sensitivity analysis of the EDC has been studied by RSM that is sufficient and efficient for design the extractive distillation system.
ACKNOWLEDGMENT
The authors appreciatively acknowledge financial support for the Research Council of Naresuan University (R2562E023), and also the authors are thankful of Chulalongkorn University (Department of Chemical Engineering) for providing a place to research.
REFERENCES
[1] Carretier, E., Moulin, Ph., Beaujean, M., and Charbit, F. (2003).
Purification and dehydration of methylal by pervaporation. Journal of Membrane Science, 217(1-2), 159-171
[2] Knapp, J.P., and Doherty, M.F. (1992). A New Pressure swing
distillation process for separating Homogeneous azeotropic mixture. Ind. Eng. Chem. Res.,31, 346-357.
[3] Yu, B., Wang Q., and Xu C.. (2012). Design and control of distillation
system for methylal/methanol separation. Part 2: pressure swing distillation with full heat integration. Ind. Eng. Chem. Res., 51(3), 1293–1310.
[4] Kittisupakorn, P., Jariyaboon, K., and Weerachaipichasgul W. (2013).
Optimal high purity acetone production in a batch extractive distillation column, Lecture Notes in Engineering and Computer Science, 143-147.
[5] Ren, Y., Huang, Z., Miao, H., Di, Y., Jiang, D., Zeng K., Bing L., and
Xibin W. (2008). Combustion and emissions of a DI diesel engine fuelled with diesel-oxygenate blends. Fuel. 2691-2697.
[6] Hu, E., Gao, Z., Liu, Y., Yin, G., and Huang Z. (2016). Experimental
and modeling study on ignition delay times of dimethoxy methane/n-heptane blends. Fuel ,189-350.
[7] Satoh, S., and Yukio, T. (2002). Process for Producing Methylal. U.S.
Patent 6,379,507, April 30.
[8] Hagen, G.P., and Spangler, M.J. (2002). Preparation of
polyoxymethylene di-alkane ethers, by catalytic conversion of formaldehyde formed by dehydrogenation of methanol or dimethyl ether. U.S. Patent 6,350,919, February 26.
[9] Zhang, X., Zhang, S., and Jian, C. (2011). Synthesis of methylal by
catalytic distillation. Chemical Engineering Research and Design, 89(6), 573-580.
[10] Dong Y., Dai, C., Lei Z. (2018). Extractive distillation of
methylal/methanol mixture using the mixture of dimethylformamide (DMF) and ionic liquid as entrainers. Fuel, 216, 503-512.
[11] Dong, Y., Dai C., and Lei, Z. (2018). Extractive distillation of
methylal/methanol mixture using the ethylene glycol as entrainer. Fluid Phase Equilibria, 462, 172-180.
[12] Ravagnani, M. A. S. S. , Reis, M. H. M. , Maciel Filho R. , and
Wolf-Maciel M. R. (2010). Anhydrous ethanol production by extractive distillation: A solvent case study. Process Safety and Environmental Protection, 88, 67-73.
[13] Mitra, S. L., Rahbar, R. and Mortaza, Z. (2018). Response surface
methodology in optimization of a divided wall column. Korean J. Chem. Eng., 1414-1422.
[14] Chanpirak, A., Dumnin, P., and Hongpuay A., (2018). Optimization