Supercritical Fluid Extraction
A. A. Clifford, University of Leeds, Leeds, UK Copyright^ 2000 Academic Press
Supercritical Fluids
It is now 170 years since Baron Charles Cagniard de la Tour discovered that, above a certain temperature, single substances do not condense or evaporate, but exist only as Suids. In the following decades the ‘critical point’ was characterized, with its parameters: the critical temperature and pressure. In recent years Suids have been widely exploited at conditions above, but not too far removed from, their critical temper-atures and pressures. The term ‘supercritical Suids’ has been coined to describe these media. Their value lies in the fact that they can have properties inter-mediate between those we associate with gases and liquids, and also that the properties can be controlled by pressure as well as temperature. Consequently, supercriticalSuids can often provide optimum condi-tions for both experiments and processes. Equally important, especially as regulations become tougher, is that supercriticalSuids offer environmental advant-ages. This is mainly because carbon dioxide and water are available as solvents. The disadvantages of supercriticalSuids are that high pressures and some-times temperatures are involved, and, in the case of water, there are corrosion problems. As the techno-logy to overcome them is available, these disadvan-tages become cost and convenience factors to weigh against potential advantages. Consequently, super-criticalSuids are being exploited in specialized areas. Amongst these is supercriticalSuid extraction (SFE), on both an industrial and analytical scale.
Substances used as supercritical Suids include hy-drocarbons, such as propane and ethene, water and ammonia,Suorinated hydrocarbons and even xenon. However, one compound, carbon dioxide, has so far been the most widely used in extraction, because of its convenient critical temperature, cheapness, chem-ical stability, non-Sammability, stability in radioac-tive applications and non-toxicity. Large amounts of carbon dioxide released accidentally could constitute a working hazard, given its tendency to blanket the ground, but hazard detectors are available. It is an environmentally friendly substitute for other organic solvents. The carbon dioxide that is used is obtained in large quantities as a by-product of fermentation, combustion and ammonia synthesis and would be released into the atmosphere sooner rather than later, if it were not used as a supercriticalSuid. Its polar
character as a solvent is intermediate between a truly non-polar solvent such as hexane and weakly polar solvents. Because the molecule is non-polar it is often classiRed as a non-polar solvent, but it has some limited afRnity with polar solutes because of its large molecular quadrupole. It has a particular afRnity for Suorinated compounds and is useful for working with Suorinated metal complexes andSuoropolymers.
To increase the afRnity of carbon dioxide to a var-iety of solutes, substances are added as ‘modiRers’ or ‘entrainers’. The characteristics they impart include increased or decreased polarity, aromaticity, chiral-ity, and the ability to further complex metal-organic compounds. For example, methanol is added to in-crease polarity, aliphatic hydrocarbons to dein-crease it, toluene to impart aromaticity, [R]-2-butanol to add chirality, and tributyl phosphate to enhance the sol-vation of metal complexes. They are often added in 5% or 10% amounts by volume, but sometimes much more, say 50%. They can have signiRcant effects when added in small quantities and in these cases it may be the effect on surface processes rather than solvent character which is important. For example, the modiRer may be effective in extraction by adsor-bing onto surface sites, preventing the readsorption of a compound being extracted.
Table 1 The density,, and viscosity,, of carbon dioxide and the diffusion coefficient for naphthalene in carbon dioxide, D, under gas, supercritical and liquid conditions
/kg m\3 /Pa s D/m2s\1
Gas, 313 K, 1 bar 2 16 5.1;10\6
Supercritical, 313 K, 100 bar 632 17 1.4;10\8
Liquid, 300 K, 500 bar 1029 133 8.7;10\9
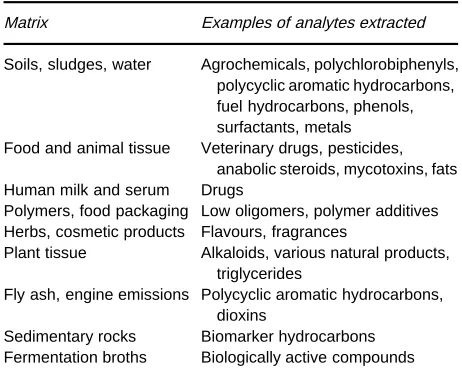
Table 2 Examples of the use of SFE in analytical sample prep-aration
Matrix Examples of analytes extracted
Soils, sludges, water Agrochemicals, polychlorobiphenyls, polycyclic aromatic hydrocarbons, fuel hydrocarbons, phenols, surfactants, metals Food and animal tissue Veterinary drugs, pesticides,
anabolic steroids, mycotoxins, fats Human milk and serum Drugs
Polymers, food packaging Low oligomers, polymer additives Herbs, cosmetic products Flavours, fragrances
Plant tissue Alkaloids, various natural products, triglycerides
Fly ash, engine emissions Polycyclic aromatic hydrocarbons, dioxins
Sedimentary rocks Biomarker hydrocarbons Fermentation broths Biologically active compounds a typical liquid would be closer to 1;10\9m2s\1.
Thus diffusion coefRcients in supercritical Suid ex-periments and processes are typically an order of magnitude higher than in a liquid medium. This has the advantage of faster transport in the narrow pas-sages typical in an extraction.
Application to Extraction
Because of the properties of a supercritical Suid, as described above, SFE can be more rapid than liquid extraction. Furthermore, the solvent is removed more easily, and fractionation of the extract by reducing the pressure in stages is feasible. SFE was Rrst ex-ploited on a process scale and this application con-tinues to develop. On an industrial scale theRrst and most famous example is the ‘natural’ decaffeination of green coffee beans by the Hag process initiated in Bremen. Hops are also extracted by SFE on a large scale. Apart from these large-scale processes, more than 30 high-value oils, Savours and essences are extracted commercially in batch processes.
SFE is also used in chemical analysis to replace liquid extraction for sample preparation for a wide range of systems. SFE is now being used for the Total Diet Study programme of the US Food and Drug Administration. Usually, SFE is more rapid, less laborious and involves solvents which are less hazard-ous. Efforts still have to be made to make it more quantitative, but in fairness to SFE, extraction is often incomplete using a liquid. SFE is sometimes used on-line with an analytical method such as gas chromatography; it is most successful for some poly-mer and plant extractions. Table 2 summarizes the principle analytical applications of SFE.
Laboratory-Scale SFE
SFE is carried out on a laboratory scale for both sample preparation and for initial studies on possible industrial processes. A range of commercial equip-ment is available to carry out experiequip-mental studies
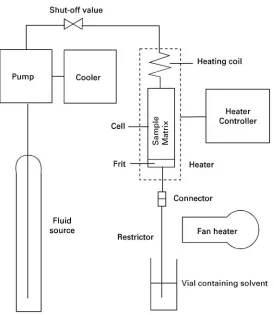
[image:2.568.288.519.521.709.2]Figure 1 Schematic diagram of a simple system for carrying out SFE on a laboratory scale.
restrictor and loss of extracted compounds because of inefRcient trapping. Furthermore, it does not allow independent control of the Sow rate and pressure. More sophisticated commercial methods of pressure control and trapping are available.
In a representative experiment, a 1 mL cell is loaded with 0.5 g of the material to be extracted, (previously dried and ground to particles of 0.1 mm diameter). Carbon dioxide is pumped at a rate of 0.5 mL min\, measured as liquid at the pump. The temperature is 503C and the pressure of 400 bar is maintained by a restrictor of 25m internal diameter and 12 cm length. The efSuent is trapped in 3 mL of dichloromethane, ready for analysis by gas chro-matography after an internal standard had been ad-ded. The extraction is carried out for 30 min. How-ever, conditions for SFE vary widely and the details for a particular application can be found in the many reports now in the literature.
If a modiRer is required, a second liquid pump must be added to the system and the output liquid fed into a mixing chamber just before the shut-off valve in Figure 1. ModiRers are usually added in relatively small amounts, say 5% or 10% by volume. It is possible to purchase cylinders of carbon dioxide
al-ready containing small amounts of common modi-Rers, such as methanol or acetone. If a modiRer is used, the trapping solvent is conveniently the same as the modiRer, as modiRer will precipitate in the collec-tion vial. Trapping is usually more efRcient if a modi-Rer is used.
The experiment described above is described as dynamic extraction, as theSuid is continuouslyS ow-ing through the cell. Static extraction can also be carried out in a similar system if a second shut-off valve is inserted after the extraction cell. During an experiment, the cell is pressurized withSuid and the cell isolated so that contact between the matrix and Suid can occur for a period of about 30 minutes. A short dynamic stage is then carried out to remove theSuid, containing the dissolved extract, from the cell. For a static extraction, a modiRer may be added as liquid to the cell before closing it.
is applicable for example to the analysis of pesticides at low levels. To carry out this procedure, the Rrst section of the chromatographic column is cooled and the carrier gas turned off. SFE is then carried out with the carbon dioxide, or otherSuid substance, passing out through the column and the extracted materials depositing at the inlet of the column. SFE is then stopped and the carrier gas passed through the col-umn to Sush out the carbon dioxide. The column is then raised to the analysis temperature and chromatography carried out.
Pilot and Process-Scale SFE
The basic process of extraction on a process scale is analogous to that on a laboratory scale and is shown schematically in Figure 2. The Suid substance, such as carbon dioxide, is pumped as a liquid and therefore is initially cooled to, say, 53C, which must allow for some heating during pumping, and kept in a cooled reservoir. A system for adding a proportion of liquid modiRer, not shown, may be incorporated. TheSuid is then heated to the extraction temperature and pumped into an extraction cell, which is maintained at this temperature. The matrix to be extracted is packed into the extraction cell in a mesh basket to prevent it being carried out of the cell during extrac-tion. Following extraction, the pressure is reduced to precipitate the extract through a control valve. The Sow rate ofSuid is controlled by the rate of pumping and the pressure in the extraction cell is controlled by the setting of the control valve for a particular pump-ing rate. Control systems may be used to control the extraction conditions. Reduction of pressure causes cooling of theSuid and so heat input is required, as shown. The precipitated material is collected at the base of the collection vessel, which has temperature control and also pressure control from the control valve on theSuid exit. A series of collection vessels at successively lower pressures may be employed to trap all the extract and separate it into fractions to some extent. A trapping liquid, such as a vegetable oil, may be used on a process scale to give a particular prod-uct. Trapping onto a surface, such as active charcoal, may also be used, particularly for volatile products, followed by thermal desorption. On a process scale the Suid leaving the collection vessel is likely to be cooled for recycling.
Mechanisms and Kinetics of SFE
Although extraction is essentially a complex process in which many factors, including procedural para-meters, are involved, in a basic theoretical approach
the process of extraction can be considered to involve the three factors shown in the SFE triangle below.
The solute must, Rrstly, be sufRciently soluble in the supercriticalSuid to be removed by solution in the SuidSow. If this is not the case, it will be revealed by interpretation of the kinetic recovery curve, as shown below. If solubility is insufRcient, the situation may be improved by adding a modiRer to the Suid, as described earlier.
Secondly, the solute must be transported sufR -ciently rapidly, by diffusion or otherwise, from the interior of the matrix in which it is contained. The diffusion process may be normal diffusion of the solute, or it may involve diffusion in theSuid thor-ough pores in the matrix. The time-scale for diffusion will depend on the diffusion coefRcient and the shape and dimensions of the matrix or matrix particles. Of these the shortest dimension is of great importance, as the times depend on the square of its value. Values for this quantity of 1 mm or preferably less are usually necessary.
Figure 2 Schematic diagram of SFE on a process scale.
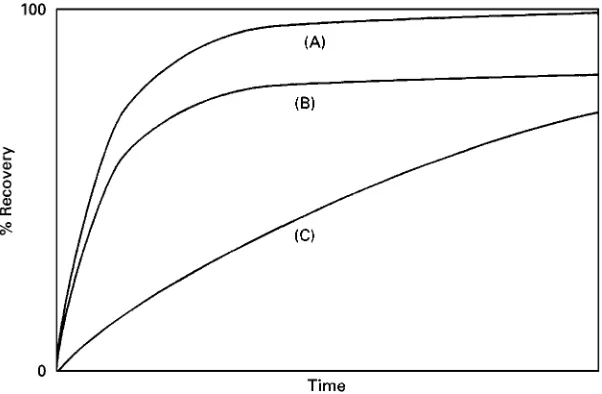
Figure 3 Examples of schematic recovery curves, where recovery is controlled by (A) diffusion; (B) diffusion and matrix effects; and (C) by solubility.
than in enhancing solubility. The mechanism is thought to involve interactions with surfaces. It should be emphasized here that the matrix effect also occurs with liquid solvent extraction. The fact that solvent strength can be varied in a supercriticalSuid means that the matrix effect is more obvious in this medium and can be studied in more detail. The ad-vantage is that conditions can often be found in SFE where the matrix effect is minimized.
A related problem is the presence of water. Water is not very soluble in manySuids, such as carbon diox-ide, and it can ‘mask’ the substances to be recovered. The rate of extraction may sometimes be equal to the rate of water removal. It may be necessary to dry the material to be extracted in air or by admixture with
a drying agent, such as diatomaceous earth or anhyd-rous magnesium sulfate. Reduction of the water con-tent of plant material from, say, 80% (as measured by mass loss at 1003C) down to 10% may be desirable, provided valuable volatiles are not lost in the process. However, water may assist extraction by acting as a modiRer, as is believed to be the case for coffee decaffeination.
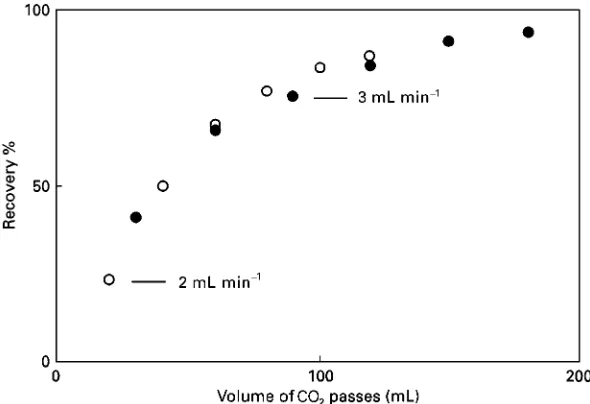
[image:5.568.135.436.489.686.2]Figure 4 Extraction of lycopene from tomato paste at 1003C and 400 bar at two flow rates plotted against the volume of CO2passed.
may improve the matrix factor by adsorbing on surface sites. ModiRers, such as methanol, can reduce the water problem by improving its solubility in the Suid.
Figure 3shows examples of the types of curves of recovery versus time that can be obtained in SFE. Curve (A) is a typical curve obtained when the pro-cess is controlled by diffusion. When matrix effects are signiRcant, the results may have the form of (B). Curve (C) is an example of recovery behaviour when the extracted compound is not very soluble in the extractedSuid. It is thus highly desirable, when devel-oping a procedure for a particular application, to carry out kinetic experiments to obtain curves of recovery versus time. The curves can then be used to investigate the reaction mechanism, as well as deter-mine a suitable extraction time. These developments are detailed in some of the books listed in the bibli-ography. Kinetic experiments are done by replacing the collection vial periodically. As extraction is faster initially, the time intervals are smaller near the begin-ning of an extraction. A representative series of times for changing over the collection vial is 2, 5, 10, 20, 30, 40 and 60 min. The total amount extracted can also be compared with liquid extraction.
An example of an experimental recovery curve is now given inFigure 4for the extraction of lycopene from 0.5 g of tomato paste, dried by mixing with diatomaceous earth, at 1003C and 400 bar. Flow rates of 2 mL min\ and 3 mL min\ per minute (measured as liquid at the pump) were used, and the results plotted not against time, but against the vol-ume of CO2 passed (i.e. the time multiplied by the Sow rate). The fact that the two curves
approxim-ately coincide, indicates that the extraction is princi-pally by the partition of lycopene between CO2and the tomato paste matrix, which in turn is related to the solubility of lycopene in CO2.
Conclusions
SupercriticalSuid extraction can be a clean alterna-tive to liquid solvent extraction both for analytical sample preparation and for production scale, because environmentally friendly solvents such as carbon di-oxide can be used instead of organic solvents. Some applications are found to be more successful than others. It requires more expensive equipment and a greater commitment to process development than liquid extraction. Nevertheless, it is being applied in speciRc areas, such as for polymer additives in ana-lytical chemistry and as a method for obtaining valu-able compounds from plants on a process scale.
See Colour Plate 44.
See also: II/Chromatography: Supercritical Fluid: Large-Scale Supercritical Fluid Chromatography. III/En-vironmental Applications: Supercritical Fluid Extraction. One-line Sample Preparation: Supercritical Fluid Ex-traction. Polymers: Supercritical Fluid ExEx-traction.
Further Reading
Bright FV and McNally MEP (1992) Supercritical Fluid
Technology.ACS Symposium Series 488. Washington
DC: American Chemical Society.
Clifford, T (1998) Fundamentals of Supercritical Fluids. Oxford: Oxford University Press.
Figure 1 Sound frequencies (Hz, cycles per second). , hu-man hearing 16 Hz}16 kHz; , power 20 kHz}100 kHz (clearing plastic welding sonochemistry); X, high frequency 1 MHz} 10 MHz (medical diagnosis, chemical analysis). (From Mason TJ (1991).)
King JW and List GR (1996)Supercritical Fluid
Techno-logy in Oil and Lipid Chemistry. Champaign, Illinois: American Oil Chemists’ Society.
King MB and Bott TR (1993)Extraction of Natural
Prod-ucts Using Near-Critical Solvents. Glasgow: Blackie.
Lee ML and Markides KE (1990)Analytical Supercritical
Fluid Chromatography and Extraction. Provo, Utah: Chromatographic Conferences, Inc.
Lynch TP in Adlard ER (1995) Chromatography in the
Petroleum Industry. Journal of Chromatography
Li-brary Vol. 56. Amsterdam: Elsevier.
McHugh MA and Krukonis VJ (1994) Supercritical
Fluid Extraction, 2nd edn. Boston: Butterworth-Heinemann.
Page SH, Sumpter SR and Lee ML (1992) Fluid phase equilibria in supercritical Suid chromatography with CO2-based mixed mobile phases: a review. Journal of
Microcolumn Separations4: 91.
Westwood SA (1993)Supercritical Fluid Extraction and its Use in Chromatographic Sample Preparation. Glasgow: Blackie.
Ultrasound Extractions
C. Bendicho and I. Lavilla,
Universidad de Vigo, Facultad de Ciencias (QuO&mica), Vigo, Spain
Copyright^ 2000 Academic Press
Introduction
Sound is transmitted through a medium by inducing vibrational motion of the molecules forming part of it. Human hearing threshold is reached when the frequency of sound is higher than 16}18 kHz. Ultra-sound comprises the region of frequencies between 18 kHz and 100 MHz, the upper limit not being sharply deRned (Figure 1). This broad region can still be divided into two different regions: power sound between 20 and 100 kHz and diagnostic ultra-sound between 1 and 10 MHz. The above classiR ca-tion relies on the capability of energy transmission into the medium at the lower frequencies, which induces the cavitation phenomenon.
Relevant applications of ultrasonic energy include its use in animal communications (e.g. bat navigation and dog whistles), medicine for fetal imaging, under-water range Rnding (SONAR) and nondestructive testing for metalSaws. Recently, ultrasound has also been considered a potential source for enhancement of chemical reactivity. A large variety of chemical and industrial processes rely on high intensity
ultrasonica-tion, e.g., cleaning, drilling, soldering, acceleration of chemical reactions, emulsiRcation, sterilization,S ota-tion, homogenizaota-tion, dissoluota-tion, deaggregation of powder, disruption of biological cells, extraction, crystallization, oxidation, etc. A further advantage of the above-mentioned ultrasound-assisted processes is the relative simplicity of both method development and instrumentation.
A brief description of ultrasound fundamentals as well as a discussion of its applications for solid}liquid extraction is given below.
Fundamental Features of Ultrasound
Vibrations Induced by Ultrasound
Sound waves are usually represented as a series of vertical lines, with intensity being related to separ-ation between them, or as a sine wave where intensity is related to the amplitude (Figure 2).
Ultrasonic irradiation of a liquid medium gives rise to an acoustic pressure (Pa) which is added to the hydrostatic pressure (Ph) which exists in the medium. The acoustic pressure depends on time according to the following expression:
Pa"PAsin 2ft
wherefis the frequency of the wave ('16 kHz),tis the time andPAis the maximum pressure amplitude of the wave. At the point where the lines are close to each other, pressure is higher than normal (i.e. com-pression region), whereas at the point where the lines are furthest apart, pressure is lower than normal (i.e. rarefaction region).
The intensity of the wave can be deRned as the energy transmitted per second per cm2 of Suid and can be related toPAas follows: