Agronomy2015, 5, 537-554; doi:10.3390/agronomy5040537
agronomy
ISSN 2073-4395
www.mdpi.com/journal/agronomy
Article
Inter-Taxa Differences in Iodine Uptake by Plants: Implications
for Food Quality and Contamination
Eleni Siasou † and Neil Willey †,*
Centre for Research in Bioscience, Faculty of Health and Applied Sciences,
University of the West of England, Coldharbour Lane, Frenchay, Bristol BS16 1QY, UK; E-Mail: [email protected]
† These authors contributed equally to this work.
* Author to whom correspondence should be addressed; E-Mail: [email protected]; Tel.: +44-117-3282314.
Academic Editor: Gareth J. Norton
Received: 22 July 2015 / Accepted: 4 November 2015 / Published: 9 November 2015
Abstract: Although iodine is not essential for plants, they take it up readily and, in foodchains, are significant sources of iodine for organisms with an essential requirement for it. During several nuclear accidents radioiodine has been an important component of releases of radioactivity and has caused serious contamination of foodchains. Differences in iodine uptake by different plant taxa are, therefore, important to nutritional and radioecological studies. Using techniques we have developed for a range of other elements, we analyzed inter-taxa differences in radioiodine uptake by 103 plant species and between varieties of two species, and analyzed them using a recent, phylogenetically-informed, taxonomy. The results show that there are significant differences in uptake above and below the species level. There are significant differences between Monocots and Eudicots in iodine uptake, and, in particular, hierarchical ANOVA revealed significant differences between Genera within Families. These analyses of the taxonomic origin of differences in plant uptake of iodine can help the prediction of crop contamination with radioiodine and the management of stable iodine in crops for nutritional purposes.
Keywords: iodine; radioiodine; radioecology; angiosperm phylogeny; soil-to-plant transfer; foodchains
1. Introduction
Iodine (I) is readily taken up by plants if available [1], which is important to both agronomy and radioecology because, although I is not an essential element for plants, food crops are a major conduit for the entry of I to human foodchains. Stable I (127I) is an essential trace element for humans whilst
the radioisotopes 131I and 129I can be significant radioactive contaminants of the environment [2].
About two hundred million people worldwide suffer from I deficiency disorders (IDD), with an at risk population potentially in excess of one billion [3]. It has been estimated that around 44% of children and adults in Europe have a mild iodine deficiency [4]. Low I intake from food crops is partly responsible for IDD and thus, as for many other trace elements [3], to redress deficiencies it is potentially useful to understand the agronomy of 127I in the soil-crop system. The iodized-salt
enrichment diet has reduced I deficiency in some areas but there are still areas with a significant level of IDD.
The toxicologically important radioisotopes 131I and 129I, which are both fission products, can be a
significant component of releases of radioactivity to the environment, and, as isotopes of an essential element, tend to accumulate in animals if they are present in food. 131I has a short-half life (eight days),
is quite a high energy emitter and is primarily of concern as a food contaminant in the immediate aftermath of releases from accidents or from fall-out from above-ground nuclear weapons detonation.
129I has a long half-life (15.7 × 10⁶ years) and has been of importance in accidental releases, but it is a
major, and potentially mobile, constituent of high and medium level nuclear waste [2], and is released into the marine environment from nuclear-fuel reprocessing plants [5]. 129I has the potential to be
drawn upwards through soil profiles from repositories [6] and to be transferred from sea to land [5], provoking interest in its transfer characteristics from soil-to-plants during assessments of nuclear waste repositories and marine releases.
The transfer of I from soils-to-plants is possible because its isotopes can be both available in soil and taken up by plants. In fact, in comparison to many other nutrients and radionuclides, I isotopes are highly available in many soils with, for example, compilations of soil-solution distribution coefficients (Kd) for radionuclides suggesting that 129I is amongst the least strongly adsorbed isotopes in a range
of soils [7]. There is little sorption of 129I on clay minerals and any sorption is primarily to organic
matter [6]. I is more labile under anoxic than oxic soil conditions. For example, the flooding of paddy soils has long been known to produce the “Akagare” phenomenon in rice, which results from I toxicity caused by large increases in availability brought on by anoxia [8]. It is also clear that there can be significant changes in I mobility between the water-table and the vadose zone in soils [6]. In many soils I− and IO3− are the most common ionic forms, with I− most likely to be taken up by plants [1]
because they have substantial capacity for the uptake of the chemically similar Cl− [9]. Overall,
although soil-to-plant transfer factors can be quite low from, for example, Andosols with high anion exchange capacities [10], hydroponic experiments show that plants can take up large quantities of I if it is available to them [1] and most soils produce transfers to crops that can contribute significantly to food I content and to radiocontamination if 127I or 131/129I are available in the soil.
Agronomy 2015, 5 539
inter-taxa differences in uptake under the same conditions of availability [11]. It seems likely, therefore, that there might be inter-taxa differences in the concentration to which plants take up I, and that these might be useful to understanding the agronomy of I. There are, however, few data on this phenomenon and no studies that have attempted to link these differences to recent phylogenies of angiosperms (flowering plants), nor to compare them to inter-varietal differences. The understanding of the phylogeny (evolutionary relationships) of angiosperms has been transformed in recent years by molecular and computer methodologies, resulting in new phylogenies for angiosperms (e.g., [12]). Given that many phenotypes can be affected by phylogeny, angiosperm phylogenies specifically for use in comparative biological experiments have been published [13]. These have now been used to analyze inter-species differences in the concentrations to which plants concentrate numerous elements [11,14–18], and to establish that there is a significant influence of angiosperm phylogeny on plant mineralogy, including that of crop plants. Such analyses require quite large databases of inter-species comparisons, often produced by collating data from a variety of sources through, for example, Residual Maximum Likelihood (REML) analysis. Here we utilize techniques successfully used to investigate inter-species differences of other elements to construct a database of relative I concentrations following root exposure in 103 angiosperm species, analyze their differences using a recently published phylogenetic hierarchy for the angiosperms, compare them to inter-varietal differences in two species, and assess their influence on I concentrations in food crops. The usefulness of the results to predicting the transfer of I isotopes from soils to plants in agricultural and radioecological contexts is then discussed.
2. Results and Discussion
2.1. Inter-Species Differences in I Concentration
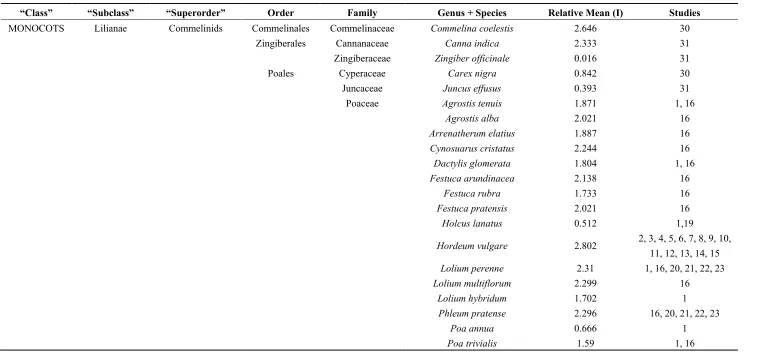
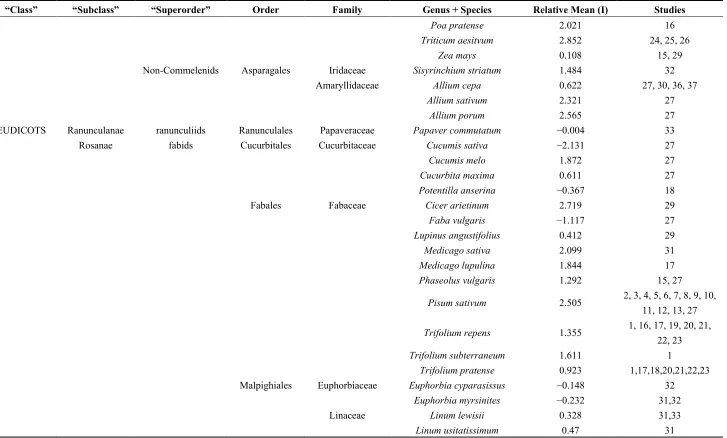
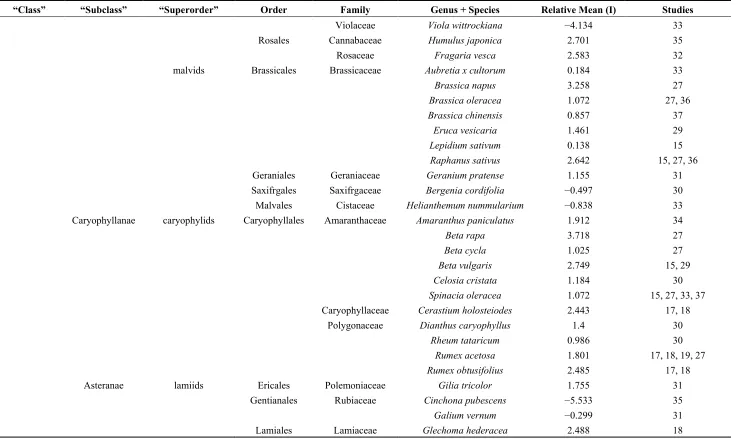
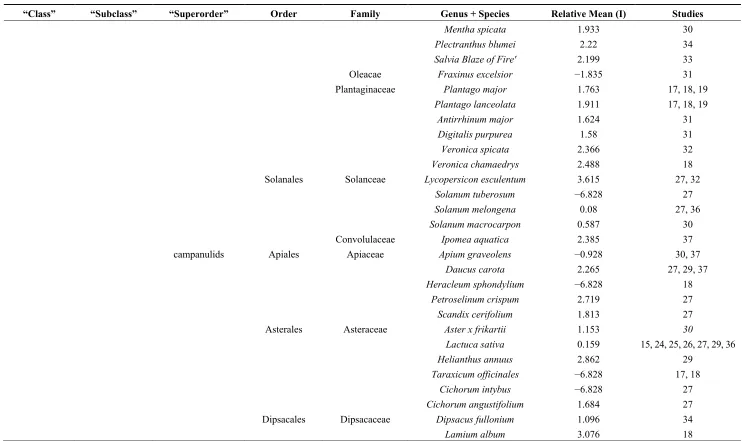
REML-estimated relative mean I concentrations in 103 species of plants are shown in Table 1, which is the most taxonomically wide-ranging comparison of relative I concentrations in plants yet published. Given that raw data is loge-transformed prior to REML analysis, the large range in REML
transformed values (−6.83 to 3.72) indicates that there are substantial inter-species differences in I uptake after the exposures used to generate data contributing to the database. This was confirmed using species grown for this work, in which replicate values for individual species grown under the same conditions allowed inter-species differences to be analyzed statistically (Figure 1). The International Atomic Energy Agency (IAEA) has recommended, based on data compilations across a range of different soil and crop types, mean soil-to-plant concentration ratios (CRs) for radioelements including radioiodine [19]. Iodine CR is calculated by dividing the concentration in the plants by the concentration in the soil. To enable comparison we estimated an overall CR for radioiodine of 0.075 based on values for cereal stems and leaves, leafy vegetables and non-leafy vegetables (Table 17.1 in [19]). 125I activity values measured in the experiments for Figure 1 were therefore transformed to
Table 1. Residual Maximum Likelihood I concentrations in 103 species of angiosperm listed according to the Angiosperm Phylogeny Group III system. (Study 1: [20]; Studies 2–14: [21]; Study 15: [22]; Studies 16–19: [23]; Studies 20–23: [24]; Studies 24–26: [25]; Study 27: [26]; Study 28: [27]; Studies 29–35Experiments for this study; Study 36: [10]; Study 37: [28].
“Class” “Subclass” “Superorder” Order Family Genus + Species Relative Mean (I) Studies
MONOCOTS Lilianae Commelinids Commelinales Commelinaceae Commelina coelestis 2.646 30
Zingiberales Cannanaceae Canna indica 2.333 31
Zingiberaceae Zingiber officinale 0.016 31
Poales Cyperaceae Carex nigra 0.842 30
Juncaceae Juncus effusus 0.393 31
Poaceae Agrostis tenuis 1.871 1, 16
Agrostis alba 2.021 16
Arrenatherum elatius 1.887 16
Cynosuarus cristatus 2.244 16
Dactylis glomerata 1.804 1, 16
Festuca arundinacea 2.138 16
Festuca rubra 1.733 16
Festuca pratensis 2.021 16
Holcus lanatus 0.512 1,19
Hordeum vulgare 2.802 2, 3, 4, 5, 6, 7, 8, 9, 10, 11, 12, 13, 14, 15
Lolium perenne 2.31 1, 16, 20, 21, 22, 23
Lolium multiflorum 2.299 16
Lolium hybridum 1.702 1
Phleum pratense 2.296 16, 20, 21, 22, 23
Poa annua 0.666 1
Agronomy 2015, 5 541
Table 1.Cont.
“Class” “Subclass” “Superorder” Order Family Genus + Species Relative Mean (I) Studies
Poa pratense 2.021 16
Triticum aesitvum 2.852 24, 25, 26
Zea mays 0.108 15, 29
Non-Commelenids Asparagales Iridaceae Sisyrinchium striatum 1.484 32
Amaryllidaceae Allium cepa 0.622 27, 30, 36, 37
Allium sativum 2.321 27
Allium porum 2.565 27
EUDICOTS Ranunculanae ranunculiids Ranunculales Papaveraceae Papaver commutatum −0.004 33
Rosanae fabids Cucurbitales Cucurbitaceae Cucumis sativa −2.131 27
Cucumis melo 1.872 27
Cucurbita maxima 0.611 27
Potentilla anserina −0.367 18
Fabales Fabaceae Cicer arietinum 2.719 29
Faba vulgaris −1.117 27
Lupinus angustifolius 0.412 29
Medicago sativa 2.099 31
Medicago lupulina 1.844 17
Phaseolus vulgaris 1.292 15, 27
Pisum sativum 2.505 2, 3, 4, 5, 6, 7, 8, 9, 10, 11, 12, 13, 27
Trifolium repens 1.355 1, 16, 17, 19, 20, 21, 22, 23
Trifolium subterraneum 1.611 1
Trifolium pratense 0.923 1,17,18,20,21,22,23
Malpighiales Euphorbiaceae Euphorbia cyparasissus −0.148 32
Euphorbia myrsinites −0.232 31,32
Linaceae Linum lewisii 0.328 31,33
Table 1.Cont.
“Class” “Subclass” “Superorder” Order Family Genus + Species Relative Mean (I) Studies
Violaceae Viola wittrockiana −4.134 33
Rosales Cannabaceae Humulus japonica 2.701 35
Rosaceae Fragaria vesca 2.583 32
malvids Brassicales Brassicaceae Aubretia x cultorum 0.184 33
Brassica napus 3.258 27
Brassica oleracea 1.072 27, 36
Brassica chinensis 0.857 37
Eruca vesicaria 1.461 29
Lepidium sativum 0.138 15
Raphanus sativus 2.642 15, 27, 36
Geraniales Geraniaceae Geranium pratense 1.155 31
Saxifrgales Saxifrgaceae Bergenia cordifolia −0.497 30
Malvales Cistaceae Helianthemum nummularium −0.838 33
Caryophyllanae caryophylids Caryophyllales Amaranthaceae Amaranthus paniculatus 1.912 34
Beta rapa 3.718 27
Beta cycla 1.025 27
Beta vulgaris 2.749 15, 29
Celosia cristata 1.184 30
Spinacia oleracea 1.072 15, 27, 33, 37
Caryophyllaceae Cerastium holosteiodes 2.443 17, 18
Polygonaceae Dianthus caryophyllus 1.4 30
Rheum tataricum 0.986 30
Rumex acetosa 1.801 17, 18, 19, 27
Rumex obtusifolius 2.485 17, 18
Asteranae lamiids Ericales Polemoniaceae Gilia tricolor 1.755 31
Gentianales Rubiaceae Cinchona pubescens −5.533 35
Galium vernum −0.299 31
Agronomy 2015, 5 543
Table 1.Cont.
“Class” “Subclass” “Superorder” Order Family Genus + Species Relative Mean (I) Studies
Mentha spicata 1.933 30
Plectranthus blumei 2.22 34
Salvia Blaze of Fire' 2.199 33
Oleacae Fraxinus excelsior −1.835 31
Plantaginaceae Plantago major 1.763 17, 18, 19
Plantago lanceolata 1.911 17, 18, 19
Antirrhinum major 1.624 31
Digitalis purpurea 1.58 31
Veronica spicata 2.366 32
Veronica chamaedrys 2.488 18
Solanales Solanceae Lycopersicon esculentum 3.615 27, 32
Solanum tuberosum −6.828 27
Solanum melongena 0.08 27, 36
Solanum macrocarpon 0.587 30
Convolulaceae Ipomea aquatica 2.385 37
campanulids Apiales Apiaceae Apium graveolens −0.928 30, 37
Daucus carota 2.265 27, 29, 37
Heracleum sphondylium −6.828 18
Petroselinum crispum 2.719 27
Scandix cerifolium 1.813 27
Asterales Asteraceae Aster x frikartii 1.153 30
Lactuca sativa 0.159 15, 24, 25, 26, 27, 29, 36
Helianthus annuus 2.862 29
Taraxicum officinales −6.828 17, 18
Cichorum intybus −6.828 27
Cichorum angustifolium 1.684 27
Dipsacales Dipsacaceae Dipsacus fullonium 1.096 34
Figure 1. Mean I concentration ratios for 47 different species of plants all grown under the same conditions. Plants were exposed to 125I for
4 h and above ground green shoots harvested and analyzed for 125I activity. Activities were then transformed to give a mean value of
0.075—the mean soil-to-plant concentration ratio recommended by the IAEA (2014) (n = 5, 1 × SE).
0.00 0.05 0.10 0.15 0.20 0.25 0.30 0.35 0.40 0.45 0.50
Iodi
ne
CR
Agronomy2015, 5 545
2.2. Taxonomic Influence on Relative Mean I Concentration
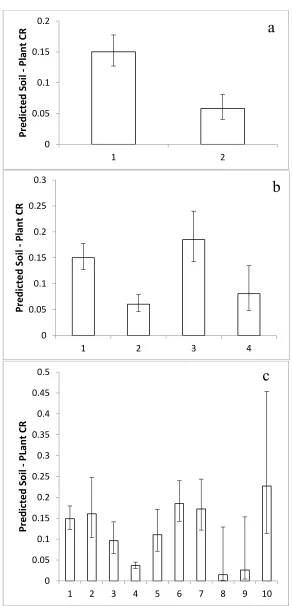
Although Q-Q normality plots showed that the REML-modeled mean iodine concentrations in Table 1 approached a normal distribution (Figure 2), they failed the Shapiro-Wilkes test primarily because of a few low values, mostly from study 27 (Heracleum sphondylium, Taraxacum officinale, and Cichorium intybus). Given that ANOVA is relatively robust to the assumption of normality and that there were other values from study 27 in the database, the whole dataset of 103 REML-modeled mean species values was used to analyze for taxonomic effects. Nested ANOVA coded with the APG III angiosperm phylogeny showed that REML-estimated relative mean I concentrations were significantly different between genera within families (Table 2) and between “Superorder”. Using unbalanced nested factors in ANOVA can produce artifacts so we used the same unbalanced taxonomic hierarchy to analyze 103 random numbers with a range of −6.83 to 3.71 (Table 3). This confirmed that, in the database we compiled, the significant nested differences we found were real, indicating that there are significant differences in iodine concentrations in plants associated with taxonomic categories above the species level. A T-test on REML-estimated data between the Monocots and Eudicots (“Classes”) indicated a highly significant difference between them (t = 2.88, df = 100, p = 0.005). Transformation of these values into CRs with a geometric mean of recommended IAEA values predicts significant differences between Monocots and Eudicots in CRs (Figure 3a). One-way ANOVA of REML-modeled values showed that there were significant differences between the Lilianae, Rosanae, Caryophyllanae and Asteranae (F = 2.95, p = 0.037) and produced predictions of significantly different mean CRs for these
“Subclasses” (Figure 3b). At the ordinal level, when Orders with 3 or fewer species were excluded,
there were significant differences between Orders (F = 2.05, p = 0.045). The Poales (incl. cereals and relatives), Asparagales (incl. onions and relatives), Caryophyllales (incl. beets and their relatives) and Lamiales (incl. mints and their relatives) had I concentrations significantly higher than the Malphigiales (flax and its relatives) and the Apiales (incl. carrot and its relatives) (F = 2.05,
p = 0.045), again allowing us to predict significant differences in CR for these orders (Figure 3c). For
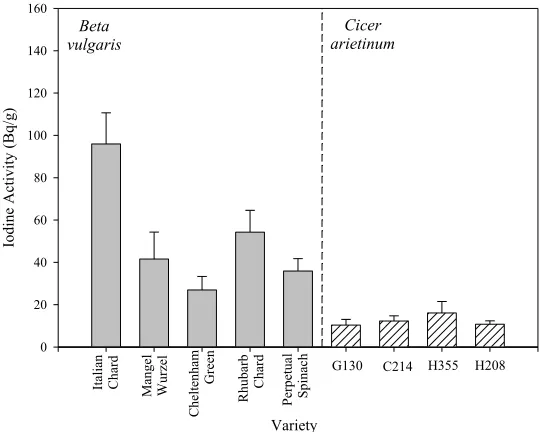
Beta vulgaris one-way ANOVA showed that there were significant differences between varieties (p = 0.002, F = 6.544), Holm–Sidak tests indicating that Italian Chard had significantly higher concentrations than Mangel–Wurzel, Cheltenham Green and Perpetual Spinach (Figure 4). There were no inter-varietal differences in the concentrations of 125I in the C. arietinum varieties (Figure 4).
Table 2. Results of nested ANOVA of Residual Maximum Likelihood (REML)-modeled concentrations of iodine. Concentrations of 103 species of plants were analyzed using nested taxonomic units as factors—“Subclass” was nested within “Class”, then
“Superorder” within “Subclass” within “Class” and so on. A general linear model that
excluded the intercept was used.
Factor df SS %SS Cumulative SS MS F p-value
“Class” 2 38.28 4.80 4.02 19.14 6.26 0.053
“Subclass” 3 7.37 0.92 5.72 2.45 2.53 0.136
“Superorder” 3 1.96 0.24 5.97 0.65 0.15 0.928
Order 12 48.21 6.05 12.02 4.01 1.03 0.494
Family 12 50.37 6.32 18.34 4.19 0.82 0.623
Genus 45 239.06 30.0 48.34 5.31 2.78 0.004
Species 24 45.79 5.74 54.09 1.90 0.35 0.895
[image:10.596.90.511.168.304.2]Residual 98 365.78 45.90 100
Table 3.Results of nested ANOVA of random numbers. Random numbers between −6.83 and 3.70 for 103 species of plants were analyzed using the same taxonomy as for Table 2.
Factor df SS %SS Cumulative SS MS F p-value
“Class” 2 67.16 3.32 3.32 33.58 2.85 0.211
“Subclass” 3 35.57 1.76 4.08 11.86 1.39 0.358
“Superorder” 3 24.71 1.22 6.30 8.23 0.64 0.603
Order 12 157.34 7.78 14.08 13.11 1.19 0.394
Family 12 129.00 6.38 20.45 10.75 1.28 0.254
Genus 45 355.43 17.57 38.02 7.89 0.78 0.774
Species 24 244.65 12.09 50.12 10.19 14.62 0.204
Residual 98 1009.18 49.88 100
[image:10.596.65.531.351.699.2] [image:10.596.68.525.353.705.2]Agronomy2015, 5 547
Figure 3. The mean Concentration Ratios predicted in angiosperm taxa according to the phylogeny of APG III (2009). (a) “Class”, 1 = Monocots (n = 28), 2 = Eudicots (73); (b) “Subclass”, 1 = Lilianae (n = 28), 2 = Rosanae (n = 30), 3 = Caryophyllanae (n = 11), 4 = Asteranae (n = 31); (c) Order. 1 = Poales (21), 2 = Asparagales (4), 3 = Fabales (n = 10), 4 = Malphigiales (n = 5), 5 = Brassicales (n = 7), 6 = Caryophyllales (n = 11), 7 = Lamiales (n = 12), 8 = Solanales (n = 4), 9 = Apiales (n = 5), 10 = Asterales (n = 6).
0 0.05 0.1 0.15 0.2 1 2 Pred icted Soil -Pla nt CR
a
0 0.05 0.1 0.15 0.2 0.25 0.31 2 3 4
Pred icted Soil -Pla nt CR
b
0 0.05 0.1 0.15 0.2 0.25 0.3 0.35 0.4 0.45 0.51 2 3 4 5 6 7 8 9 10
[image:11.596.152.444.67.673.2]Figure 4. Mean I activities of shoots in varieties of seven-week-old Beta vulgaris and
Cicer arietenum exposed to an acute dose of 125I. (n = 5, SEs).
2.3. Comparison of Taxonomic Effects
In total about 12% of the variance in I concentrations was accounted for by ranks of Order (Table 2). This is greater than the influence on N (3.3%) and P (6.8%), [16], but less than that for Cs (23.3%) [17], Pb (20%), Cr (24%), Cu (24%), [11], Na (23%) [16], Cd (27%) [11], Zn (44%), Ni (46%) [11], K (49%) [16], and Ca (63%) [15]. Of the elements for which phylogenetic influences have been detected, I is most closely related to Cl. In the only published analysis of relative mean concentration for Cl [18] there are 24 species that are also in Table 1. There was no correlation between relative mean I and Cl values in these species.
3. Discussion
Table 1 and Figure 1 indicate that there is a wide range of I concentrations between plant species. They confirm the existence of inter-species differences in I concentrations of sufficient magnitude to support previous suggestions that crop species might be as important as soil type in determining I concentrations in crop plants [21]. For elements in which there are very small phylogenetic influences above the species level there is very little variance attributable to taxonomic levels above the species. Table 2 shows that there is a phylogenetic influence on inter-species differences in iodine concentration, especially for Genera within Families. Figure 4 indicates that inter-varietal differences in I concentrations do occur, strengthening the assertion that there is nothing especially significant about the species as a taxonomic unit to describe inter-taxa differences in I concentrations in plants. These observations suggest, for the first time, (a) that angiosperm phylogeny influences the I concentrations of plants; (b) that the species is not an independent sampling unit for I concentrations in plants; and (c) that it might be possible to make general predictions of relative I concentrations in food crops based on phylogeny. If correct, such insights are potentially useful for understanding the agricultural chemistry and food toxicology of I.
Variety Iodine Acti vit y (Bq/g ) 0 20 40 60 80 100 120 140 160 Ital ian Ch ar d M an gel W ur zel Ch elt en ham Gr een Rh ub ar b Ch ar d Per petual Sp
inach G130 C214 H355 H208
Cicer arietinum Beta
[image:12.596.162.432.84.300.2]Agronomy2015, 5 549
The validity of the general insights above, however, depends on a number of assumptions about the relative mean concentrations reported in Table 1. First, a high proportion of the data in Table 1 are from experiments with 125I. There is no evidence of discrimination between I isotopes during plant
uptake and 125I has previously been used as a proxy for other I isotopes in uptake experiments [22], so
we assume that the data for 125I are very likely to represent the behavior of I isotopes of more
agricultural and toxicological significance. Second, it is likely that the acute exposures to I used to generate much of the data in Table 1 will not produce exactly the same relative mean concentrations in plants as chronic exposures. However, much nutrient uptake takes place during the exponential phase of growth when our plants were exposed so we assume that our observations will approximate inter-species differences that might be found following chronic exposures. Nevertheless the data in Table 1 may be more directly relevant to acute exposures to 129I (which can be radioecologically
significant, for example, during pulsed movement up through soil profiles [6]) than to long-term uptake of 127I. And third, it is important to acknowledge that the relative mean concentrations between
plant species reported in Table 1 might not be the same under all environmental conditions, i.e., there might be an interaction between environment and inter-species differences. Despite these assumptions, it is notable that similar observations to those we make above for I have been reported for numerous other elements using a variety of isotopes, exposure times and environmental regimes [11,14–18]. Thus, given that it is the most taxonomically wide-ranging database yet reported for inter-species differences in plant I concentrations and that it is compatible with results for other elements, Table 1 provides a basis for initiating assessments of the influence of phylogeny on I concentrations in plants. There have been detailed studies of the translocation of I in plants and its partitioning between plant parts [22], which clearly affect I concentrations in food stuffs. As the data in Table 1 focuses on green shoots in toto, phylogenetic influences identified might provide background concentrations upon which internal partitioning is imposed.
If there is no effect of phylogeny on inter-species differences in uptake then, as is approximately the case for N and P [16], there will be no variance associated with taxonomic levels above the species. This is not the case for I and we conclude that Tables 1 and 2 show that there is an influence of phylogeny on differences in I concentrations between plant species. This gives further support to the assertion that particular taxa of plants have characteristic mineralogies and that a phylogenetic perspective on plant contribution to the transfer of elements in the soil-crop system might be useful [16]. A phylogenetic influence also means that plant species are not independent sampling units for I, i.e., great care must be taken in statistical analysis of I transfer in the soil-crop system as many techniques, such as regression, make the assumption that samples from different species are independent. In contrast to the frequency distribution of relative concentrations of some elements [15], I concentrations in plants are not normally distributed. This indicates that the parametric statistics often used in soil-crop transfer analysis must be used with care in analyses with numerous species. Normal distributions of phenotypes are often characteristic of polygenic, “quantitative”, traits. Quantitative techniques, such as the Quantitative Trait Loci analysis used to locate genes impacting on the concentration of other elements in plants [29,30] might have to be used with care for analysis of the genetic factors affecting the I chemistry of crops.
case with some other elements [16,17], there is a significant difference in I concentration between Monocot and Eudicot plants. Of Orders with significant numbers of food crops the analysis reported here indicates that plants in the Poales (cereals and relatives), Asparagales (onions and relatives), and Caryophyllales (beets, amaranths, buckwheat and relatives) might have higher than average I concentrations. These Orders might worth further investigations if explanations for dietary loadings of I are being sought, particularly as some of these Orders are represented by few species in Table 1. Further investigations might, for example, test the suggestion that at a given soil availability of I, cereal grains such as amaranths and buckwheat might provide higher I concentrations than grains such as wheat or rice. These effects might be used to expand the reported general pattern of I concentrations in foodstuffs of legumes > vegetables > fruit [31] because they suggest that there are groups of plants with significantly higher I concentrations than legumes.
Figure 4 suggests that although there might be some inter-varietal differences in I concentrations in some crops, they might be small compared to inter-specific differences. This supports conclusions of previous studies with numerous varieties of clover, grasses and other herbage crops [23,25,32]. Nevertheless, further analyses might very usefully compare the amount of variation above and below the species level in order to determine the extent to which I concentrations in plant biomass can be altered by choosing different varieties or different species. The phylogenetic effects described above have some similarity to those we have reported for Cl [18], especially the higher than average values in the Caryophyllales. However, we found no direct correlation in relative mean values for 24 species that occur in both data sets. It might be interesting to investigate, using a dataset with more species, if this lack of correlation reflects real differences in the behavior of I and Cl.
In the database compiled here, loge-transformed values subject to REML-modeling are approximately
normally distributed. Using the IAEA recommended value and back transforming modeled values to CRs, confirms the loge-normal distribution of I concentrations in plants and enables us to predict
geometric mean CRs for different plant groups and 95% confidence intervals (Figure 2). These suggest that significantly improved predictions of CR for radioiodine can be made by taking taxonomic group into account, with splitting the recommended CR into two, one for Monocots and one for Eudicots, bringing about a significant improvement in predicted CR very simply (Figure 2a). Such overall predictions for groups of many species are very useful in the case of a contamination event in which many Monocots and Eudicots might be contaminated simultaneously. In different ecosystems that have different proportions of Monocots and Eudicots, the predicted CRs in Figure 2 could significantly improve predictions of overall radioiodine transfer from soils to plants.
Agronomy2015, 5 551
4. Experimental Section
4.1. Plant Growth
For each of the 47 species, 5 replicates, in 12 cm pots, each filled with 250 g of Levington’s F2S compost (Fisons, Ipswich, UK) (Table 1), were grown for approximately 7 weeks, i.e., to the exponential phase of growth and before anthesis, in a greenhouse with 16 h day and 8 h night at
ca. 24 °C and 16 °C, respectively. The 47 species were radiolabeled in 7 experimental sets (“studies”) (Table 1). Forty-seven species were selected to provide a spread across the angiosperm phylogeny. In addition, 5 replicates of each of 5 additional varieties of Beta vulgaris and 4 additional varieties of
Cicer arietinum were also radiolabeled—which gave 54 taxa in total. Five replicates of Carex nigra,
Canna indica, Geranium pratense, Euphorbia myrsinites and Linum lewisii were labeled in two experimental blocks to provide linking species between blocks. Seeds were supplied by Chiltern Seeds (Cumbria, UK), Kings Seeds (Essex, UK) and the Institute for Crop Research in the Semi-Arid Tropics (Patencheru, Telangana, India).
4.2. Radiolabeling with 125I
Following trial experiments to establish appropriate labeling volumes, carriers, activities and exposures, 50 mL of 50 M KI radiolabeled with 74 kBq of 125I were added to each pot. During
radiolabeling, replicate pots of each species were arranged in a randomized block design in an arena in the laboratory with artificial lighting at ca. 350 E −2s−1. Pots were not watered for 24 h prior to
radiolabeling and were placed in the arena with the lights on at least 1 h before the addition of radioactivity. Entire green shoots were harvested 1 cm above soil level 4 h after the radiolabel was added, dried for at least 48 h at 80 °C and then ground up. Ground plant samples were analyzed for
125I emissions, with appropriate calibrations and blanks, on an LKB Wallac Compugamma “1282”
(NaI (Tl) detector).
4.3. Residual Maximum Likelihood Analysis (REML)
statistically. Raw data were loge-transformed before REML analysis. REML analysis can produce
negative as well as positive values [33] and was run on the statistical package SPSS.
4.4. Analysis of Taxonomic Effects
Following REML analysis, the mean I concentrations in species were analyzed using an unbalanced hierarchical Analysis of Variance (ANOVA) coded with the angiosperm phylogeny group III [34]. The nominal designations of “Class”, “Subclass” and “Superorder” were used for categories above the Order, although their application to recent phylogenies is unresolved. Tests for normality of I concentrations using the Shapiro–Wilkes test, and all ANOVAs were carried out on SPSS v 22.0 for Mac (SPSS, Armonk, New York, USA).
Acknowledgments
We would like to thank Judy Brown, Roy Bennet and Janine Wilkins of the University of the West of England (UK) for radioanalytical support, the Natural Environment Research Council, the Environment Agency and the Nuclear Decommissioning Authority (all UK) who provided financial support through the RATE programme and ICRISAT, Telengana, India for chickpea varieties.
Author Contributions
Eleni Siasou compiled the database. Eleni Siasou and Neil Willey analyzed the data and wrote the manuscript.
Conflicts of Interest
The authors declare no conflicts of interest.
References
1. Zhu, Y.-G.; Huang, Y.-Z.; Hu, Y.; Liu, Y.-X. Iodine uptake by spinach (Spinacia oleracea L.) plants grown in solution culture: Effects of iodine species and solution concentrations. Environ. Int.2003, 29, 33–37.
2. Sheppard, S.C. Interpolation of solid/liquid partition coefficients, Kd, for iodine in soils.
J. Environ. Radioact.2003, 70, 21–27.
3. Welch, R.M.; Graham, R.D. A new paradigm for world agriculture: Meeting human needs—Productive, sustainable, nutritious. Field Crops Res.1999, 60, 1–10.
4. Zimmermann, M.B.; Andersson, M. Prevalence of iodine deficiency in Europe in 2010.
Ann. Endocrinol. 2011, 72, 164–166.
5. Fréchou, C.; Calmet, D. 129I in the environment of the La Hague nuclear fuel reprocessing
plant—From sea to land. J. Environ. Radioact.2003, 70, 43–59.
Agronomy2015, 5 553
7. Sheppard, M.; Thibault, D.H. Default soil solid/liquid partition coefficients, Kds, for four major
soil types: A compendium. Health Phys.1990, 59, 471–482.
8. Sheppard, S.C.; Motycka, M. Is the Akgare phenomenon important to iodine uptake by wild rice (Zizania aquatica)? J. Environ. Radioact.1997, 37, 339–353.
9. White, P.J.; Broadley, M.R. Chloride in soils and its uptake and movement within the plant.
Ann. Bot. 2001, 88, 967–988.
10. Ban-Nai, T.; Muramatsu, Y. Transfer factors of radioiodine from volcanic-ash soil (Andosol) to crops. J. Radiat. Res.2003, 44, 23–30.
11. Broadley, M.R.; Willey, N.J.; Mead, A. A method to assess taxonomic variation in shoot caesium concentration among flowering plants. Environ. Pollut.1999, 106, 341–349.
12. APG (Angiosperm Phylogeny Group) II. An update of the Angiosperm Phylogeny Group classification for the orders and families of flowering plants: APG II. Bot. J. Linnean Soc. 2003,
141, 399–436.
13. Soltis, P.S.; Soltis, D.E.; Chase, M.W. Angiosperm phylogeny inferred from multiple genes as a research tool for comparative biology. Nature1999, 402, 402–404.
14. Broadley, M.R.; Willey, N.J.; Wilkins, J.; Baker, A.J.M.; Mead, A.; White, P.J. Phylogenetic variation in heavy metal accumulation in angiosperms. New Phytol.2001, 152, 9–27.
15. Broadley, M.R.; Bowen, H.C.; Cotterill, H.L.; Hammond, J.P.; Meacham, M.C.; Mead, A.; White, P.J. Variation in the shoot calcium content of angiosperms. J. Exp. Bot.2003, 54, 1–16. 16. Broadley, M.R.; Bowen, H.C.; Cotterill, H.L.; Hammond, J.P.; Meacham, M.C.; Mead, A.; White, P.J.
Phylogenetic variation in the shoot mineral concentration of angiosperms. J. Exp. Bot. 2004, 55, 321–336.
17. Willey, N.J.; Tang, S.; Watt, N. Predicting inter-taxa differences in plant uptake of 134/137Cs.
J. Environ. Qual.2005, 34, 1478–1489.
18. Willey, N.J.; Fawcett, K. Species selection for phytoremediation of 36Cl/35Cl using angiosperm
phylogeny and inter-taxa differences in uptake. Int. J. Phytoremediation2005, 7,295–306.
19. International Atomic Energy Agency. Handbook of Parameter Values for the Prediction of Radionuclide Transfer in Terrestrial and Freshwater Environments; Technical Report Series; IAEA: Vienna, Austria, 2010; p. 472.
20. Butler, G.W.; Johnson, J.M. Factors influencing the iodine content of pasture herbage. Nature 1957, 179, 216–217.
21. Moiseyev, I.T.; Tikhomirov, F.A.; Perevezentsev, V.M.; Rerikh, L.A. Role of soil properties, inter-specific plant differences, and other factors affecting the accumulation of radioactive iodine in crops. Sov. Soil Sci.1984, 16, 60–66.
22. Cline, J.F.; Klepper, B. Iodine-125 accumulation in plant parts: Influence of water use rate and stable iodine content of soil. Health Phys.1975, 28, 801–804.
23. Hartmans, J. Factors affecting the herbage iodine content. Neth. J. Agric. Sci.1974, 22, 195–206. 24. Sheppard, S.C.; Evenden, W.G.; Amiro, B.D. Investigation of the soil-to-plant pathway for I, Br,
Cl and F. J. Environ. Radioact.1993, 21, 9–32.
26. Kashparov, V.; Colle, C.; Zvarich, S.; Yoshenko, V.; Levchuk, S.; Lundin, S. Soil-to-plant halogen transfer studies. J. Environ. Radioact.2005, 79, 187–204.
27. Bourchet, M.P. Sur l’absorption de l’iode par les végétaux. Acad. Sci. Paris 1899, 129,
768–770.
28. Dai, J.L.; Zhu, Y.G.; Zhang, M.; Huang, Y.Z. Selecting Iodine-Enriched Vegetables and the residual effect of iodate application to soil. Biol. Trace Elem. Res.2004, 101, 265–276.
29. White, P.J.; Bowen, H.C.; Willey, N.J.; Broadley, M.R. Selecting plants to minimise radiocaesium contamination of food chains. Plant Soil 2003, 249, 177–186.
30. Payne, K.C.; Bowen, H.C.; Hammond, J.P.; Hampton, C.R.; Lynn, J.R.; Mead, A.; Swarup, K.; Bennett, M.J.; White, P.J.; Broadley, M.R. Natural egentic variation in caesium (Cs) accumulation by Arabidopsis thaliana. New Phytol. 2004, 162, 535–548.
31. Johnson, C.C.; Fordyce, F.M.; Stewart, A.G. Environmental Controls in Iodine Deficiency Disorders; Project Summary Report, CR/03/058N; British Geological Survey: Keyworth, UK, 2003.
32. Crush, J.R.; Caradus, J.R. Cyanogenesis potential and iodine concentration in white clover (Trifolium repens L.) cultivars. N. Z. J. Agric. Res.1995, 38, 309–316.
33. Thompson, R.; Welham, S.J. REML analysis of mixed models. In The Guide to Genstat, Part 2—Statistics; Payne, R.W., Ed.; VSN International: Oxford, UK, 2001; pp. 413–503.
34. Chase, M.W.; Reveal, J.L. A phylogenetic classification of the land plants to accompany APG III.
Bot. J. Linnean Soc.2009, 161, 122–127.