Towards Provisioning of Real-time Smart City Services
Using Clouds
Kamran Soomro, Zaheer Khan and Khawar Hasham
Department of Computer Science and Creative Technologies Faculty of Environment and Technology
University of the West of England Bristol, UK
{kamran.soomro, zaheer2.khan, mian.ahmad}@uwe.ac.uk
ABSTRACT
ICT is becoming an enabler for smart city applications by making effective use of various data resources generated daily in an urban environment. Mostly this data is utilised by city authorities for city planning purposes and often citi-zens become indirect beneficiaries of such applications. In this paper we present an algorithm for real-time processing of streaming data from multiple sources. We also present the design and proof of concept of an application that per-forms mining and analysis of open data available through city portals and social networks and generates an informa-tion service in real time for use by city administrainforma-tions. The prototype utilises streaming data from Twitter and open data from Bristol to demonstrate a hypothetical scenario using Apache Storm. The output is presented in the form of visual maps using OpenStreetMaps as a backend and the prototype highlights various challenges which are discussed in detail.
CCS Concepts
•Computing methodologies→ Distributed comput-ing methodologies;•Computer systems organization
→Real-time systems;
Keywords
cloud computing; storm; social media mining
1.
INTRODUCTION
ICT is becoming one of the enablers of smart cities, also known as ubiquitous cities [6]. The increasing urban pop-ulation [2] [15] and myriad city sustainability and planning challenges [11] [1] need timely information intelligence for decision making. In this respect, the ubiquitous nature of Internet of Things (IoT) and crowd sourcing provide a greater opportunity to cities to monitor the state of the urban environment in near real time and take decisions.
Permission to make digital or hard copies of all or part of this work for personal or classroom use is granted without fee provided that copies are not made or distributed for profit or commercial advantage and that copies bear this notice and the full cita-tion on the first page. Copyrights for components of this work owned by others than ACM must be honored. Abstracting with credit is permitted. To copy otherwise, or re-publish, to post on servers or to redistribute to lists, requires prior specific permission and/or a fee. Request permissions from [email protected].
UCC ’16, December 06-09, 2016, Shanghai, China
c
2016 ACM. ISBN 978-1-4503-4616-0/16/12. . . $15.00 DOI:http://dx.doi.org/10.1145/2996890.3007860
These IoTs and crowd sourcing activities by citizens gen-erate huge amounts of socio-economic and urban footprint data [5] which requires fast processing and storage capa-bilities. Though city administrations are becoming more equipped with new technologies, processes and tools to ef-fectively utilise city data, near real-time processing and de-cision making has still largely been neglected. To acquire this capability, cities need a suitable digital infrastructure to collect, manage, process and generate useful information to make near real-time decisions. On the one hand such capability will enable cities to respond to critical events or citizens’ queries or concerns immediately. On the other hand new information services can be designed and developed to meet the requirements of different stakeholders resulting in wider adoption of smart city solutions.
Processing of data in nearly real time using distributed technologies e.g. cloud computing, is not new and notable technologies exist e.g. Apache Storm [14]. In our previous work [5] we tried to use Apache Hadoop and Apache Spark to show the potential of processing large city data in batch processing mode. However, there is limited literature evi-dence that real time processing has been tested for smart city applications with the objective to process Big smart city data in near real-time to respond to application specific queries. In this respect this paper aims to extend the pre-viously defined architectural framework to process real-time stream data from social networks using Apache Storm in a cloud environment and present results in visual form using OpenStreetMaps. A use case on urban congestion is defined where real-time data is acquired from different sources to process it using Storm. A distributed data processing algo-rithm is also presented that processes real-time data from multiple sources. This algorithm illustrates a novel applica-tion of the architecture discussed in Secapplica-tion 3. It shows how the architecture can be used to develop a real-time data processing platform for user consumption. A basic proof of concept is implemented by combining a Twitter stream with other open data (e.g. Bristol open data and Open-StreetMaps). The aim here is to demonstrate a basic sce-nario that processes a real-time data stream and generates useful information for decision making.
application is presented in Section 6. Results of the experi-ments are presented followed by conclusions in Section 7.
2.
RELATED WORK
The increase in amount of data also increases the data processing complexity. With ever advancing technologies at hand, this requires intelligent use of resources for efficient data processing. In case of an ubiquitous city (u-city) or smart city, this becomes more helpful as it provides the pol-icy makers with more data sources to extract the data from and make intelligent decisions promptly. There have been a few research initiatives such as [8] in the urban planning and Smart city domains which are employing cloud comput-ing to facilitate data processcomput-ing. The U-City middleware provides a variety of integrated and intelligent smart city services to its applications. Its Smart Ubiquitous Middle-ware (SmartUM), which is the data processing tier, employs cloud computing in order to discover, deploy and execute services based on the provided context. This architecture does not support external data sources and also real-time data stream processing.
Jong et al. [12] proposed the use of cloud computing for GIS image processing. It not only increases the ease of use for a user but also hides the underlying complexities. It uses OpenNebula, a cloud middleware, to provide VMs with spe-cific images and a virtual networking environment. This re-search group also presented the use of cloud computing with modified MapReduce jobs to visualize urban air pollution, which requires a lot of computation power [13]. Nonetheless, this approach does not harness the power of cloud comput-ing for real-time data processcomput-ing, which is the case presented in our approach. Moreover, it focuses on one data source only. To the contrary our approach provides mechanism to support heterogeneous data sources.
Many city governments now use real-time analytics to manage aspects of how a city functions and is regulated [7]. For example, the Centro De Operacoes Prefeitura Do Rio1 in Rio de Janeiro, Brazil, a partnership between the city government and IBM, have created a citywide instrumented system that draws together data streams from thirty agen-cies, including traffic and public transport, municipal and utility services, emergency services, weather feeds, and in-formation sent in by employees and the public via phone, internet and radio, into a single data analytics centre. Sim-ilarly, the Office of Policy and Strategic Planning for New York city has sought to create a one-stop data analytic hub to weave together data from a diverse set of city agencies in order to try and manage, regulate and plan the city more efficiently and effectively.
There is another project, developed by CASA at UCL, for London1 that enables citizens to find out real-time in-formation about the weather, air pollution, public transport delays, public bike availability, river level, electricity demand and the stock market etc. It also analyzes the Twitter data and presents trends in the city. Although it supports real-time data processing, it is not clearly known whether they are using cloud-based real-time data stream processing tech-niques. Moreover, it does not provide any means to link different data sources to perform data analysis. Another paper [3] proposed the use of Twitter activity and tweets metadata to estimate the urban land usage by using
un-1
http://citydashboard.org/london/
Data$and$ Metadata$(RDF$
Storage)$
Data Acquisition, Analysis and Filtering Layer Resource data mapping and linking Layer
Interactive Explorer Layer
Data$Source$
Classifica8on$ Data$Cleansing$ CA$ Anlay8c$Engine$
Data$Mapping$ Data$Browser$
[image:2.612.317.558.54.190.2]Service$Composi8on$
Figure 1: Proposed Architectural Design
supervised learning techniques. It obtains the tweets from the Twitter streaming API and filters the tweets for which the geolocation data is recorded by Twitter. From these tweets, it extracts the geolocation information which is then mapped on to the area under study. Unlike these projects, the proposed system in this paper not only provides support for the real-time processing of data, including social media data, using cloud frameworks such as Apache Storm, but it also provides an abstraction layer using semantic informa-tion to deal with heterogeneous data sources. The use of semantic information also helps in establishing a mapping between these heterogeneous data sources that aids in per-forming cross-thematic data analysis.
3.
ARCHITECTURE
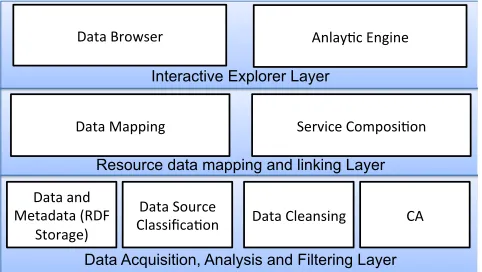
We have previously presented an architecture for smart city related big data analysis [5]. The guiding principle for the design of this architecture for a cloud-based analytic service is to reuse existing, well-tested tools and techniques. The system architecture, as shown in Figure 1, is divided into three tiers to enable the development of a unified knowl-edge base. Each layer represents the potential functionality that we need to meet the overall research objectives. The lowest layer in the architecture consists of distributed and heterogeneous repositories and various sensors that are sub-scribed to the system. The objective of this layer is data acquisition, cleansing and classification using standard ap-proaches such as APIs or OGC (Open Geospatial Consor-tium) compliant web services.
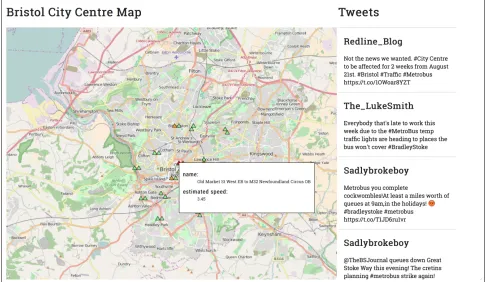
Figure 2: Prototype web interface
level services and mashups can be composed to browse and make use of this data for interesting scenarios.
An analytic engine in top layer processes the data for ap-plication specific purposes. The engine utilises the data that is available in the linked data layer and helps users in submit-ting queries, application specific algorithms and workflows to find information from the data repositories.
4.
USE CASE
One of the major challenges that city governments face in effective governance is to respond to extraordinary events in a timely and effective manner. To do so they require access to real-time information about the on-going events that is updated frequently. One way to provide this information is to crowd-source it using various social media platforms such as Twitter, Facebook etc. For example, if there is some un-foreseen congestion in a particular area of the city, the gov-ernments can ask people to tweet/post information about the event using a particular hashtag that the government can then track. To do so they would require an intuitive vi-sualisation platform that shows them the information along with relevant context to help them formulate an appropriate response. As an example consider a hypothetical scenario where an accident has occurred in the city centre. The gov-ernment can mine Twitter activity about the event using a tool that shows them all the tweets related to the event geolocated on a live congestion map of the city. That way they can decide which tweets are potentially the most ac-curate and useful. Analysing the tweets would enable them to plan and respond appropriately in near real-time. As a bonus the government may also retrospectively look back at all the tweets related to the event and pre-emptively
formu-late response plans for similar events in the future. Mining social media platforms such as Twitter would enable them to acquire information that otherwise may not be possible for them to acquire without spending considerable time and effort.
5.
ALGORITHM
Algorithm 1Distributed data processing algorithm. 1: S: set of real-time data streams
2: W: set of distributed cloud worker nodes
3: procedureProcess(S) 4: R← ∅
5: for allw∈W, s∈S do
6: r←Assign(s, w) 7: Append(R, r)
8: end for
9: returnR
10: end procedure
from those streams can be processed. For example, tweets from a Twitter stream can be auto-summarised, analysed for information content or they can undergo sentiment analysis. The results can be collected and returned by this algorithm for further processing, e.g. displaying in a presentation layer.
6.
EXPERIMENTAL SETUP AND RESULTS
Previously we demonstrated how a cloud-based data pro-cessing system could enable the provision of smart city ser-vices in a city. We compared two implementations; a Hadoop-based and a Spark-Hadoop-based one. In this paper we explore how a similar infrastructure could help in the provision of real-time services in a smart city context by using Apache Storm. To achieve this a variant of the hypothetical use case pre-sented in Section 4 was developed. Currently there is a MetroBus construction project underway in Bristol designed to develop high capacity public transport2. One side effect of this project is that there are major roadworks going on in different parts of the city, causing traffic congestion and delays. It is important for the Bristol City Council to be aware of public sentiment and also to keep an eye on the delays caused to ensure that they do not become too much of a hindrance for daily life. Our proposed application can help the council achieve these goals. Figure 2 shows the web interface we developed. On the left is a congestion map of traffic in Bristol City Centre updated in real-time. On the right are tweets that contain the hashtag#metrobus origi-nating from Bristol. Presenting a bird’s eye view like this allows the council to keep track of what people are saying about the project and also correlate that visually with the level of congestion in different areas. For example, if there is a high level of congestion in a particular area at 8:30 am every day causing drivers in that area to be unhappy with the situation, the council can take steps to make alterna-tive arrangements for the travellers. Moreover, they could also correlate this information with air quality data to deter-mine whether the congestion is causing too much pollution. Another advantage is that in emergency situations, such an interface allows city planners and emergency respondents to gather additional intelligence in real-time about events happening in a particular area that may not be available otherwise.
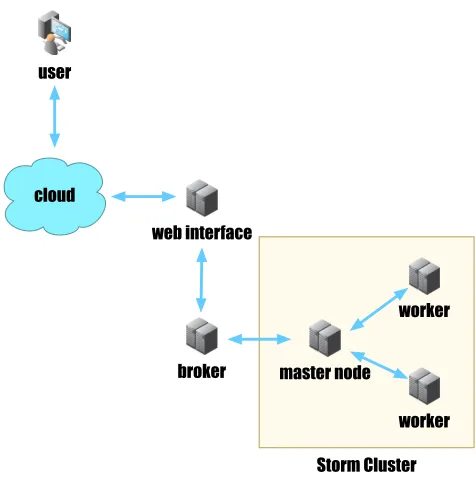
The aforementioned web application is part of a larger ex-perimental infrastructure, shown in Figure 3 and discussed subsequently. Besides Twitter, the dataset used consisted of live congestion data obtained from the Bristol Open Data Portal3. The data was accessed from the portal using the Socrata Open Data API (SODA API)4 For the data
pro-cessing we set up an Apache Storm cluster [14]. The clus-ter consisted of two worker nodes and one masclus-ter node, all running Storm 1.0.1. The cluster was set up using virtu-alisation on a Dell PowerEdge R415 server with anAMD
Opteron 4332 HE hexa-core processor and 64GB RAM. For this application, the Storm topology that was set up con-sisted of two bolts and two spouts; one of each for Twitter and the Bristol Open Data portal. Since the overall idea
2
The Bristol MetroBus Project [Last accessed: 10 August, 2016] https://www.bristol.gov.uk/streets-travel/ metrobus-bus-rapid-transit-brt
3The Bristol Open Data Portal [Last accessed: 10 August,
2016] https://opendata.bristol.gov.uk
4The SODA API [Lass accessed: 21 September, 2016]
https://dev.socrata.com/consumers/getting-started.html
Storm Cluster master node
worker
broker web interface user
cloud
[image:4.612.318.556.49.291.2]worker
Figure 3: Experimental setup.
was to geo-locate tweets related to a particular event in the Bristol City Centre and display them superimposed over a congestion map of the centre, it was necessary to provide a visual interface. We used the OpenLayers 3 API5 with OpenStreetMaps as the back end to develop a web-based interface for our application.
At this point we faced a challenge. How do we connect the visual interface layer comprising of the OpenLayers interface with the data produced by our Storm infrastructure? To solve this problem we used the WebSockets API to transfer the data produced by the Storm topology to the web inter-face. However this created a new challenge for us. Since the web interface could only act as a WebSocket client, the servers had to be located elsewhere. The most logical loca-tion for the servers would be within the Storm bolts. How-ever, the workers could be scheduled to any machine and it was impossible to know beforehand which machines they would go to. We solved this problem by setting up a bro-ker server responsible for receiving the data consisting of tweets and congestion information from the Storm topology through conventional sockets and serving it to the web inter-face through WebSockets. Since the location of the broker was static and known to both the Storm topology as well as the web interface, we managed to establish a channel of communication between the two via the broker.
Another challenge we faced was that GPS devices are only accurate to a certain degree. Because of this margin of error, some of the coordinates received did not actually correspond to streets and/or roads. To overcome this we used map matching using the Open Source Route Matching project (Project OSRM) implementation of the Graphhopper algo-rithm [4, 9, 10]. This allowed us to correlate the tweets and congestion information with the nearest available street for a more accurate and meaningful visual representation.
5The OpenLayers 3 API [Last accessed: 10 August, 2016]
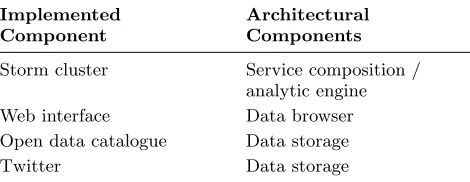
Table 1: Mapping experimental setup components to architectural components.
Implemented Component
Architectural Components
Storm cluster Service composition / analytic engine Web interface Data browser Open data catalogue Data storage Twitter Data storage
The aforementioned experimental setup encompasses sev-eral layers in the proposed architectural model, shown in Table 1. The Storm cluster, as it performs the analysis by retrieving data from the relevant stores and combining them, fits in the service composition and analytic engine compo-nents. The web interface presents the data visually to the user so it acts as a data browser. The open data catalogue and twitter are the sources of data so they are data storage media.
7.
SUMMARY AND CONCLUSIONS
This paper presents a prototype application of a generic architecture we presented previously. The application at-tempts to explore the applicability of the architecture for real-time data processing with the objective of providing real-time smart city services. To test this applicability we have developed a use case that involves city governments responding to emergency situations. Such extraordinary events often require quick decision-making and we argue that the provision of real-time information can enhance the effectiveness of this process. An algorithm to this effect is presented and implemented as a prototype. In the case of this prototype, the information is provided by tapping into sources of real-time data such as Twitter and open data por-tals and combining them. For the purposes of this prototype we used traffic congestion information from the Bristol Open Portal. The results are visualised in a web interface using OpenStreetMaps as a backend.
Future directions of research could include injecting ad-ditional sources of data such as Facebook and calculating additional statistics to test the scalability of the applica-tion. Moreover, we can also measure the execution time for various analysis for various data loads.
8.
REFERENCES
[1] D. Bandyopadhyay and J. Sen. Internet of things: Applications and challenges in technology and standardization.Wirel. Pers. Commun., 58(1):49–69, 2011.
[2] European Environment Agency. Urban sprawl in europe – the ingored challenge.Office for Official Publications of the European Communities, 2006. [3] V. Frias-Martinez and E. Frias-Martinez. Spectral
clustering for sensing urban land use using twitter activity.Engineering Applications of Artificial Intelligence, 35:237 – 245, 2014.
[4] J. S. Greenfeld. Matching gps observations to
locations on a digital map. InTransportation Research Board 81st Annual Meeting, 2002.
[5] Z. Khan, A. Anjum, K. Soomro, and M. A. Tahir. Towards cloud based big data analytics for smart future cities.Journal of Cloud Computing, 4(1):1–11, 2015.
[6] Z. Khan, D. Ludlow, W. Loibl, and K. Soomro. Ict enabled participatory urban planning and policy development: The urbanapi project.Transforming Government: People, Process and Policy,
8(2):205–229, 2014.
[7] R. Kitchin. The real-time city? big data and smart urbanism.GeoJournal, 79(1):1–14, 2014.
[8] Y. W. Lee and S. Rho. U-city portal for smart ubiquitous middleware. InAdvanced Communication Technology (ICACT), 2010 The 12th International Conference on, volume 1, pages 609–613, Feb 2010. [9] D. Luxen and C. Vetter. Real-time routing with
openstreetmap data. InProceedings of the 19th ACM SIGSPATIAL International Conference on Advances in Geographic Information Systems, GIS ’11, pages 513–516, New York, NY, USA, 2011. ACM.
[10] V. Nallur, A. Elgammal, and S. Clarke.Smart Route Planning Using Open Data and Participatory Sensing, pages 91–100. Springer International Publishing, Cham, 2015.
[11] M. Naphade, G. Banavar, C. Harrison, J. Paraszczak, and R. Morris. Smarter cities and their innovation challenges.Computer, 44(6):32–39, 2011.
[12] J. W. Park, C. H. Yun, S. g. Kim, H. Y. Yeom, and Y. W. Lee. Cloud computing platform for gis image processing in u-city. InAdvanced Communication Technology (ICACT), 2011 13th International Conference on, pages 1151–1155, Feb 2011. [13] J. W. Park, C. H. Yun, H. S. Jung, and Y. W. Lee.
Visualization of urban air pollution with cloud computing. In2011 IEEE World Congress on Services, pages 578–583, July 2011.
[14] R. Ranjan. Streaming big data processing in datacenter clouds.IEEE Cloud Computing, 1(1):78–83, May 2014.
[15] UN Habitat Report. Cities and climate change: Global report on human settlements.United Nations Human Settlement Programme, ISBN: 978-92-1-132298-9, 2011. http://mirror.unhabitat.org/pmss/