13 November 2012
Correction
Family Spending 2011 Edition
A Report on the Living Costs and Food Survey 2010
Certain data for Tables 4.3 and 4.5 were incorrect in this edition.
The data affected are the 2006 (old weights) data for the following three categories:
Other expenditure items Total expenditure
Average weekly expenditure per person (£) Total expenditure
Correct figures are now available. ONS apologises for any inconvenience caused.
Issued by:
Office for National Statistics Government Buildings Cardiff Road
Newport NP10 8XG Telephone:
2011
Family
Spending
A report on the 2010 Living Costs and Food Survey
Edition No.: 2011
Editor: Giles Horsfield
Office for National Statistics ii ISSN 2040-1647
A National Statistics publication
National Statistics are produced to high professional standards set out in the Code of Practice for Official Statistics. They are produced free from political influence.
About us
The Office for National Statistics
The Office for National Statistics (ONS) is the executive office of the UK Statistics Authority, a non-ministerial department which reports directly to Parliament. ONS is the UK government’s single largest statistical producer. It compiles information about the UK’s society and economy, and provides the evidence-base for policy and decision-making, the allocation of resources, and public accountability. The Director-General of ONS reports directly to the National Statistician who is the Authority's Chief Executive and the Head of the
Government Statistical Service.
The Government Statistical Service
The Government Statistical Service (GSS) is a network of professional statisticians and their staff operating both within the Office for National Statistics and across more than 30 other government departments and agencies.
Contacts This publication
For information about the content of this publication, contact the Living Costs and Food Survey
Tel 01633 455678
Email: socialsurveys@ons.gsi.gov.uk
Editor: Giles Horsfield
giles.horsfield@ons.gsi.gov.uk
Other customer enquiries
ONS Customer Contact Centre Tel: 0845 601 3034
International: +44 (0)845 601 3034 Minicom: 01633 812399
Email: info@statistics.gsi.gov.uk Fax: 01633 652747
Post: Room 1015, Government Buildings, Cardiff Road, Newport, South Wales NP10 8XG www.ons.gov.uk
Media enquiries
Tel: 0845 604 1858
Email: press.office@ons.gsi.gov.uk
Copyright and reproduction
© Crown copyright 2011
Published with the permission of the Office of Public Sector Information (OPSI)
You may use this publication (excluding logos) free of charge in any format for research, private study or internal circulation within an organisation providing it is used accurately and not in a misleading context. The material must be acknowledged as Crown copyright and you must give the title of the source publication. Where we have identified any third party copyright material you will need to obtain permission from the copyright holders concerned.
For re-use of this material you must apply for a Click-Use Public Sector Information (PSI) Licence from:
Office of Public Sector Information, Crown Copyright Licensing and Public Sector Information, Kew, Richmond, Surrey, TW9 4DU
Tel: 020 8876 3444
Contents
List of tables... v
List of figures ... xi
Introduction ... xvi
List of contributors ...
xiv
1: Overview
Overview...1
Household expenditure ... 2
Household expenditure by income... 3
Household expenditure by age ... 4
Household expenditure by economic activity and socio-economic classification... 6
Household expenditure by household composition ... 6
Household expenditure by region ... 6
Household income ... 7
Household income by age ... 8
Household income by region ... 8
Household income by economic activity and socio-economic classification... 9
Ownership of durable goods ... 9
2: Housing expenditure
Housing expenditure ...10
Background... 11
Definitions of housing expenditure... 11
Housing expenditure ... 12
Housing expenditure over time ... 13
Expenditure by gross income... 14
Expenditure by age of the household reference person ... 15
Expenditure by region ... 17
Expenditure by socio-economic classification... 20
Analysis of housing costs for renters and mortgage holders ... 21
3: Equivalised income
Equivalised income ...35
Background... 36
Equivalisation Methodology ... 36
Results ... 37
Household composition by income groups ... 38
Household expenditure by income... 41
Household expenditure by household composition and income ... 44
Sources of income ... 45
4: Trends in household expenditure
Trends in household expenditure over time ...73
Background... 74
Interpreting EFS/LCF time series data... 74
Household expenditure over time ... 75
5: Impact of the recession on household expenditure
Impact of the recession on household expenditure ...84
Executive Summary ... 85
Introduction ... 87
COICOP expenditure by OAC super group ... 93
Appendix A:
Household expenditure tables can be accessed by clicking on the table names in the appendixAppendix A...125
Appendix B: Methodology
Methodology ...130
Description and response rate of the survey ... 131
Uses of the survey ... 139
Standard errors and estimates of precision ... 140
Definitions ... 145
Regions of the United Kingdom ... 158
Change in definitions, 1991 to 2010 ... 159
Survey improvements ... 166
Weighting ... 166
Index to tables in reports on the FES/LCF ... 172
List of tables
1. Overview
Table 1.1 Expenditure by COICOP category and total household expenditure, 2010
United Kingdom ... 2
2. Housing expenditure
Table 2.1 Definition of total housing expenditure... 12 Table 2.2 Housing expenditure, 2008 to 2010 United Kingdom ... 24 Table 2.3 Housing expenditure by gross income decile group, 2010 United Kingdom... 25 Table 2.4 Housing expenditure by age of household reference person, 2010 United
Kingdom... 26 Table 2.5 Household expenditure by UK Countries and regions, 2010 ... 27 Table 2.6 Housing expenditure by socio-economic classification of household reference
person, 2010 United Kingdom ... 29 Table 2.7 Housing expenditure by household composition, 2010 United Kingdom... 31 Table 2.8 Expenditure on rent1 by renters, 2008 to 2010 United Kingdom... 32 Table 2.9 Expenditure on mortgages1 by mortgage holders, 2008 to 2010 United Kingdom .. 32 Table 2.10 Expenditure on rent and mortgages1 by renters and mortgage holders by gross
income decile group, 2010 United Kingdom ... 33 Table 2.11 Expenditure on rent and mortgages1 by renters and mortgage holders by UK
Countries and region, 2010 ... 34
3. Equivalised income
Table 3.1 Percentage of households by composition in each gross and equivalised income decile group (OECD –modified scale), 2010 United Kingdom ... 47
Table 3.2 Household expenditure by gross income decile group, 2010 United Kingdom ... 48
Table 3.2E Household expenditure by gross equivalised income decile group
(OECD-modified scale), 2010 United Kingdom ... 50 Table 3.3 Household expenditure as a percentage of total expenditure by gross
income decile group, 2010 (cont.) United Kingdom ... 52 Table 3.3E Household expenditure as a percentage of total expenditure by gross equivalised
income decile group (OECD-modified scale), 2010 United Kingdom ... 54 Table 3.4 Expenditure of one person non-retired households by gross income quintile
group, 2010 United Kingdom ... 56 Table 3.4E Expenditure of one adult non-retired households by gross equivalised income
quintile group (OECD-modified scale), 2010 United Kingdom... 57
Table 3.5 Expenditure of one person retired households not mainly dependent on state
pensionsby gross income quintile group, 2010 United Kingdom ... 58 Table 3.5E Expenditure of one person retired households not mainly dependent on state
pensions by gross equivalised income quintile group (OECD-modified scale), 2010 United Kingdom ... 59 Table 3.6 Expenditure of two adult households with children by gross income quintile
group, 2010 United Kingdom ... 60 Table 3.6E Expenditure of two adult households with children by gross equivalised income
quintile group (OECD-modified scale), 2010 United Kingdom... 61 Table 3.7 Expenditure of one adult households with children by gross income quintile
group, 2010 United Kingdom ... 62 Table 3.7E Expenditure of one adult households with children by gross equivalised income
quintile group (OECD-modified scale), 2010 United Kingdom... 63 Table 3.8 Expenditure of two adult non-retired households by gross income quintile group,
2010 United Kingdom ... 64 Table 3.8E Expenditure of two adult non-retired households by gross equivalised income
quintile group (OECD-modified scale), 2010 United Kingdom... 65 Table 3.9 Expenditure of one person retired households mainly dependent on state
pensionsby gross income quintile group, 2010 United Kingdom ... 66 Table 3.9E Expenditure of one person retired households mainly dependent on state pensions
by gross equivalised income quintile group (OECD-modified scale), 2010 United Kingdom ... 67 Table 3.10 Expenditure of two adult retired households mainly dependent on state pensions
by gross income quintile group, 2010 United Kingdom ... 68 Table 3.10E Expenditure of two adult retired households mainly dependent on state pensionsby
gross equivalised income quintile group (OECD-modified scale), 2010 United Kingdom ... 69 Table 3.11 Expenditure of two adult retired households not mainly dependent on state pensions
by gross income quintile group, 2010 United Kingdom ... 70 Table 3.11E Expenditure of two adult retired households not mainly dependent on state pensions
by gross equivalised income quintile group (OECD-modified scale), 2010 United Kingdom ... 71
Table 3.12 Income and source of income by gross income quintile group, 2010 United Kingdom ... 72
Table 3.12E Income and source of income by gross equivalised income quintile group
(OECD-modified scale) 2010 United Kingdom
...72
4. Trends in household expenditure
Table 4.1 Household expenditure based on the FES classification, 1995-96 to 2010 at 2010 prices United Kingdom... 77
Table 4.2 FES household expenditure as a percentage of total expenditure, 1995-96 to 2010 based on the FES classification at 2010 pricesUnited Kingdom ... 79
Table 4.3 Household expenditure based on COICOP classification, 2004-05 to 2010 at 2010 pricesUnited Kingdom ... 81
Table 4.4 Household expenditure as a percentage of total expenditure based on COICOP classification, 2004-05 to 2010 at 2010 prices United Kingdom ... 82
Table 4.5 Household expenditure 2004-05 to 2010 COICOP based on current prices United Kingdom ... 83
5. Impact of the recession on household expenditure
Table 5.1 Mean COICOP weekly household expenditure and income time series
weighted and in 2010 prices United Kingdom ... 90 Table 5.2 OAC super groups and groups classification (percentages) United Kingdom ... 92 Table 5.3 Mean COICOP weekly household expenditure and income 2010, by OAC super
group (weighted) United Kingdom ... 93 Table 5.4 Mean COICOP weekly household expenditure and income 2007, by OAC super
group (weighted) 2010 prices United Kingdom... 94
Table 5.5 Statistical significance of mean differences in 2010 and 2007 expenditure United Kingdom ... 97
Table 5.6 Rank order percentage of total COICOP expenditure United Kingdom... 98
Table 5.7 Mean COICOP weekly household expenditure (£) by OAC group 2010 United Kingdom ... 116
Table 5.8 Mean COICOP weekly household expenditure (£) by OAC group 2007 2010 prices United Kingdom... 117
Appendix A
Household expenditure tables can be accessed by clicking on the table names in the appendix
Table A1 Components of household expenditure, 2010 United Kingdom ... 126 Table A2 Expenditure on food and non-alcoholic drinks by place of purchase, 2010
United Kingdom ... 126 Table A3 Expenditure on clothing and footwear by place of purchase, 2010
United Kingdom ... 126 Table A4 Household expenditure by gross income decile group, 2010 United Kingdom... 126 Table A5 Household expenditure as a percentage of total expenditure by gross income
decile group, 2010 United Kingdom... 126 Table A6 Detailed household expenditure by gross income decile group, 2010
United Kingdom ... 126 Table A7 Household expenditure by disposable income decile group, 2010
United Kingdom ... 126 Table A8 Household expenditure as a percentage of total expenditure by disposable income
decile group, 2010 United Kingdom... 126 Table A9 Household expenditure by age of household reference person, 2010
United Kingdom ... 126 Table A10 Household expenditure as a percentage of total expenditure by age of household
reference person, 2010 United Kingdom ... 126
Table A11 Detailed household expenditure by age of household reference person, 2010 United Kingdom ... 126 Table A12 Household expenditure by gross income quintile group where the household
reference person is aged under 30, 2008-2010 United Kingdom ... 126 Table A13 Household expenditure by gross income quintile group where the household
reference person is aged 30 to 49, 2008-2010 United Kingdom ... 126 Table A14 Household expenditure by gross income quintile group where the household
reference person is aged 50 to 64, 2008-2010 United Kingdom ... 126 Table A15 Household expenditure by gross income quintile group where the household
reference person is aged 65 to 74, 2008-2010 United Kingdom ... 127 Table A16 Household expenditure by gross income quintile group where the household
reference person is aged 75 or over, 2008-2010 United Kingdom ... 127 Table A17 Household expenditure by economic activity status of the household reference
person, 2010 United Kingdom ... 127 Table A18 Household expenditure by gross income: the household reference person is a
full time employee, 2010 United Kingdom ... 127 Table A19 Household expenditure by gross income: the household reference person is
self-employed, 2008-2010 United Kingdom... 127 Table A20 Household expenditure by number of persons working, 2010 United Kingdom .... 127 Table A21 Household expenditure by age at which the household reference person
completed continuous full-time education, 2010 United Kingdom ... 127 Table A22 Household expenditure by socio-economic classification of household reference
person, 2010 United Kingdom ... 127 Table A23 Expenditure by household composition, 2010 United Kingdom ... 127 Table A24 Expenditure of one person retired households mainly dependent on state
pensionsby gross income quintile group, 2008-2010 United Kingdom ... 127 Table A25 Expenditure of one person retired households not mainly dependent on state
pensions by gross income quintile group, 2008-2010 United Kingdom ... 127 Table A26 Expenditure of one adult non-retired households by gross income quintile
group, 2008-2010 United Kingdom... 127 Table A27 Expenditure of one adult households with children by gross income quintile
group, 2008-2010 United Kingdom... 127 Table A28 Expenditure of two adult households with children by gross income quintile
group, 2008-2010 United Kingdom... 128 Table A29 Expenditure of two adult non-retired households by gross income quintile
group, 2008-2010 United Kingdom... 128 Table A30 Expenditure of two adult retired households mainly dependent on state
pensionsby gross income quintile group, 2008-2010 United Kingdom ... 128 Table A31 Expenditure of two adult retired households not mainly dependent on state
pensions by gross income quintile group, 2008-2010 ... 128 Table A32 Household expenditure by tenure, 2010 United Kingdom ... 128 Table A33 Household expenditure by UK Countries and regions, 2008-2010... 128 Table A34 Household expenditure as a percentage of total expenditure by UK Countries
and regions, 2008-2010... 128
Table A35 Detailed household expenditure by UK Countries and regions, 2008-2010 ... 128
Table A36 Household expenditure by urban/rural areas (GB), 2008-2010 ... 128
Table A37 Income and source of income by household composition, 2010 United Kingdom 128 Table A38 Income and source of income by age of household reference person, 2010 United Kingdom ... 128
Table A39 Income and source of income by gross income quintile group, 2010 United Kingdom ... 128
Table A40 Income and source of income by household tenure, 2010 United Kingdom ... 128
Table A41 Income and source of income by UK Countries and regions, 2008-2010... 128
Table A42 Income and source of income by GB urban/rural area, 2008-2010 ... 128
Table A43 Income and source of income by socio-economic classification, 2010 United Kingdom ... 128
Table A44 Income and source of income, 1970 to 2010 United Kingdom ... 129
Table A45 Percentage of households with durable goods, 1970 to 2010 United Kingdom .... 129
Table A46 Percentage of households with durable goods by income group and household composition, 2010 United Kingdom ... 129
Table A47 Percentage of households with cars by income group, tenure and household composition, 2010 United Kingdom ... 129
Table A48 Percentage of households with durable goods by UK Countries and regions, 2008-2010... 129
Table A49 Percentage of households by size, composition and age in each gross income decile group, 2010 United Kingdom... 129
Table A50 Percentage of households by economic activity, tenure and socio-economic classification in each gross income decile group, 2010 United Kingdom ... 129
Table A51 Average weekly household expenditure by OAC supergroup, 2010 United Kingdom ... 129
Table A52 Average weekly household expenditure by OAC group, 2010 United Kingdom ... 129
Table A53 Average gross normal weekly household income by OAC supergroup, 2010 United Kingdom ... 129
Appendix B: Methodology
Table B1 Percentage standard errors of expenditure of households and number of recording households, 2010 United Kingdom ... 141Table B2 Percentage standard errors of income of households and numbers of recording households, 2010 United Kingdom... 142
Table B3 95 per cent confidence intervals for average household expenditure, 2010 United Kingdom ... 143
Table B4 The effect of weighting on expenditure, 2010 United Kingdom ... 168
Table B5 Characteristics of households, 2010 United Kingdom ... 169
Table B6 Characteristics of persons, 2010 United Kingdom... 171
Table B7 Index to tables in reports on the Family Expenditure Survey in 1999/00 to 2000/01 and the Living Costs and Food Survey 2001/02 to 2010 ... 172
List of figures
Overview
Figure 1.1 Household expenditure by gross income decile group, 2010 United Kingdom... 4 Figure 1.2 Expenditure on selected items as a proportion of total spending by age of the HRP,
2010 United Kingdom ... 5 Figure 1.3 Household expenditure by region, 2008 to 2010 United Kingdom ... 7
Figure 1.4 Percentage of gross weekly household income by source of income, 2010 United Kingdom ... 8
Housing expenditure
Figure 2.1 Housing expenditure items as a percentage of total housing expenditure, 2010United Kingdom ... 13 Figure 2.2 Housing expenditure 2008 to 2010 United Kingdom ... 14 Figure 2.3 Expenditure on selected items by gross income decile group, 2010
United Kingdom ... 15 Figure 2.4 Expenditure on selected items by age of household reference person, 2010 ... 16 Figure 2.5 Expenditure on net rent by age of household reference person, 2009 and 2010 .... 16 Figure 2.6 Housing expenditure by Country, 2010 ... 17 Figure 2.7 Housing expenditure by UK regions and Countries, 2010 ... 18 Figure 2.8 Percentage difference compared with UK average for net rent by UK Countries
and regions, 2010 ... 19 Figure 2.9 Percentage difference compared with UK average for mortgage payments by
UK Countries and regions, 2010... 19 Figure 2.10 Housing expenditure by socio-economic classification of household reference
person, 2010 United Kingdom ... 20 Figure 2.11 Expenditure on selected items by socio-economic classification of household
reference person, 2010 United Kingdom ... 21 Figure 2.12 Expenditure on net rent by renters, and mortgages by mortgage holders, by
gross income decile group, 2010 United Kingdom ... 22 Figure 2.13 Expenditure on net rent by renters, by UK Countries and regions, 2010... 22 Figure 2.14 Expenditure on mortgages by mortgage holders by UK Countries and regions,
2010... 23
Equivalised income
Figure 3.1 Percentage of households with children in each gross income decile group, 2010, United Kingdom ... 39
Figure 3.1E Percentage of households with children in each gross OECD-modified equivalised income decile group, 2010 United Kingdom ... 39 Figure 3.2 Percentage of retired and non-retired households by gross income decile group,
2010 United Kingdom ... 40 Figure 3.2E Percentage of retired and non-retired households by OECD-modified equivalised
income decile group, 2010 United Kingdom ... 41 Figure 3.3 Expenditure on food and non-alcoholic drinks by gross and OECD-modified
equivalised income decile group, 2010 United Kingdom ... 42 Figure 3.4 Expenditure on clothing and footwear by gross and OECD-modified equivalised
income decile group, 2010 United Kingdom ... 43 Figure 3.5 Percentage of total expenditure on selected items by OECD-modified equivalised
income decile group, 2010 United Kingdom ... 44 Figure 3.6 Sources of income by gross income quintile group, 2010 United Kingdom... 45
Figure 3.6E Sources of income by gross OECD-modified equivalised quintile group, 2010 United Kingdom ... 46
Trends in household expenditure over time
Figure 4.1 Total household expenditure based on COICOP classification, 2004-05 to 2010, at 2010 prices United Kingdom... 75
Impact of the recession on household expenditure
Figure 5.1 UK Quarterly GDP growth and unemployment rate, 2006q4 – 2011q2... 87 Figure 5.2 COICOP item expenditure as a percentage of total COICOP expenditure time
series United Kingdom... 91 Figure 5.3 OAC mean COICOP expenditure graph by OAC super group (as a percentage
of total COICOP expenditure), 2010 United Kingdom ... 95 Figure 5.4 Mean COICOP expenditure graph by OAC super group (as a percentage of total
COICOP expenditure), 2007 United Kingdom ... 96
Figure 5.5 Housing, fuel and power expenditure – percentage of total COICOP expenditure United Kingdom ... 99
Figure 5.6 Actual rentals for housing (subset of housing fuel and power) weekly household expenditure (£) 2010 prices United Kingdom ... 100 Figure 5.7 Water and miscellaneous services relating to the dwelling (subset of housing fuel
and power) weekly household expenditure (£) 2010 prices United Kingdom ... 101 Figure 5.8 Electricity, gas and other fuels (subset of housing fuel and power) weekly
household expenditure (£) 2010 prices United Kingdom ... 102 Figure 5.9 Transport expenditure percentage of total COICOP expenditure United Kingdom 103
Figure 5.10 Purchase of vehicles (subset of transport) weekly household expenditure (£) 2010 prices United Kingdom... 104
Figure 5.11 Operation of personal transport (subset of transport) weekly household
expenditure (£) 2010 prices United Kingdom ... 105
Figure 5.12 Transport services (subset of transport) weekly household expenditure (£) 2010 prices United Kingdom... 106
Office for National Statistics [LL
Figure 5.13 Recreation and culture expenditure percentage of total COICOP expenditure United Kingdom ... 107
Figure 5.14 Package holidays abroad (subset of recreation and culture) weekly household expenditure (£) 2010 prices United Kingdom ... 108 Figure 5.15 Sports admissions, subscriptions, leisure class fees and equipment hire (subset
of recreation and culture) weekly household expenditure 2010 prices United Kingdom ... 108
Figure 5.16 Restaurants and hotels expenditure percentage of total COICOP expenditure United Kingdom ... 109
Figure 5.17 Takeaway meals eaten at home (subset of restaurants and hotels) weekly
household expenditure (£) 2010 prices United Kingdom ... 110 Figure 5.18 Alcoholic drinks away from home (subset of restaurants and hotels) weekly
household expenditure (£) 2010 prices United Kingdom ... 110 Figure 5.19 Household goods and services expenditure percentage of total COICOP
expenditure United Kingdom ... 111 Figure 5.20 Household appliances (subset of household goods and furnishings) weekly
household expenditure (£) 2010 prices United Kingdom ... 112 Figure 5.21 Tools and equipment for house and garden (subset of household goods and
services) weekly household expenditure (£) 2010 prices United Kingdom... 112 Figure 5.22 Alcoholic drinks (subset of alcoholic drinks, tobacco and narcotics) weekly
household expenditure (£) 2010 prices United Kingdom ... 113
Figure 5.23 Clothing and footwear expenditure percentage of total COICOP expenditure United Kingdom ... 114
Figure 5.24 Footwear (subset of clothing and footwear) weekly household expenditure (£) 2010 prices United Kingdom... 114
Figure 5.25 Communication weekly household expenditure (£) by OAC group 2010 prices United Kingdom... 118
Figure 5.26 Recreation and culture weekly household expenditure (£) by OAC group 2010 prices United Kingdom... 119
Figure 5.27 Restaurant and hotel weekly household expenditure (£) by OAC group 2010 prices United Kingdom... 120
Figure 5.28 Household goods and services weekly household expenditure (£) by OAC group 2010 prices United Kingdom ... 121
Figure 5.29 Transport weekly household expenditure (£) by OAC group 2010 prices United Kingdom ... 122
Symbols and conventions used in this report
[ ] Figures should be used with extra caution because they are based on fewer than 20 reporting households.
.. The data is suppressed if the unweighted sample counts are less than 10 reporting households.
- No figures are available because there are no reporting households.
Rounding: Individual figures have been rounded independently. The sum of component items does not therefore necessarily add to the totals shown.
Averages: These are averages (means) for all households included in the column or row, and unless specified, are not restricted to those households reporting expenditure on a particular item or income of a particular type.
Period covered: Calendar year 2010 (1 January 2010 to 31 December 2010).
List of contributors
Editor: Giles Horsfield
Authors: Alice Jefford
Emma Jarvis
Laura Keyse
Louise Skilton
Paul Hossack
Suzanne Fry
Living Costs and
Food Survey team: Karen Watkins
Linda Williams
Scott Symons
Sian Wilson
Tracy Lane
Chris Payne
Rebecca Ayres
Field Team and Interviewers
Coders and Editors
Reviewers: Andrew Barnard
Ed Dunn
Gareth Clancy
Richard Jones
Felix Ritchie
Acknowledgements
A large scale survey is a collaborative effort and the authors wish to thank the interviewers and other ONS staff who contributed to the study. The survey would not be possible without the co-operation of the respondents who gave up their time to be interviewed and keep a diary of their spending. Their help is gratefully acknowledged.
Introduction
This report presents the latest information from the Living Costs and Food Survey for the 2010 calendar year (January to December). The Expenditure and Food Survey (EFS) was renamed as the Living Costs and Food Survey (LCF) in 2008 when it became a module of the Integrated Household Survey (IHS).
The current LCF is the result of the amalgamation of the Family Expenditure and National Food Surveys (FES and NFS). Both surveys were well established and important sources of information for government and the wider community, charting changes and patterns in Britain’s spending and food consumption since the 1950s. The Office for National Statistics (ONS) has overall project management and financial responsibility for the LCF while the Department for Environment, Food and Rural Affairs (DEFRA) sponsors the specialist food data.
The survey continues to be primarily used to provide information for the Retail Prices Index; National Accounts estimates of household expenditure; the analysis of the effect of taxes and benefits, and trends in nutrition. However, the results are multi purpose, providing an invaluable supply of economic and social data.
The 2010 survey
In 2010 5,116 households in Great Britain took part in the LCF survey. The response rate was 50 per cent in Great Britain and 59 per cent in Northern Ireland.The fieldwork was undertaken by the Office for National Statistics and the Northern Ireland Statistics and Research Agency.
Further details about the conduct of the survey are given in Appendix B.
The format of the Family Spending publication changed in 2003/04 so that the tables of key results which were found in the main body of the report are now in Appendix A. This year’s report includes an overview chapter outlining key findings, two detailed chapters focusing upon expenditure on housing and the impact of equivalising income when calculating results, a fourth chapter looking at trends in household expenditure over time and finally a chapter on the impact of the recession on household expenditure.
Data quality and definitions
The results shown in this report are of the data collected by the LCF, following a process of validation and adjustment for non-response using weights that control for a number of factors.
These issues are discussed in the section on reliability in Appendix B.
Figures in the report are subject to sampling variability. Standard errors for detailed expenditure items are presented in relative terms in Table A1 and are described in Appendix B. Figures shown for particular groups of households (for example income groups or household composition groups),
regions or other sub-sets of the sample are subject to larger sampling variability, and are more sensitive to possible extreme values than are figures for the sample as a whole.
The definitions used in the report are set out in Appendix B, and changes made since 1991 are also described. Note particularly that housing benefit and council tax rebate (rates rebate in
Northern Ireland), unlike other social security benefits, are not included in income but are shown as a reduction in housing costs.
Income and Expenditure Balancing
The LCF is designed primarily as a survey of household expenditure on goods and services. It also gathers information about the income of household members, and is an important and detailed source of income data. However, the survey is not designed to produce a balance sheet of income and expenditure either for individual households or groups of households. For further information on the balancing of income and expenditure figures, see ’Description and response rate of the survey’, page 223.
Related data sources
Details of household consumption expenditure within the context of the UK National Accounts are produced as part of Consumer Trends
(www.ons.gov.uk/ons/publications/all-releases.html?definition=tcm%3A77-23619). This publication includes all expenditure by members of UK resident households. National Accounts figures draw on a number of sources including the LCF: figures shown in this report are therefore not directly comparable to National Accounts data. National Accounts data may be more appropriate for deriving long term trends on expenditure.
More detailed income information is available from the Family Resources Survey (FRS), conducted for the Department for Work and Pensions. Further information about food consumption, and in particular details of food quantities, is available from the Department for Environment, Food and Rural Affairs, who are continuing to produce their own report of the survey
(www.defra.gov.uk/statistics/foodfarm/food/familyfood/).
In Northern Ireland, a companion survey to the GB LCF is conducted by the Central Survey Unit of the Northern Ireland Statistics and Research Agency (NISRA). Households in Northern Ireland are over-sampled so that separate analysis can be carried out, however these cases are given less weight when UK data are analysed.
Additional tabulations
This report gives a broad overview of the results of the survey, and provides more detailed information about some aspects of expenditure. However, many users of LCF data have very specific data requirements that may not appear in the desired form in this report. The ONS can provide more detailed analysis of the tables in this report, and can also provide additional tabulations to meet specific requests. A charge will be made to cover the cost of providing additional information.
Office for National Statistics xviii The tables in Family Spending 2010 are available as Excel spreadsheets.
Overview
This chapter presents the key findings of the 2010 Living Costs and Food Survey (LCF), formerly the Expenditure and Food Survey. The chapter provides an overview of household income and expenditure, characterised by different household types and regions, as well as a summary of the ownership of a limited range of durable goods.
All of the tables (except Table 1.1) referred to in this chapter can be found in Appendix A of the report (page 125).
[image:21.595.56.390.494.723.2]Household expenditure
Table 1.1 shows total weekly household expenditure in the United Kingdom (UK) by the 12 Classification Of Individual COnsumption by Purpose (COICOP)1 categories. In 2010 average
weekly household expenditure in the UK was £473.60, £18.60 more than in 2009 when it was £455.00, reversing the change seen in the previous year. As in previous years, spending was highest on transport at £64.90 per week. This was £6.50 more than in 2009, a large increase of 11 per cent.
Housing, fuel and power (£60.40) and recreation and culture (£58.10) were the categories with the next highest expenditure. Housing, fuel and power saw an increase of £3.10 making it the second highest category, now higher than recreation and culture which saw only a small increase of 20p. The average weekly expenditure on food and non-alcoholic drinks in 2010 was £53.20 per week.
Table 1.1
Expenditure by COICOP category and
total household expenditure, 2010
United Kingdom
COICOP category £ per week
Transport 64.90
Housing, fuel and power 60.40
Recreation and culture 58.10
Food and non-alcoholic drinks 53.20
Restaurants and hotels 39.20
Miscellaneous goods and services 35.90
Household goods and services 31.40
Clothing and footwear 23.40
Communication 13.00
Alcoholic drinks, tobacco and narcotics 11.80
Education 10.00
Health 5.00
Total COICOP expenditure 406.30
Other expenditure items 67.30
Total expenditure 473.60
Totals may not add up due to independent rounding of component categories.
Of the £64.90 spent on transport each week, approximately half (49 per cent) was spent on the operation of personal transport (£33.30), see Table A1. This was an increase of 14 per cent on the previous year, in line with the overall increase observed in spending on transport. As in 2009 petrol, diesel and other motor oils (£21.60 per week) was the largest expenditure in the operation of personal transport category, an increase from £19.20 in 2009. Households spent on average £12.10 per week on transport services, including rail, tube and bus fares, compared to £9.60 in 2009, however the purchase of vehicles, remained the same at £19.50 per week in 2010.
Approximately a third (31 per cent) of spending on recreation and culture (£17.80 per week) was spent on recreational and cultural services: sports admissions, leisure class fees and equipment hire accounted for £5.30 per week; cinema, theatre and museums etc (£2.40 per week); TV, video, satellite rental, cable subscriptions and TV licenses (£6.00 per week); and gambling payments (£2.70 per week).
Average weekly spend on package holidays fell from £13.20 per week in 2009 to £12.60 in 2010. Of this, £11.60 was spent on holidays abroad, £0.70 less than in 2009. Spending on audio-visual, photographic and information processing equipment (£7.20 per week) remained relatively constant, while spending on other recreational items and equipment, gardens and pets increased to £11.40 per week. The average weekly spend on TV, video and computers increased to £5.20. (Table A1).
Of the £53.20 average weekly spend on food and non-alcoholic drinks , £7.10 was spent on fresh fruit and vegetables; £3.10 on fruit and £4.00 on vegetables; £11.60 was spent on meat, the highest proportion (48 per cent) of which was spent on other meat and meat preparations (£5.60 per week); £5.00 was spent on bread, rice and cereals; £3.20 was spent on buns, cakes, biscuits, etc; and £4.30 was spent on non-alcoholic drinks (Table A1). 81 per cent, £43.10 per week of food and non-alcoholic drinks were purchased from large supermarket chains (Table A2), an increase of £5.40 on the previous year.
Household expenditure by income
Household incomes have been ranked in ascending order and divided into decile groups in order to examine expenditure patterns between different income groups. Households with the smallest income lie in the first decile group and those with the largest income lie in the top decile group. Average weekly household expenditure in 2010 ranged from £185.60 in the lowest of the 10
income decile groups to £1,018.50 in the highest (Figure 1.1, Table A4); expenditure in this highest decile was £26.40 higher than in 2009, reversing the drop seen in the previous year.
Figure 1.1
Household expenditure by gross income decile group, 2010
United Kingdom0 200 400 600 800 1,000 1,200
1 2 3 4 5 6 7 8 9 10
Gross income decile group £ per week
Households in the lowest income decile group spent a larger proportion of their total average weekly expenditure on housing, fuel and power (23 per cent), and food and non-alcoholic drinks (15 per cent), than those in the highest income decile group (8 per cent in both expenditure
categories). However, households in the highest income decile group spent a greater proportion on transport (15 per cent) and recreation and culture (13 per cent) than those in the lowest income decile group (9 and 10 per cent respectively) (Table A5).
Household expenditure by age
Average weekly expenditure varied with the age of the household reference person (HRP). As in 2009, households whose HRP was aged 30 to 49 years had the highest average expenditure (£573.10 per week) while those with an HRP aged 75 years and over had the lowest average household expenditure (£240.40 per week). It should be noted that households with an HRP aged 30 to 49 years contained an average of 3 people, whereas households with an HRP aged 75 years and over contained an average of 1.4 people (Table A9).
Spending on housing, fuel and power in households whose HRP was aged less than 30 years fell from £97.30 in 2009 to £91.70, a drop of 6 per cent (Table A9). This compares with 20 per cent of total household expenditure for households with a HRP aged less than 30, whereas households with an HRP aged 75 years or over spent 18 per cent of their total household expenditure on housing, fuel and power (Table A10).
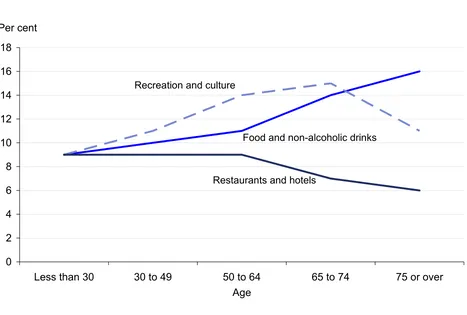
The proportion of expenditure spent on food and non-alcoholic drinks increased with age, from 9 per cent among households with an HRP aged less than 30 years to 16 per cent among
households with an HRP aged 75 years and over.
The pattern of spending on restaurants and hotels, as a proportion of total expenditure, was relatively constant among age groups, with the percentage of total expenditure ranging from 9 per cent among households with an HRP aged less than 65, to 6 per cent among households with an
HRP aged 75 years and over (Table A10). When the amount spent is considered, household
expenditure on restaurants and hotels was greatest in households with an HRP aged between 30 and 49 (£49.10 per week), but much lower in households with HRP over 75 (£14.10 per week). This compares with an average expenditure across all ages of £39.20 (Table A11).
Expenditure on recreation and culture, as a proportion of total spending, increased from 9 per cent
among households with an HRP aged less than 30 years to a maximum of15 per cent among
[image:24.595.66.533.359.674.2]households with an HRP aged 65 to 74 years (Table A10).
Figure 1.2
Expenditure on selected items as a proportion of total
spending by age of the HRP, 2010
United Kingdom0 2 4 6 8 10 12 14 16 18
Less than 30 30 to 49 50 to 64 65 to 74 75 or over
Age Per cent
Recreation and culture
Restaurants and hotels
Food and non-alcoholic drinks
Household expenditure by economic activity and socio-economic
classification
This analysis uses the National Statistics Socio-Economic Classification (NS-SEC), see Appendix B, page 222.
Household spending varied with the economic status of the HRP. The average weekly expenditure of households where the HRP was in employment (£587.20 per week) was just under twice that of households where the HRP was unemployed (£309.60 per week), and of households where the HRP was economically inactive (£309.50 per week) (Table A17).
In households where the HRP was in employment, spending was greatest on transport (£84.80 per week) and recreation and culture (£69.90 per week). Among households where the HRP was unemployed, spending on housing, fuel and power was greatest (£54.50 per week), followed by transport (£47.40 per week) (Table A17).
Average weekly expenditure was highest among households where the HRP was in the ‘large employers and higher managerial’ occupational group, at £856.10 per week. An average weekly expenditure of £418.10 was recorded for households where the HRP was in a ‘routine’ occupation (Table A22).
Household expenditure by household composition
Generally, household expenditure increased with the size of the household. Thus, average weekly household expenditure was lowest among retired one-person households who were mainly
dependent on the state pension (£161.10) and highest among households containing three or more adults with children (£747.30) (Table A23).
Household expenditure by region
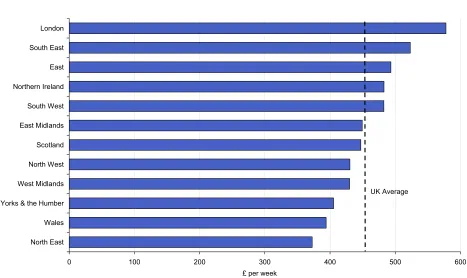
Overall, average household expenditure in the UK was £466.50 per week for the years 2008–10 combined. There were five regions in which expenditure over this period was higher than the UK average: expenditure was highest in London (£577.80), followed by the South East (£523.20 per week), the East (£493.40), the South West (£482.60) and Northern Ireland (£482.80). Spending was lowest among households in the North East (£372.70), Wales (£394.00), and Yorkshire and the Humber (£405.50) (Figure 1.3, Table A33).
Figure 1.3
Household expenditure by region, 2008 to 2010
United Kingdom0 100 200 300 400 500 600
North East Wales Yorks & the Humber West Midlands North West Scotland East Midlands South West Northern Ireland East South East London
£ per week
UK Average
During the three-year period, 2008–2010, spending on transport was highest among households in the South East (£73.50 per week) and lowest among those in the North East (£49.10 per week). Households in London spent the most on housing, fuel and power (£87.00 per week) compared with the UK national average of £56.90 per week (Table A35). Housing expenditure is looked at in more detail in chapter two.
Households in rural areas had higher overall expenditure (£506.30 per week) than those in urban areas (£454.60 per week). This was reflected in expenditure on transport, where spending was highest (£76.00in rural areas and £58.30in urban areas), andrecreation and culture (£68.00in rural areas and £55.80 in urban areas). However, expenditure on housing, fuel and power was slightly higher in urban areas (£58.00 per week) than in rural areas (£54.50 per week)(Table A36).
Household income
Income is defined within the survey as the gross weekly cash income current at the time of interview. Income includes salaries and wages, income from self employment, benefits and pensions. See Appendix B for further details on income.
Average gross weekly household income in the UK in 2010 was £700.00, £17.00 more than in 2009 (£683.00 per week). Besides wages and salaries (65per cent), social security benefits formed the largest proportion of income (14 per cent), followed by self-employment income (10 per
cent), and income from annuities and pensions (8 per cent) (Figure 1.4, Table A37).
Figure 1.4
Percentage of gross weekly household income by source
of income, 2010
United KingdomWages and salaries 65% Social security benefits
14%
Self employment 10%
Investments 2% Annuities and pensions
8%
Other sources 1%
Household income by age
Households with an HRP aged 30 to 49 recorded the highest gross weekly income at £894 per week. Of this, 80 per cent was acquired from wages and salaries. The lowest gross weekly income was recorded by households with an HRP aged 75 years or over (£350, an increase of £19.00 from the previous year) with 52 per cent of their income gained through social security benefits.
Households with a household reference person (HRP) aged less than 65 years of age had a higher average weekly gross income than those with an HRP aged 65 years and over. However, the older age groups had a higher proportion of disposable income: 92 per cent for households with an HRP aged 65 to 74 years and 93 per cent for households with an HRP aged 75 years or over. This compares with households with an HRP aged 30-49, where 80 per cent of income was disposable (Table A38).
Household income by region
There were three English regions that exceeded the 2008–2010 UK national average income of £699. They were London (£982), the South East (£810) and the East (£749). Income was lowest among households in the North East (£543 per week) and Yorkshire and the Humber (£570 per week).
Among UK countries, households in England had the highest average gross weekly income (£711), whereas those in Wales had the lowest average income at £604 per week (Table A41).
Office for National Statistics
Household income by economic activity and socio-economic
classification
Households where the HRP was in the ‘large employers and higher managerial’ occupational group had an average gross weekly income of £1,653, almost three times the income of households where the HRP worked in a ‘routine’ occupation (£612). Incomes for these occupational groups were acquired mainly from wages and salaries (92and 84per cent respectively).
Households with an HRP in the ‘large employers and higher managerial’ occupational group also received the highest proportion of their average gross weekly income (£1,653) from wages and salaries (92 per cent). By contrast, those households with an HRP in the ‘long-term unemployed’ occupational group obtained 75per cent of their average gross weekly income (£258) from social security benefits (Table A43).
Ownership of durable goods
Overall, 77 per cent of households had a home computer and 73 per cent had an internet connection at home, an increase of 2 percentage points for both from 2009 (Table A45). Among households in the highest income decile 98 per cent had a home computer and 97 per cent an internet connection, compared with only 46 and 39 per cent of households in the lowest income decile. This does, however, represent an 8 percentage point increase in households with a home computer and a 6 percentage point increase on households with an internet connection in the lowest income decile from 2009 continuing the upward trend (Table A46).
In general, households with children were more likely to have an internet connection than those without. Overall, 92 per cent of two-adult, non-retired households owned a home computer, with 89 per cent having an internet connection (Table A46).
Connection to the internet was lowest among households in Northern Ireland (61 per cent) and the North East (64 per cent) and highest in the London (77 per cent). Ownership of a mobile phone was lowest among households in Wales (48 per cent) and highest in the East Midlands at 86 per cent (Table A48).
Three-quarters (75 per cent) of all households owned a car or van, with 30 per cent owning two or more. Ownership of at least one car or van varied from 32 per cent in the lowest income decile, to 96 per cent in the ninth decile (Table A47).
Ownership of a car or van was highest among households in the South West (83 per cent), the East (82 per cent) and the South East (81 per cent), and lowest among households in London (65 per cent) and the North East (68 per cent) (Table A48).
1 From 2001-02, the Classification Of Individual COnsumption by Purpose (COICOP) was introduced as a new coding frame for expenditure items. COICOP is the internationally agreed classification system for reporting household consumption expenditure. Total expenditure is made up from the total of the COICOP expenditure groups (1 to 12) plus ‘Other expenditure items (13)’. Other expenditure items are those items excluded from the narrower COICOP classifications, such as mortgage interest payments, council tax, domestic rates, holiday spending, cash gifts and charitable donations.
Housing expenditure
Background
This chapter presents housing-related costs such as rent, mortgage payments, repair and maintenance, and home improvements. The first section outlines the definitions of housing expenditure: the Classification Of Individual COnsumption by Purpose (COICOP) definition, followed by the definition used in the analysis of this chapter, which includes expenditure not present in COICOP. This chapter also examines housing expenditure over time and by income, region, and household characteristics. The final section explores housing costs for renters, and for mortgage holders in more depth.
Definitions of housing expenditure
The COICOP system has been used to classify expenditure on the Living Costs and Food Survey (LCF) and previously the Expenditure and Food Survey (EFS) since 2001/02. COICOP is an internationally agreed system of classification for reporting consumption expenditure within National Accounts and is used by other household budget surveys across the European Union. Further information on COICOP can be found on the United Nations Statistics Division website: http://unstats.un.org/unsd/cr/registry/regct.asp?Lg=1.
Under COICOP, household consumption expenditure is categorised into the following 12 headings: 1. Food & non-alcoholic drinks
2. Alcoholic drinks, tobacco & narcotics 3. Clothing & footwear
4. Housing (net), fuel & power 5. Household goods & services 6. Health
7. Transport 8. Communication 9. Recreation & culture 10. Education
11. Restaurants & hotels
12. Miscellaneous goods & services
It is important to note that COICOP classified housing costs do not include what is considered to be non-consumption expenditure, for example, mortgage interest, mortgage capital repayments, mortgage protection premiums, council tax and domestic rates.
In addition to the 12 COICOP expenditure categories, the tables contained in Appendix A include a category called ‘other expenditure items’ under which certain non-consumption expenditures can be found. This category includes the following housing-related costs: mortgage interest payments; mortgage protection premiums; council tax; and domestic rates. Housing costs that are not
included in either the COICOP definition of housing or the ‘other expenditure item’ category are captured within the ‘other items recorded’ category that can be viewed in Table A1 in Appendix A.
For the purpose of this chapter all data relating to housing expenditure have been combined to facilitate an understanding of total housing costs. This comprehensive definition of housing
expenditure is made up from three types of expenditure detailed in Table 2.1: expenditure included in COICOP, housing costs included in the ‘other expenditure items’ and ‘other items recorded’ categories of Family Spending.
It should also be noted that throughout Family Spending, including this chapter, rent excluding service charges and benefit receipts associated with housing (net rent) has been used when calculating total expenditure. This convention ensures that rebates, benefits and allowances are excluded from the calculation of total household expenditure on rent.
7DEOH
'HILQLWLRQRIWRWDOKRXVLQJH[SHQGLWXUH
+RXVLQJFRVWVZKLFKDUHLQFOXGHGLQWKH&2,&23 FODVVL¿FDWLRQ
+RXVLQJFRVWVZKLFKDUHLQFOXGHGDVµRWKHUH[SHQGLWXUH LWHPV¶EXWH[FOXGHGIURP&2,&23FODVVL¿FDWLRQ
$FWXDOUHQWDOVIRUKRXVLQJ
±QHWUHQWJURVVUHQWOHVVKRXVLQJEHQH¿WUHEDWHVDQG DOORZDQFHVUHFHLYHG
±VHFRQGGZHOOLQJUHQW
0DLQWHQDQFHDQGUHSDLURIGZHOOLQJ ±FHQWUDOKHDWLQJPDLQWHQDQFHDQGUHSDLU ±KRXVHPDLQWHQDQFHDQGUHSDLU
±SDLQWZDOOSDSHUWLPEHU ±HTXLSPHQWKLUHVPDOOPDWHULDOV
:DWHUVXSSO\DQGPLVFHOODQHRXVVHUYLFHVUHODWLQJWR GZHOOLQJ
±ZDWHUFKDUJHV
±RWKHUUHJXODUKRXVLQJSD\PHQWVLQFOXGLQJVHUYLFH FKDUJHIRUUHQW
±UHIXVHFROOHFWLRQLQFOXGLQJVNLSKLUH +RXVHKROG,QVXUDQFHV
±VWUXFWXUDOLQVXUDQFH ±FRQWHQWVLQVXUDQFH
±LQVXUDQFHIRUKRXVHKROGDSSOLDQFHV
+RXVLQJPRUWJDJHLQWHUHVWSD\PHQWVHWF ±PRUWJDJHLQWHUHVWSD\PHQWV
±PRUWJDJHSURWHFWLRQSUHPLXPV ±FRXQFLOWD[GRPHVWLFUDWHV
±FRXQFLOWD[PRUWJDJHLQVXUDQFHVHFRQGGZHOOLQJ
+RXVLQJFRVWVZKLFKDUHLQFOXGHGDVµRWKHULWHPV UHFRUGHG¶DQGDUHH[FOXGHGIURP&2,&23FODVVL¿FDWLRQ
3XUFKDVHRUDOWHUDWLRQRIGZHOOLQJVFRQWUDFWHGRXW PRUWJDJHV
±RXWULJKWSXUFKDVHRIKRXVHVÀDWVHWFLQFOXGLQJGHSRVLWV ±FDSLWDOUHSD\PHQWRIPRUWJDJH
±FHQWUDOKHDWLQJLQVWDOODWLRQ
±',<LPSURYHPHQWVGRXEOHJOD]LQJNLWFKHQXQLWVVKHGV HWF
±KRPHLPSURYHPHQWVFRQWUDFWHGRXW ±EDWKURRP¿WWLQJV
±SXUFKDVHRIPDWHULDOVIRUFDSLWDOLPSURYHPHQWV ±SXUFKDVHRIVHFRQGGZHOOLQJ
Housing expenditure
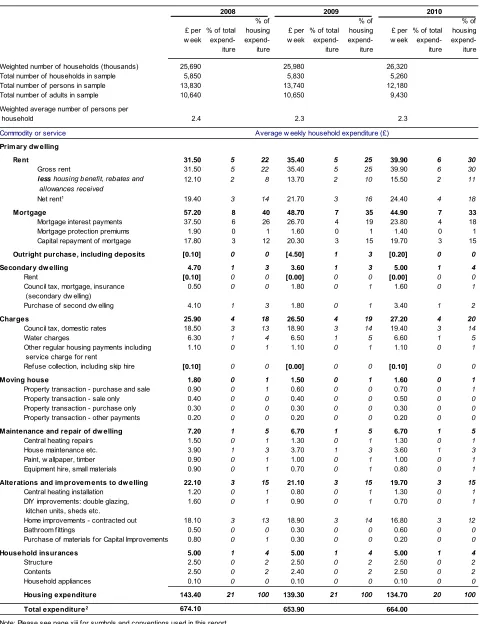
Table 2.2 shows expenditure on the items included in the comprehensive definition of housing expenditure. It also displays total household expenditure, which includes all expenditure items covered by the survey. The total expenditure figure reported here is therefore greater than the expenditure totals shown in the tables in Appendix A, as these exclude certain non-consumption costs.
Under the comprehensive definition of housing expenditure, UK households spent on average £134.70 a week on housing in 2010, which equates to a fifth (20 per cent) of total weekly expenditure. The COICOP definition of housing expenditure (excluding fuel and power) on the other hand, gave an average of £39.00 per week for each household (see Table A1).
In 2010 spending was highest on mortgages (interest payments, protection premiums and capital repayments) at £44.90 a week. The next highest expenditure was on charges (council tax or domestic rates, water charges, refuse collection and other regular services) at £27.20 a week. This was followed by net rent at £24.40 a week and household alterations and improvements at £19.70 per week. Figure 2.1 provides a breakdown of housing expenditure items as a proportion of housing expenditure.
Figure 2.1
Housing expenditure items as a percentage of total
housing
expenditure,
2010
United Kingdom
Mortgage 33%
Charges 20% Net rent
18% Alterations and improvements to dwelling
15%
Maintenance and repair of dwelling
5%
Secondary dwelling 4%
Household insurances 4%
Moving house 1%
Housing expenditure over time
Overall, expenditure on housing has decreased over the last three years, from £143.40 in 2008 to £134.70 per week in 2010. There was a decrease of £4.10 per week from 2008 to 2009, which was followed by a further decrease of £4.60 between 2009 and 2010. However, housing expenditure as a percentage of total expenditure has remained stable, decreasing by only 1 percentage point from 2008 (21 per cent) to 2010 (20 per cent). See Table 2.2 for a comparison of housing expenditure from 2008 to 2010.
Figure 2.2 presents the average weekly spend on each category of housing expenditure from 2008 to 2010. The largest decrease was seen in the mortgages category, which has decreased from £57.20 in 2008 to £44.90 in 2010. Spending has remained relatively consistent for most other categories, with slight downward trends in alterations and improvements to dwellings and upward trends in charges such as council tax and water.
Figure 2.2
Housing expenditure 2008 to 2010
United Kingdom
0 10 20 30 40 50 60
Mortgage Alteration and improvements to
dwelling
Charges Net rent Maintenance and repair of dwelling
Secondary
dwelling Householdinsurances Moving house £ per week
2008 2009 2010
Expenditure by gross income
Table 2.3 presents housing expenditure by gross income decile group (a decile is one-tenth of the distribution). Overall, spending on housing increased with income. The highest income group spent £318.20 per week, more than twice the average for all income groups (£134.70) and more than six times that of the lowest income group (£49.30).
The categories that showed the greatest variation by income are mortgages, and alteration and improvements to dwellings. Figure 2.3 shows expenditure on mortgages to be consistently higher through income deciles, up to a weekly average of £129.60 in the highest income decile.
Expenditure on alteration and improvements to dwellings increased with income, and displayed a sharp increase in the tenth decile group to £71.40 per week, almost double that of the ninth decile group (£36.20).
Office for National Statistics 0
20 40 60 80 100 120 140
1 2 3 4 5 6 7 8 9 10
Gross income decile group £ per week
Mortgage
Maintenance and repair of dwelling Net rent
[image:34.595.44.543.99.413.2]Alterations & improvements to dwelling Household insurances
Figure 2.3
Expenditure on selected items by gross income decile
group,
2010
United Kingdom
A different pattern can be seen when looking at net rent by income decile group; households in the second decile group spent the least on net rent at £18.30. Expenditure on rent was relatively consistent for higher income deciles, with the highest decile showing just the highest expenditure at £29.80. The exception was the ninth decile where expenditure was substantially lower at £19.10.
Expenditure on household insurances and on maintenance and repairs of dwellings increased slightly with income, but the increase was far less pronounced than for other categories.
Expenditure by age of the household reference person
Table 2.4presents average weekly expenditure by age of household reference person (HRP,
defined in Appendix B). Figure 2.4 presents spending on three key housing expenditure categories by age of HRP. Average weekly expenditure on mortgages peaked at £79.70 for households with an HRP aged 30 to 49. Average weekly expenditure for households with an HRP within the age range 50 to 64 was £42.20, and households with an HRP under 30 was even lower at £35.30. However, the average weekly spend for household alterations and improvements was highest for households with an HRP aged 50 to 64 at £26.20. Net rent expenditure decreased as the age of the HRP increased. Average weekly expenditure for households with an HRP under the age of 30 was £65.90, compared with £31.90 for households with an HRP aged between 30 and 49, and £7.00 for households with an HRP aged over 75.
Office for National Statistics 0
10 20 30 40 50 60 70 80 90
Mortgage Net rent Alterations and improvements to dwelling
£ per week Under 30 30 to 49 50 to 64 65 to 74 75 and over
0
Under 30 30 to 49 50 to 64 65 to 74 75 and over
Age of household reference person 10
20 30 40 50 60 70 80
£ per week
[image:35.595.62.521.102.397.2]2009 2010
Figure 2.4
Expenditure on selected items by age of household
reference person, 2010
United KingdomFigure 2.5 shows that expenditure on net rent for households with an HRP aged under 30 has decreased from £72.00 in 2009 to £65.90 in 2010. There were slight increases for HRP age groups over 30 and below 75.
Figure
2.5
Expenditure on net rent by age of household reference
person, 2009 and 2010
United Kingdom [image:35.595.70.527.481.803.2]Expenditure by region
Table 2.5, Figure 2.6, and Figure 2.7 show housing expenditure by UK country and region. Looking first at expenditure by country (Figure 2.6), households in England spent the most on housing at £139.20 a week, followed by Scotland (£121.80), Wales (£112.80) and Northern Ireland (£80.10).
Figure 2.6
Housing expenditure by Country, 2010
United Kingdom
0 20 40 60 80 100 120 140
Northern Ireland Wales Scotland England
£ per week
UK Average
Figure 2.7 shows housing expenditure by region and country (excluding England). Five English regions had average weekly household spends that were greater than the UK average. Housing expenditure was greatest in London at £199.00 a week, followed by the South East (£155.70) and South West (£153.10). Expenditure was lowest in Northern Ireland with an average spend of £80.10. The lowest spending in England was in the North East, where average weekly housing costs were £98.00.
Figure 2.7
Housing expenditure by UK regions and Countries, 2010
0 20 40 60 80 100 120 140 160 180 200
Northern Ireland North East Yorkshire and The Humber West Midlands Wales North West Scotland East Midlands East South West South East London
£ per week
UK Average
Variations in the total spending on housing are largely due to differences between regions in the average amount spent on rent and mortgages. Table 2.5 presentshousing expenditure by country and region, while Figures 2.8 and 2.9 present the percentage difference in each region from the UK average for net rent and mortgages, respectively. It is important to note that these figures include all households. Average expenditure on rent only by renters, and mortgages only by mortgage holders is examined later in the chapter.
Average weekly expenditure on net rent was £24.40(Table 2.5). Figure 2.8shows that expenditure was more than twice the average in London (£54.60), and slightly above average in the South East (£25.50); these were the only regions to exceed the UK average. Spending on net rent was lowest in Northern Ireland with an average weekly expenditure of £13.10, closely followed by the North East of England where the average weekly net rent was £15.80
Figure 2.8
Percentage difference compared with UK average for net rent
by
UK
Countries
and
regions,
2010
London South East
South West
East Wales Yorkshire & the Humber West Midlands Scotland North West North East Northern Ireland
-60 -40 -20 0 20 40 60 80 100 120 140
Percentage East Midlands
Figure 2.9 shows that London, the South East and the East of England had average mortgage payments above the UK average of £44.90; all other regions spent less on mortgages than the UK average. Expenditure on mortgages was lowest in Wales with average weekly mortgage payments of £34.90.
Figure 2.9
Percentage difference compared with UK average for
mortgage payments by UK Countries and regions, 2010
Wales Yorks & the Humber West Midlands North East North West East Midlands South West Northern Ireland Scotland South East
East London
-30 -20 -10 0 10 20 30 40
Percentage
Office for National Statistics
Expenditure by socio-economic classification
Figure 2.10 and Table 2.6 present housing expenditure by socio-economic classification of the household reference person (HRP). Households with an HRP in the ‘large employer and higher managerial’ occupation group spent the most, at £309.30 per week: more than twice that of households with an HRP in the ‘routine’ occupation group, where the average weekly spend was £114.30.
Figure 2.10
Housing expenditure by socio-economic classification of
household reference person, 2010
United Kingdom
0 100 200 300 400
Large employers & higher managerial
Higher
professional Lower managerial Intermediate Small employers Lower supervisory Semi-routine Routine
£ per week
Figure 2.11 presents expenditure on selected items by the socio-economic classification of the HRP. Overall, expenditure followed a similar pattern as described above, with those with an HRP classified as ‘large employer and higher managerial’ spending more than those in ‘routine’
occupations. The exception to this was net rent where the opposite pattern is observed and the highest expenditure was for the ‘routine’ occupation group, reflecting the high number of renters in this group.
Figure 2.11
Expenditure on selected items by socio-economic
classification of household reference person, 2010
United Kingdom0 20 40 60 80 100 120 140 160
Mortgage Net rent Alterations and improvements to dwelling
£ per week
Large employers & higher managerial Lower managerial Small employers Lower supervisory Routine
Analysis of housing costs for renters and mortgage holders
The following analysis looks at average expenditure on net rent for households that report
spending on net rent and average expenditure on mortgages for mortgage holders. This is the only place in Family Spending where averages are not across all households. Excluding households with nil expenditure for net rent and mortgages provides a more informative picture of expenditure on these items.
Table 2.8 provides expenditure on rent over the last three years. In 2010 renters spent on average £74.40 per week on net rent. Table 2.9 provides expenditure on mortgages over the last three years. In 2010 the average weekly expenditure on mortgages by mortgage holders was £130.80.
Table 2.10 and Figure 2.12 present average weekly expenditure for the relevant households by income decile group for mortgage holders and renters.
Figure 2.12 shows a steady increase in net rent as the income decile increases. Households in the first income decile spent £31.70 on net rent, compared with £146.80 in the ninth income decile and £255.20 in the tenth income decile. It should be noted, however, that a relatively small number of households in the highest income group paid rent. The estimate of net costs for this income group should therefore be viewed with caution. Average expenditure for mortgages followed a roughly similar pattern to net rent, increasing towards the higher income deciles. The fluctuations in the lower decile groups may be due to a low number of mortgage holders in this decile group, and should be viewed with caution.
Figure 2.12
Expenditure on net rent by renters, and mortgages by
mortgage holders, by gross income decile group, 2010
United Kingdom
0 50 100 150 200 250 300
1 2 3 4 5 6 7 8 9 10
Income decile group £ per week
Net Rent Mortgage Payment
Figure 2.13, and Figure 2.14 show net rent and mortgage expenditure, respectively, averaged across renters and mortgage holders, by country and region. The figures are presented in Table 2.11.
Figure 2.13
Expenditure on net rent by renters, by UK Countries and
regions, 2010
0 20 40 60 80 100 120 140
North East Northern Ireland Scotland Yorkshire & the Humber West Midlands North West East South West East Midlands Wales South East London
£ per week
UK Average
Figure 2.14
Expenditure on mortgages by mortgage holders by UK
Countries and regions, 2010
0 50 100 150 200
North East Wales Yorkshire & the Humber West Midlands North West Scotland Northern Ireland East Midlands South West South East East London
£ per week
UK Average
Table 2.11 shows the country with the highest average spend on net rent was England, which at £77.50 a week was above the UK average of £74.40. Wales had the next highest average weekly expenditure among UK countries on net rent at £72.50, followed by Scotland (£53.60) and Northern Ireland with the lowest average weekly spend (£47.40).
There were two regions that had average weekly expenditures on net rent greater than the UK average of £74.40. London spent the most on net rent by a substantial margin (£132.30), followed by the South East (£82.40). All the other regions had average weekly spends lower than the UK average. The region with the lowest average weekly expenditure on net rent was North East (£41.00).
Looking at expenditure on mortgages by country (Table 2.11), England at £134.20 was the onl