Original Article
Diagnostic values of C-reactive protein, procalcitonin
and serum amyloid A in predicting bacterial infection
in patients with acute exacerbations of chronic
obstructive pulmonary disease
Ge Xiong, Bin Qiao, Zegang Wu, Yan Li
Department of Clinical Laboratory, Renmin Hospital of Wuhan University, Wuhan City, China
Received February 7, 2017; Accepted March 13, 2018; Epub July 15, 2018; Published July 30, 2018
Abstract: Objective: To investigate the diagnostic values of C-reactive protein (CRP), procalcitonin (PCT) and se-rum amyloid A (SAA) in predicting bacterial infection in patients with acute exacerbations of chronic obstructive pulmonary disease (AECOPD). Methods: 78 patients diagnosed as AECOPD treated in Renmin Hospital of Wuhan University during 2014 January to 2016 January were included. Baseline information (age, sex, accompanied dis-eases, GOLD grade) was recorded in details. Sputa were collected on admission and were cultured for 72 hours. Blood samples were drawn for CRP, PCT and SAA. Results: 38 patients were diagnosed as bacterial infection and another 40 patients had no evidence of bacterial infection after sputum culturing. Differences of baseline
informa-tion between two groups had no statistical significance. CRP, SAA and PCT level of patients with bacterial infecinforma-tion were significantly higher than that of patients with no bacterial infection. Besides, purulent sputum, elevated SAA and PCT were significantly associated with bacterial infection after univariate and multivariate regression analy
-sis. Results of sputum culture showed that the three main pathogens were haemophilus influenzae (10 patients),
Pseudomonas aeruginosa (6 patients) and Streptococcus pneumoniae (5 patients). SAA of patients in haemophilus
influenzae (Hi) and Haemophilus parainfluenzae (Hpi) (Hi&Hpi) group were significant higher than that of patients
in other pathogens group, but no difference were observed between the two groups in level of CRP and PCT. AUCs of CRP, PCT and SAA in the diagnosis of bacterial infection in patients with AECOPD was 0.875, 0.941 and 0.854, respectively. Conclusion: We found that PCT was better than CRP and SAA in predicting bacterial infection in patients with AECOPD and therefore might be a useful clinical marker in guiding antibiotic therapy.
Keywords: C-reactive protein, procalcitonin, serum amyloid A, bacterial infection, exacerbations, COPD
Introduction
Chronic obstructive pulmonary disease (COPD) is a serious disease with high mortality. It was reported that there were 3 million people in the UK [1] had COPD and 8.2% adults older than 40 years suffered from COPD in China. It was esti-mated that COPD would become the third ca- use of global death in 2020 [2]. Exacerbations of COPD (AECOPD) is an acute worsening condi-tion of COPD, which always accompanied by clinical symptoms such as, shortness of breath and increased production of sputum. Respi- ratory infection (bacteria or viruses or mixed) is thought to be the main cause in most exacerba-tions. Studies had showed that about 30-50%
of exacerbations were caused by bacterial infections [3]. It was still difficult to discriminate bacterial or viral infections in exacerbations. Patients with exacerbations of COPD caused by bacteria will be advised to receive antibiotic treatment as soon as possible, but difficulties in differential diagnosis make it impossible, especially in patients with no purulent sputum [4].
detec-tion rate [5] and bacterial infecdetec-tion [6]. In- teresting, in other clinical studies, CRP level showed no association with bacterial infection [4] and whether it could be used as an diagnos-tic marker in bacterial infection in exacerba-tions is still unclear [7]. Besides, procalcitonin (PCT), as an inflammatory blood marker, had a important role in the guidance of antibiotic treatments in patients with exacerbations of COPD [8]. But the role of PCT in differentiating bacterial from viral causes is still unknown. Serum amyloid A (SAA) is an acute phase pro-tein, which is similar to CRP and SAA, may be a better marker in early diagnosis of bacterial infections [9-11]. Study showed that patients with neutrophilic exacerbations of COPD were accompanied by higher concentrations of se- rum SAA and CRP [12]. But no clinical study had conducted to investigate to the role of SAA in predicting bacterial infection in patients with exacerbations of COPD.
Therefore, we conducted this prospective study to compare CRP, PCT and SAA levels in patients with bacterial infection and no bacterial infec-tions. And also we aimed to explore the diag-nostic roles of CRP, PCT and SAA of bacterial infection in patients with exacerbations of COPD.
Chronic Obstructive Lung Disease (GOLD) guidelines as it described in previous study [13]. Patients were grouped according their sputum culture. Patients with positive sputum culture results were in Bacteria detected group, otherwise patients would be included in no- Bacteria detected group. All patients signed an informed consent.
Samples
Blood and sputum were collected on admis-sion. Sputum was examined by Gram stain and was cultured for 72 hours. Blood samples were drawn for CRP, PCT and SAA. These biomarkers were all measured by standard methods in the department of Clinical laboratory in Renmin hospital of Wuhan University. Normal value of biomarkers were as follows: CRP 0~10 mg/L, PCT <0.05 ng/ml, SAA 0~10 mg/L.
Statistical analysis
[image:2.612.91.352.84.361.2]The descriptive analysis (mean, standard de- viation, median) was used for continuous vari-ables and percentage for categorical varivari-ables. Comparisons used the t test or One-Way ANOVA analysis for continuous variables. Details of results of culture sputum were recorded and Table 1. Baseline information of the total population
Variables detected n (%)Bacteria detected n (%)No bacteria P value
Number of patients 38 40
-Gender (male) 24 (63.16) 22 (55.00) 0.46 Age 61.13±7.49 62.63±8.40 0.41 Smoking history
Current 11 (28.95) 10 (25.00) 0.45 Former 14 (36.84) 13 (32.50) Never 13 (34.21) 17 (42.50) -Hypertension 10 (26.32) 9 (22.50) 0.69 Diabetes 5 (13.16) 8 (20.00) 0.42 Temperature on admission 36.95±0.44 36.83±0.39 0.21 GOLD I-II 11 (28.95) 24 (60.00) 0.006 GOLD III-IV 27 (71.05) 16 (40.00)
Purulent sputum 20 (52.63) 13 (32.50) 0.07
Duration of hospitalization 10.55±2.53 8.28±2.41 <0.001 Biomarkers
CRP 56.65±31.65 19.62±8.78 <0.001 SAA 53.73±23.33 25.20±14.44 <0.001 PCT 1.63±0.85 0.35±0.27 <0.001 WBC 10.56±2.33 9.73±2.36 0.12
Patients and methods
Patients
we used Box-plot to present levels of biomark-ers between different bacterial group. The association between variables and bacteria was evaluated by using univariate and multi-variate logistic analysis. Receiver operating ch- aracteristic (ROC) curves was used to accessed the variables’ prediction ability. Statistical anal-yses were conducted using SPSS 21 and Medcalc and P value <0.05 were considered statistically significant.
Results
Baseline demographic data of patients with AECOPD
78 patients with AECOPD were included in this study. There were 38 patients were diagnosed as bacterial infection and another 40 patients had no evidence of bacterial infection after sputum culturing. Patients in two groups had no difference in gender, age, accompanied dis-eases, temperature. There were 27 patients of AECOPD with bacterial infection in GOLD stage III-IV. Only 13 patients were in GOLD stage III-IV in culture negative group. There were no pa- tients died during hospitalization. Details of baseline information of patients included in this study were showed in Table 1.
ciated with bacterial infection. Details were showed in Table 2.
Pathogens of sputum culture
[image:3.612.90.372.73.298.2]We recorded the results of sputum culture and the results showed that the three main bacteria in sputum culture were haemophilus influen-zae, Pseudomonas aeruginosa and Strepto- coccus pneumoniae. Details of causative pathogens in patients of AECOPD with bacterial infection were showed in Table 3. In order to investigate if there were any differences among patients with different causative pathogens in CRP, SAA and PCT, we merged patients infected with haemophilus influenzae (Hi) and patients infected with Haemophilus parainfluenzae (Hpi) into one group and patients infected with other pathogens in another group. The results sh- owed that SAA of patients in Hi&Hpi group were significant higher than that of patients in other pathogens group (62.88±22.37 vs 47.76± 21.97, p=0.043). But no difference were ob- served between the two groups in level of CRP and PCT (61.84±28.83 vs 53.27±32.93, p=0.41; 1.62±0.69 vs 1.64±0.93, p=0.94, respectively). Comparison of CRP, SAA, WBC and PCT between different bacteria positive group were show in Box plot (Figure 2).
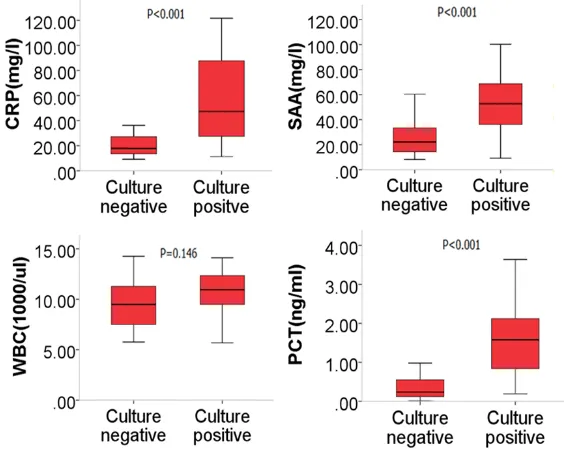
Figure 1. Comparison of CRP, SAA, WBC and PCT between culture posi-tive and culture negaposi-tive group of AECOPD. CRP, SAA and PCT level of
pa-tients with bacterial infection were significant higher than that of papa-tients
with on bacterial infection (56.65±31.65 vs 19.62±8.78, 53.73±23.33 vs 25.20±14.44, 1.63±0.85 vs 0.35±0.27, all p<0.001, respectively).
Biomarkers’ level in different patients with AECOPD
Comparison of CRP, SAA, WBC and PCT between culture positive and culture negative group of AECOPD were shown in Figure 1. CRP, SAA and PCT level of patients with bac-terial infection were signifi-cantly higher than that of patients with no bacterial infection (56.65±31.65 vs 19.62±8.78, 53.73±23.33 vs 25.20±14.44, 1.63±0.85 vs 0.35±0.27, all p<0.001, res- pectively).
Univariate and multivariate regression
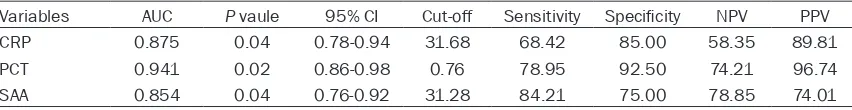
Diagnostic value of biomarkers in predicting bacterial infections
We performed the receiver operating charac-teristic curves (ROC) to assess the relation- ship between biomarkers and the bacterial infection in patients with AECOPD (Figure 3). Area under curves (AUCs) were calculated and as well as the sensitivity and specificity. The results showed that AUCs of CRP, PCT and SAA in the diagnosis of bacterial infection in patients with AECOPD were 0.875, 0.941 and 0.854, respectively. Diagnostic value of SAA was lower than PCT (P=0.03), but made no difference from CRP (P=0.74). The resulting specificity of PCT were as high as 92.50% and sensitivity of SAA were the highest among three biomarkers (sensitivity of SAA, 84.21%). Details were showed in Table 4.
Discussion
We confirmed the fact that CRP and PCT had an important role in predicting bacterial infection in patients with AECOPD and also found that SAA had higher sensitivity in predicting bacte-rial infection than CRP and PCT in patients with AECOPD. Besides, AECOPD patients seemed to have higher level of SAA on admission if they were infected with Hi or Hpi.
CRP level had been reported to be elevated in patients with AECOPD, especially in patients with increased sputum purulence on admission [14]. Ahmet Bircan found that the level of CRP in patients with AECOPD were significantly high-er than that of patients with stable COPD. What’s more, the value of CRP in discriminating bacterial AECOPD from nonbacterial AECOPD was acceptable. In another study, higher level CRP was observed in bacterial AECOPD com-pared with nonbacterial AECOPD and the cutoff values for CRP was 19.65 mg/L with a sensitiv-ity of 78.18% and specificsensitiv-ity of 84.61% [15]. It was interesting that we obtained similar results with Chunhong peng. ACU of CRP in predicting bacterial infection in patients with AECOPD was 0.875 and sensitivity and specificity was 68.42% and 85.00%, respectively. But the cut-off for CRP in our study was 31.68 mg/l. So it was obvious that results varied among studies. The reasons for the differences might be that patients with COPD in different studies were treated with different dosage and kinds of anti-biotics and systemic steroids. Besides, inclu-Table 2.Univariate and Multivariate analyses for influencing factors of bacterial infection in AECOPD
patients
Variables Univariate analyses Multivariate analyses OR (95% CI) P Value OR (95% CI) PValue
Age 0.98 (0.92-1.03) 0.41 -
-Male 0.95 (0.66-2.62) 0.82 -
-Current smoking 2.50 (1.42-7.49) 0.13 -
-Hypertension 1.23 (0.44-3.46) 0.70 -
-Diabetes 0.61 (0.18-2.05) 0.42 -
-Temperature on admission 2.08 (0.66-6.58) 0.22 - -GOLD III-IV 3.68 (1.43-9.47) 0.007 7.21 (0.20-26.22) 0.28 Purulent sputum 2.31 (0.92-5.78) 0.074 4.51 (2.18-6.05) 0.04 CRP 1.13 (1.05-1.20) <0.001 1.21 (0.95-1.52) 0.12 SAA 1.08 (1.04-1.12) <0.001 1.21 (1.01-1.44) 0.04
WBC 1.19 (0.97-1.45) 0.09 1.43 (0.80-2.55) 0.23
[image:4.612.94.524.95.283.2]PCT 16.42 (5.69-59.14) <0.001 5.47 (1.32-9.05) 0.03
Table 3. Bacterial species in culture positive group
Pathogen Bacteria detected, n (%)
Haemophilus influenzae 10 (26.32)
[image:4.612.92.301.328.464.2]sion and exclusion criterion differed among studies and thus brought additional influence to the level of CRP. So we should be cautious in dealing with these results. It was sure that CRP, as an inflammatory and acute phase protein, was certainly elevated in bacterial exacerba-tion which might causing more systemic inflam-mation than nonbacterial exacerbations [16]. But the role of CRP in predicting bacterial infec-tion in patients with AECOPD were still unclear and more clinical studies with strict inclusion and exclusion criterion should be performed to investigate the role of CRP in AECOPD.
[image:5.612.91.283.70.449.2]In previous study, Christ-crain found that pa- tients in PCT group had a relative risk of 0.49 compared with standard group of antibiotic exposure [17]. Despite the fact that PCT is an important biomarker in guiding antibiotic thera-py in AECOPD patients with bacterial infection, there were still several studies demonstrated no differences in PCT level between bacteria and nonbacterial AECOPD [18, 19]. Daniels JM found that PCT was no different between bacte-rial and nonbactebacte-rial AECOPD and patients with low PCT do benefit from antibiotic therapy. What’s more, they found CRP was a more value biomarker in bacterial AECOPD patients. While in our study and several studies conducted by others, results showed that patients with bac-terial infection had significant higher level of PCT than nonbacterial infection patients. Besides, PCT was significantly associated with bacterial infection in AECOPD patients after univariate and multivariate analysis. Similar results were reported in the previous study [20]. Specificity of PCT in discriminating bacte-rial from nonbactebacte-rial AECOPD varied from studies. GEIJN found specificity of PCT in pre-dicting bacterial infection was 39% with AUC of 0.735, which was quite different from the results in other studies. Cut-off value for procal-citon was 1.03 ng/ml with a specificity of 83% and sensitivity of 40% in previous study [21]. In our study, we demonstrated that PCT had a highest specificity in predicting bacterial infec-tion in AECOPD patients compared with SAA and CRP. Interestingly, the cutoff values for PCT
Figure 2. Comparison of CRP, SAA, WBC and PCT between different bacteria positive group. SAA of
patients in Hi&Hpi group were significant higher
than that of patients in other pathogens group (62.88±22.37 vs 47.76±21.97, p=0.043). But no difference were observed between the two groups in level of CRP and PCT (61.84±28.83 vs 53.27±32.93, p=0.41; 1.62±0.69 vs 1.64±0.93, p=0.94, respec-tively).
[image:5.612.324.523.72.226.2]was 0.76 and the AUC was as high as 0.941. So we believed that PCT was a valuable biomarker in predicting bacterial infection in AECOPD patients.
Serum Amyloid A (SAA) were strongly induced in the liver by systemic infection. Several studies had demonstrated that SAA could be used as a predictable biomarker in patients with infection related diseases [22, 23]. But Junyan QU found that SAA was not a valuable biomarker in dis-criminating bacterial infection from nonbacte-rial infection [24]. Few studies were performed to investigated SAA and its role of SAA in pre-dicting bacterial infection in AECOPD patients was still unclear. Gao, P found that patients with exacerbations of COPD were accompanied by higher concentration of serum SAA. This was the first studies to investigate SAA as predict-able biomarker in bacterial AECOPD. We found that SAA was significantly higher in patients with bacterial AECOPD than nonbacterial AECOPD. What’s more, the AUC of SAA was 0.854, which was comparable with CRP in AECOPD patients. The cutoff value was 31.28 mg/l with a specificity of 75.00% and sensitivi-ty of 84.21%. Interestingly, AECOPD patients seemed to have higher level of SAA on admis-sion if they were infected with Hi or Hpi. The results in our study showed SAA was a promis-ing biomarker in predictpromis-ing bacterial AECOPD, although more studies were still needed. Study focused on comparison between CRP and PCT in predicting bacterial AECOPD were limited. Chih-Hao Chang reported that CRP and PCT had no difference in differentiate bacterial or viral infection in AECOPD [25]. While in another study, they demonstrated that PCT was better than CRP and neutrophil/lymphocyte ratio in predicting bacterial AECOPD, but the specificity was less than 80% and AUC was rel-atively low. AUC of PCT was higher that CRP in discriminating bacterial and nonbacterial AECOPD and PCT was better both in sensitivity and specificity when compared with CRP in our study. Still there was no other study performed to compared the diagnostic role of CRP, PCT
Although studies varied in results, but the roles of CRP, PCT and SAA in predicting bacterial infection in patients with AECOPD were still promising. Our study provided more evidences to support the fact that CRP, PCT and SAA could be used as biomarkers in predicting bacterial infection in patients with AECOPD and there-fore might be useful clinical markers in guiding antibiotic therapy.
Disclosure of conflict of interest
None.
Address correspondence to: Yan Li, Department of Clinical Laboratory, Renmin Hospital of Wuhan Uni- versity, No. 238 Jiefang Road of Wuchang District, Wuhan 430060, China. Tel: +86-27-88071553; E-mail: 2590246443@qq.com
References
[1] Stang P, Lydick E, Silberman C, Kempel A and Keating ET. The prevalence of copd: using smoking rates to estimate disease frequency in the general population. Chest 2000; 117: 354S-359S.
[2] Ansarin K, Rashidi F, Namdar H, Ghaffari M
and Sharifi A. Echocardiographic evaluation of the relationship between inflammatory factors
(il6, tnfalpha, hs-crp) and secondary pulmo-nary hypertension in patients with copd. A cross sectional study. Pneumologia 2015; 64: 31-35.
[3] Chang CH, Tsao KC, Hu HC, Huang CC, Kao KC, Chen NH, Yang CT, Tsai YH and Hsieh MJ. Procalcitonin and c-reactive protein cannot dif-ferentiate bacterial or viral infection in copd exacerbation requiring emergency department visits. Int J Chron Obstruct Pulmon Dis 2015; 10: 767-774.
[4] Allegra L, Blasi F, Diano P, Cosentini R, Tarsia P, Confalonieri M, Dimakou K and Valenti V. Sputum color as a marker of acute bacterial exacerbations of chronic obstructive pulmo-nary disease. Respir Med 2005; 99: 742-747. [5] Clark TW, Medina MJ, Batham S, Curran MD,
[image:6.612.93.519.84.139.2]Parmar S and Nicholson KG. C-reactive protein level and microbial aetiology in patients hospi-talised with acute exacerbation of copd. Eur
Table 4.Diagnostic value of variables for bacterial infection in AECOPD
[6] Weis N and Almdal T. C-reactive protein--can it be used as a marker of infection in patients with exacerbation of chronic obstructive pul-monary disease? Eur J Intern Med 2006; 17: 88-91.
[7] Tanriverdi H, Ornek T, Erboy F, Altinsoy B, Uygur F, Atalay F and Tor MM. Comparison of diag-nostic values of procalcitonin, c-reactive pro-tein and blood neutrophil/lymphocyte ratio levels in predicting bacterial infection in
hospi-talized patients with acute exacerbations of
copd. Wien Klin Wochenschr 2015; 127: 756-763.
[8] Stolz D, Christ-Crain M, Bingisser R, Leuppi J,
Miedinger D, Muller C, Huber P, Muller B and Tamm M. Antibiotic treatment of exacerbations
of copd: a randomized, controlled trial compar -ing procalcitonin-guidance with standard ther-apy. Chest 2007; 131: 9-19.
[9] Qu J, L X, Liu Y and Wang X. Evaluation of pro-calcitonin, c-reactive protein, interleukin-6
& Serum amyloid a as diagnostic bio -markers of bacterial infection in febrile pa-tients. Indian J Med Res 2015; 141: 315-321. [10] Andersson M, Ruber M, Ekerfelt C, Hallgren
HB, Olaison G and Andersson RE. Can new
in-flammatory markers improve the diagnosis of
acute appendicitis? World J Surg 2014; 38: 2777-2783.
[11] Abbas MH, Choudhry MN, Hamza N, Ali B,
Amin AA and Ammori BJ. Admission levels of serum amyloid a and procalcitonin are more predictive of the diagnosis of acute appendici-tis compared with c-reactive protein. Surg Laparosc Endosc Percutan Tech 2014; 24: 488-494.
[12] Gao P, Zhang J, He X, Hao Y, Wang K and
Gibson PG. Sputum inflammatory cell-based classification of patients with acute exacerba -tion of chronic obstructive pulmonary disease. PLoS One 2013; 8: e57678.
[13] van de Geijn GM, Denker S, Meuleman-van WV, Koeleman HG, Birnie E, Braunstahl GJ and Njo TL. Evaluation of new laboratory tests to discriminate bacterial from nonbacterial chro- nic obstructive pulmonary disease exacerba-tions. Int J Lab Hematol 2016; 38: 616-628. [14] Weis N and Almdal T. C-reactive protein--can it
be used as a marker of infection in patients with exacerbation of chronic obstructive pul-monary disease? Eur J Intern Med 2006; 17: 88-91.
[15] Peng C, Tian C, Zhang Y, Yang X, Feng Y and Fan H. C-reactive protein levels predict bacte-rial exacerbation in patients with chronic ob-structive pulmonary disease. Am J Med Sci 2013; 345: 190-194.
[16] Stolz D, Christ-Crain M, Morgenthaler NG,
Leuppi J, Miedinger D, Bingisser R, Muller C, Struck J, Muller B and Tamm M. Copeptin, c-reactive protein, and procalcitonin as prognos-tic biomarkers in acute exacerbation of copd. Chest 2007; 131: 1058-1067.
[17] Christ-Crain M, Jaccard-Stolz D, Bingisser R,
Gencay MM, Huber PR, Tamm M and Muller B. Effect of procalcitonin-guided treatment on an-tibiotic use and outcome in lower respiratory tract infections: cluster-randomised, single-blinded intervention trial. Lancet 2004; 363: 600-607.
[18] Soler N, Esperatti M, Ewig S, Huerta A, Agusti C and Torres A. Sputum purulence-guided antibi-otic use in hospitalised patients with exacerba-tions of copd. Eur Respir J 2012; 40: 1344-1353.
[19] Daniels JM, Schoorl M, Snijders D, Knol DL, Lutter R, Jansen HM and Boersma WG. Procalcitonin vs c-reactive protein as predic-tive markers of response to antibiotic therapy in acute exacerbations of copd. Chest 2010; 138: 1108-1115.
[20] Colak A, Yilmaz C, Toprak B and Aktogu S.
Procalcitonin and CRP as biomarkers in dis-crimination of community-acquired pneumo-nia and exacerbation of COPD. J Med Biochem 2017; 36: 122-126.
[21] Tanriverdi H, Ornek T, Erboy F, Altinsoy B, Uygur F, Atalay F and Tor MM. Comparison of diag-nostic values of procalcitonin, c-reactive pro-tein and blood neutrophil/lymphocyte ratio levels in predicting bacterial infection in
hospi-talized patients with acute exacerbations of
copd. Wien Klin Wochenschr 2015; 127: 756-763.
[22] Lowe GD. The relationship between infection,
inflammation, and cardiovascular disease: an
overview. Ann Periodontol 2001; 6: 1-8. [23] Azurmendi L, Degos V, Tiberti N, Kapandji N,
Sanchez P, Sarrafzadeh A, Puybasset L, Turck N and Sanchez JC. Measuring serum amyloid a
for infection prediction in aneurysmal sub-arachnoid hemorrhage. J Proteome Res 2015; 14: 3948-3956.
[24] Qu J, L X, Liu Y and Wang X. Evaluation of pro-calcitonin, c-reactive protein, interleukin-6
& Serum amyloid a as diagnostic bio -markers of bacterial infection in febrile pa-tients. Indian J Med Res 2015; 141: 315-321. [25] Chang CH, Tsao KC, Hu HC, Huang CC, Kao KC,