Abstract— Classification assigns a discrete value named label to each sample in a dataset with respect to its feature values. In this research, we aim to consider some datasets which contain a few samples whereas a huge amount of features are provided for each sample. Most of biological datasets such as micro-arrays has this property. A fundamental contribution of this article is a major extension of pervious works for crisp data clustering. The new approach is based on fuzzy feature clustering which is utilized to select the best features (genes). The proposed method has two advantages over the crisp method. Firstly, it leads to more stability and faster convergence; secondly, it improves the accuracy of the classifier using the selected features. Moreover, in this paper a novel method has been proposed for the discretization of continuous data using the Fisher criterion. In addition, a new method for initialization of cluster centers is suggested. The proposed method has achieved a considerable improvement compared with the crisp version. The leukemia dataset has been used to illustrate the effectiveness of the method.
Index Terms— Bioinformatics, Feature Selection, Fuzzy
Logic, Clustering, Mutual Information
I. INTRODUCTION
By now, many applications have been introduced in which, feature selection is utilized as a preprocessing stage for classification. This process speeds up both the training and reasoning stages, reduces memory space, and improves classification accuracy. Reducing the cost of gathering data is another advantage of feature selection. Biological data (e.g. micro-arrays) are usually wide and shallow. In other words, huge amount of features (genes) vs. small number of data samples is the sailent property of these datasets. Examples of applications which use wide and shallow datasets are as follows:
• Classification of gene expression profiles in micro-arrays considering expression levels of its huge amount of genes.
• Predicting structure of proteins based on associated DNA sequence.
• Diagnosing some psychological diseases based on
E. Chitsaz is with the Computer Science & Engineering dept., Shiraz University in Master degree for Artificial Intelligence. Shiraz University, Shiraz, IRN. ([email protected])
M. Taheri is with the Computer Science & Engineering dept., Shiraz University in Master degree for Artificial Intelligence. Shiraz University, Shiraz, IRN. ([email protected])
Seraj D. Katebi, faculty member of Computer Science & Engineering dept., Shiraz University, Shiraz, IRN. ([email protected])
EEG features.
Small number of samples narrows the acquirable knowledge. Hence it reduces the probability of correct reasoning whether a specified feature effects on the class label or not. Moreover, a classifier can generate the classification rules more easily with small number of features. But increasing the number of features may lead to ambiguity in training so that it would not even converge.
In addition, the more features, the more processing time and memory space is needed. But a few influential features are usually adequately used in classification of samples. Indeed:
• The class label is usually independent of the most of features.
• Some features may be correlated and selecting only a few candidates seems to be sufficient for classification.
Finding proper features has been the subject of various approaches in the literature. (e.g. filter, wrapper, and embedded approaches [5], greedy [18], statistical approaches such as the typical principle component analysis (PCA) method [2] and the linear discriminant analysis (LDA) method [1], GA [6, 15], Neural Network [16], Fuzzy Systems [14, 17], mutual information-based feature selection[19,20]. Selection of the most influential genes, for classification of samples in micro-arrays, is one of the well known topics in which many investigations have been carried out. In the context of microarrays and LDA, wrapper approaches have been proposed [8]. Recently, biclustering algorithms [7, 21] have been proposed to cluster both genes and samples simultaneously. Wai-Ho Au et al., in 2005 [9], proposed a feature selection technique based on clustering the correlated features by a semi-k-means method named k-modes.
In this paper a novel approach which uses fuzzy version of k-mode has been proposed for grouping interdependent genes. The fuzzy approach considers uncertainty, achieves more stability and consequently improves the classification accuracy. In addition, other modifications have implemented to fuzzify the selection of the best features from each cluster. A new method to initialize cluster centers has also been applied in this work. Moreover, a novel discretization method based on Fisher criterion [1] is also proposed.
C4.5 [3] classifier has been applied in the final stage to asses the feature selection process. Leukemia dataset [10], a micro-array data containing 73 samples and 7129 genes, is used in all experimental results.
In the next section, k-means [11] and its fuzzy version [4] are briefly presented. In Section III, the previous work of
A Fuzzy Approach to Clustering and Selecting
Features for Classification of Gene Expression
Data
feature selection by clustering on Micro-arrays [9] is explained following by its fuzzy approach in section IV. In section V, a novel method of discretization of continuous data and a new method for initializing cluster centers are proposed. Experimental results are presented and explained in section VI. Finally we draw our conclusion in section VII.
II. CLUSTERING METHODS
In this section, k-means [11] as a well known classic clustering method and its fuzzy approach are briefly described. In the Attribute Clustering Algorithm (ACA) which is explained in the next section, a modified version of k-means, named k-modes, is used to cluster the features (genes) into disjoint categories as a preprocessing for feature selection. But in proposed fuzzy approach, a fuzzy k-modes based on fuzzy k-means has been used as a part of novel works in this paper.
A. k-means clustering
The k-means algorithm groups a collection of vectors into k groups and finds a cluster center in each group in the way that a cost function shown in (1) is minimized.
(
)
∑ ∑
∑
= ∈ =⎟⎟
⎠
⎞
⎜⎜
⎝
⎛
=
=
kr x G r k r r r
c
x
d
J
J
1 2 1,
(1) Where, k is the number of clusters, Gr and cr are the set of rth cluster and its associated center respectively. xpresents a data point and d(a,b) is the distance functional (usually Euclidean distance) between a and b.In this method the value of k should be determined first. This value is fixed during the execution of the algorithm. The algorithm is summarized in the following steps:
Step1: Initializes the k cluster centers randomly
Step2: while the stop condition is not satisfied do the following:
a: Assign each vector to a cluster with nearest center. b: Update cluster centers to the average of vectors belong to that cluster in order to decrease the cost function (1). B. Fuzzy k-means
In this method a data point can belong to several groups with a membership degree between 0 and 1 which is shown by a matrix Uk×m where k is number of clusters and m is number of data points such that the condition in (2) is satisfied.
n
i
u
c rri
1
,
1
,...,
1
=
∀
=
∑
= (2) Where, uri is the membership degree of ith pattern in rth cluster. The cost function used in this method is shown in (3).∑∑
∑
= = = = k r ni i r
m ri k
r r
k J u d x c
c c U J 1 2 1
1,..., ) ( , )
, (
(3) In order to minimize the cost function, membership degrees and cluster centers, in each iteration, are computed by (4) and (5) respectively.
( )
∑
= −⎟⎟
⎠
⎞
⎜⎜
⎝
⎛
=
k l m l i r i ric
x
d
c
x
d
u
1 1 2)
,
(
)
,
(
1
(4)∑
∑
= ==
n j m rj n i i m ri ru
x
u
c
1 1 (5)Where, xi represents the ith pattern in dataset. This method performs the following steps.
Step1: Initializes the k fuzzy cluster centers randomly Step2: while the stop condition is not satisfied do the following:
a: Compute the membership matrix U according to (4). b: update fuzzy cluster centers according to (5).
III. RELATED WORK
The attribute clustering algorithm (ACA) has been applied by Wai-Ho Au et al., in 2005 [9], for grouping, selection, and classification of gene expression data which consists of a large number of genes (features) but a small number of samples.
This approach finds c disjoint clusters and assigns each feature to one of the clusters. The genes in each cluster should have high a correlation with each other while they are low correlated to genes in other clusters. This method uses the interdependence redundancy measure as the similarity measure.
To cluster features, the k-modes algorithm is utilized which is similar to the well known clustering method, k-means. Mode of each cluster is defined as one of its features which has the largest multiple interdependence redundancy measure among other features in that cluster. The multiple interdependence redundancy measure is calculated for each feature by (6).
( )
∑
(
)
≠∈
=
i j Clusteri A j i i j
A
A
R
A
MR
), (:
(6)Where, Cluster(i) is the set of features which are in the same cluster with Ai and is the interdependence measure between the two features, Ai and Aj, which is defined by (7).
(
) (
(
)
)
j i j i j iA
A
H
A
A
I
A
A
R
:
:
:
=
(7)Where, I(Ai:Aj) is the mutual information between Ai and Aj as computed in (8).
(
)
(
)
(
i ik)
(
j jljl j ik i m k m
l i ik j jl j i v A v A v A v A v A v A A A I i j = = = = = = =
∑∑
= = Pr Pr ^ Pr log ^ Pr ) : ( 1 1 (8)H(Ai:Aj) is joint entropy of Ai and Aj which is given by (9).
(
(
i ik j jl)
m k m l jl j ik i j i v A v A v A v A A A H i j = = = = − =
∑∑
= = ^ Pr log ^ Pr ) : (H(Ai:Aj) is used to normalize I(Ai:Aj) in (7). The larger value for I(Ai:Aj), the higher interdependency of two features, Ai and Aj. Hence, there should be some pairs of values for these features which are simultaneously visited with high frequency and other pairs are less probable. Therefore, having one of the values, other one may be approximated considering value pairs with high probability.
K-modes is different from k-means in two points. First, mode of each cluster is selected as the cluster center instead of the mean. Second, use of Euclidean distance as the dissimilarity measure is substituted by the interdependency between attributes as a similarity measure.
In ACA method, genes are grouped into different clusters. A cluster is a set of features which are more correlated in comparison with features in other clusters. Hence, if there is a missed value for one of these features, it may be approximated considering other co-cluster features one by one. Therefore, a few features in each cluster may be sufficient to present properties of samples. But the selected features should be overall correlated with other features in the same cluster. This is the motivation of selecting features with highest multiple interdependence redundancy measure, as defined by (6), to represent the cluster.
Computing interdependency is defined on just discrete data types. Therefore, to determine the interdependence measure between two features, the range of all continuous features should be first discretized into a finite number of intervals. This is done by the Optimal Class-Dependent Discretization algorithm (OCDD); although we have presented a novel discretization in section 5.
IV. THE PROPOSED FUZZY APPROACH
Figures A novel method is proposed which combines the effectiveness of ACA with fuzzy k-means algorithm. In this method each feature is assigned to different clusters with different degrees. This comes from the idea that each gene may not belong to just one cluster and it is much better to consider the correlation of each gene to features in entire clusters. Hence, during the selection of the best features, more accurate relations between genes are available. The main point here is that in selecting each feature, it is considered among the entire clusters not just one. Hence, in this case a feature, which is not correlated enough with members of one cluster but its correlation among entire clusters is high, gains more chance to be selected in comparison with crisp ACA. In this method better features might be selected for classification stage over crisp method. The stability of fuzzy clustering is also much higher in comparison with k-modes according to experimental results. In addition, Fuzzy Attribute Clustering Algorithm (FACA) converges smoothly whereas k-modes in ACA often oscillates between final states.
In the proposed method matrix Uk×m represents the membership degree of each gene in each cluster where k is the number of clusters that is fixed and determined at first and m is the number of features. Matrix U is computed by (10), a modified version of (4), where distance functional is defined as the inverse of interdependency measure.
(
)
(
)
∑
=
−
⎟⎟
⎠
⎞
⎜⎜
⎝
⎛
=
k
c
m
r i
c i ri
A
R
A
R
u
1
1 2
,
,
1
η
η
(10)Where, k is number of clusters. uri is membership degree of ith feature in rth cluster and m is a weighting exponent. Afterwards, to satisfy (2), uri is normalized by (11).
∑
=
=
kl old li new ri new ri
u
u
u
1
(11)
According to this membership matrix, fuzzy multiple interdependence redundancy measure is defined by (12) which is a modified version of (6).
∑
=
=
kl old li new ri new ri
u
u
u
1
(12)
Where, p is the total number of features and r is the cluster number in which the multiple interdependence redundancy measure of feature Ai is calculated. Hence, in calculating MRr(Ai) the entire features are considered.
Indeed, fuzzy multiple interdependence redundancy measure should be computed for each cluster separately since each feature is not belonged to just one cluster. In this approach, mode of a cluster is updated to the feature with the highest fuzzy multiple interdependence redundancy in that cluster. Fuzzy multiple interdependence redundancy of each feature should be calculated regardless of its own membership degree in associated cluster. Considering this membership degree, mode of each cluster will never change, since it has high membership degree in that cluster.
The objective function in the proposed fuzzy method is computed as (13).
(
)
∑∑
= =
=
k rp
i
r i m ri
R
A
u
J
1 1
:
η
(13) Where, k and p are the number of clusters and features respectively and ηr is mode of rth cluster which represents center of that cluster.Selection of the best features is based on the rank of each feature which is calculated as (14).
( )
r( )
ik
r m ri
i
u
MR
A
A
rank
∑
=
=
1(14) The final stage is the classification of data points according to selected features. The following items encouraged us to use C4.5 as the final classifier for assessment of the proposed feature selection.
• Both C4.5 and proposed feature selection method can be applied just on discrete features.
• C4.5 is a well known decision tree technique with high performance which is used as a benchmark in many articles in the state of the art.
• To determine the priority of features, it uses Information gain and Entropy which are similar to mutual information (I) and joint entropy (H), respectively.
function defined in (13) is the same as previous iteration with a predefined precision. A maximum number of iterations have also been defined.
V. TECHNICAL INNOVATIONS
As described in the previous sections, to calculate mutual information, data should be discretized before feeding them to the feature selection system. Also k-means clustering method and its versions used in this paper are sensitive to the initial centers of clusters. Therefore, a technical method is proposed here, to specify the initial cluster centers.
A. Discretization
ACA uses a global optimal discretization method, OCDD [22], to discretize the continuous features into a predefined number of nominal values. OCDD and ACA are homogeneous, since, discretization is done by optimizing interdependence redundancy measure between any feature and the class labels. But to find the global optimal solution, an iterative fractional programming is combined by a dynamic programming methodology.
In this paper a novel discretization technique has been used which aims to optimize another criterion introduced by Fisher. A brief description of a local unsupervised static version of this discretization, which is used in this article for simplicity and high speed, is explained below. All experimental results, even for ACA, are produced by this discretization technique to have the same conditions in comparing different methods.
In the field of feature extraction, Fisher introduced a criterion to be maximized which represents the linear distinguishability of labeled patterns, as shown in (15).
(
)
∑
∑
= =
−
=
classesj j classes
j j
F
S
m
m
J
1 2 1
2
(15)
Where, ||classes|| is the number of classes, m is the mean of patterns and mj and Sj are mean and standard deviation of patterns with class label j, respectively. Although Fisher proposed a supervised approach to extract a relatively distinguishable feature; an unsupervised approach for discretization has been proposed here by maximizing Fisher criterion. In this method, rang of each continuous feature is divided into predefined q intervals by q+1 splitter values, -∞
= sp1 < sp2 < … < spq+1 = +∞, where, ith interval is defined by (spi, spi+1]. Assume that values in the same interval are labeled uniquely whereas; values in different intervals are assigned different labels. By this assumption, a sequence of splitters with the maximum Fisher criterion (15) is desired.
Finding a global optimum sequence can be gained, but a greedy method is used to find a local solution to speed up the discretization process. Experiments show that it results in a good performance.
For this purpose, in q-1 iterations, splitters sp2, …,spq are specified, one by one. In ith iteration, sp
i+1 is specified so as to maximize (15) whereas, all spj (j<i) are determined and others are not yet considered. There is also a condition:
If values of all patterns in the specified feature are gathered and sorted without any duplication, each splitter should be defined as the mean of two consequent values.
In addition to reducing the probability of overfitting, this condition prevents occurrence of empty intervals.
B. Initialization
Initialization of cluster centers (modes) is the only random event in ACA. But uncertainty concept in FACA and taking membership degree of each feature in each cluster into consideration leads to more stability in the final clustering result. Nevertheless, a simple initialization procedure is proposed here which seems to improve the final results as explained in the next section.
A method which is inspired by an initialization method proposed in [12] and [13], is utilized. All patterns are considered as just one cluster and the feature with the highest multiple interdependence redundancy measure is chosen as the first initial cluster center (η1). Other centers are selected from features by (16).
(
A
A
)
r
k
R
r j r
i A S
j i S
A
r
≤
≤
⎥
⎥
⎦
⎤
⎢
⎢
⎣
⎡
=
∑
−
− ∈
∉
min
:
2
arg
1 1
η
(16)Where, ηr is the center of rth cluster, Ai is the ith feature and
k is the desired number of clusters. Sr represents the set {η1,
η2, …, ηr}. Indeed, after selecting the first cluster center, others are selected from unselected features one by one. In any step, the feature, which is the least interdependent feature with selected cluster centers by now, is selected as a new cluster center. It improves the final objective function as explained in the next section.
VI. EXPERIMENTAL RESULTS
In this paper, Leukemia dataset [10] is used as a well known biological dataset. It is a gene expression micro-array dataset with 73 samples and 7129 genes (features). Due to memory constraints and dynamic implementations, only the first 1000 features are considered.
A. Stability
As mentioned in last section, FACA seems to be more stable than ACA. Curve of objective function (13) (achieved in the final stage of clustering) vs. number of clusters, is depicted in Figs. (1-a) and (1-b), for crisp and fuzzy approaches, respectively. In these figures, with a fixed number of clusters and specifying the initial cluster modes randomly, 20 separate clustering runs have been plotted. Best, worst and average values over these runs are depicted in separate curves. Less difference between best and worst values for fuzzy approach, in comparison with crisp version, may show less dependency of the clustering to initial values and consequently more stability is gained. Also considering the same curve, with the proposed initialization technique indicates completely better results than the average values for both crisp and fuzzy approaches, as shown in Fig. (1).
Although, objective function should be maximized but, higher objective value in crisp version is never an evidence of better performance in comparison with fuzzy version. Indeed, the objective function in the crisp version is summation of interdependence measure values between high correlated features; whereas, in fuzzy version, high interdependencies are reduced by membership degree which is less than one, and this reduction is tried to be counted with low interdependence measure value and low membership degrees of other feature pairs.
With a predefined number of clusters, objective function is expected to change after each iteration in fuzzy k-modes. As shown in Fig. (2), objective function oscillates in crisp version whereas, fuzzy objective function converges smoothly. This smoothness speeds up and guarantees convergence.
B. Classification accuracy
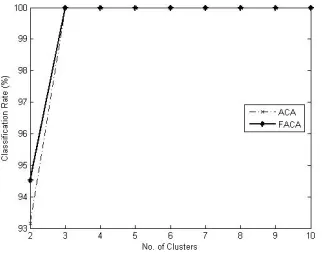
As another experiment, C4.5 decision tree has been used to classify Leukemia dataset based on selected features. The resulted classification rate can be encountered as a measure of assessing the feature selection method. Hence, ACA and Fuzzy ACA are compared by the resulted classification rate on different number of clusters, as depicted in Figs (3-5) for 2, 3 and 4 features per cluster, respectively. Wai-Ho Au et al. [9] proposed selection of a predefined number of features from each cluster. But in fuzzy approach, any feature is belonged to all clusters. Therefore, each feature is first belonged to the cluster with maximum membership degree before any feature selection based on their ranks. Leaved-One-Out method has been used here to assess the generalization of classification system. Increasing the number of features per cluster, improves the classification accuracy for both crisp and fuzzy approaches.
VII. CONCLUSION
In this paper, a fuzzy approach is suggested to group features into clusters in order to select best ones for classification stage. It proposes a new clustering method which combines k-modes clustering used in ACA with fuzzy k-means clustering algorithm. Hence, it leads to more stability, faster convergence and greater classification rate, in comparison with the previous method.
Both ACA and FACA are based on the interdependence redundancy measure which is applicable only on discrete data types. Hence, a new method for discretization of continuous data has also been proposed. Moreover, the initialization of cluster centers is not random, but a new method has been applied for initialization in order to increase the probability of better clusters formation.
Further work will extend the suggested discretization method and improve the similarity measure. Discovering the influential genes on diseases regarding the selected genes is also worth working on.
ACKNOWLEDGMENT
The authors gratefully acknowledge the corporation of F. Alimardani and E. Ansari in this work.
REFERENCES
[1] K. Fukunaga, 'Introduction to Statistical Pattern Recognition', New York: Academic, 1972.
] 2
[ I. T. Joliffe, 'Principal Component Analysis', New York: Springer-Verlag, 1986.
[3] Quinlan, J. R. 'C4.5: Programs for Machine Learning', Morgan Kaufmann Publishers, 1993.
[4] Jim C. Bezdek. 'Fuzzy Mathematics in Pattern Classification', PhD thesis, Applied Math. Center, Cornell University, Ithaca, 1973. [5] Isabelle Guyon and Andr´e Elisseeff, 'An introduction to variable and
feature selection', Journal of Machine Learning Research, vol. 3, pp. 1157–1182, 2003.
] 6
[ F. Z. Bril, D. E. Brown, and N. W. Worthy, 'Fast genetic selection of features for neural network classifiers', IEEE Trans. Neural Networks, vol. 3, pp. 324–328, Mar. 1992.
[7] S.C. Madeira and A.L. Oliveira, 'Biclustering Algorithms for Biological Data Analysis: A Survey', IEEE/ACM Trans. Computational Biology and Bioinformatics, vol. 1, no. 1, pp. 24-45, Jan.-Mar. 2004.
[8] M Xiong, W Li, J Zhao, L Jin, and E Boerwinkle, 'Feature (gene) selection in gene expression-based tumor classification', Mol Genet Metab, vol. 73, no. 3, pp. 239–47, 2001.
[9] Wai-Ho Au, Keith C. C. Chan, Andrew K. C. Wong, Yang Wang, 'Attribute Clustering for Grouping, Selection, and Classification of Gene Expression Data', IEEE/ACM Transactions on Computational Biology and Bioinformatics (TCBB). Vol 2, no.2, pp: 83-101, (2005). [10] Golub TR, Slonim DK, Tamayo P, Huard C, Gaasenbeek M, Mesirov
JP, Coller H, Loh ML, Downing JR, Caligiuri MA, Bloomfield CD, Lander ES., 'Molecular classification of cancer: class discovery and class prediction by gene expression monitoring', 286(5439):531-7, 1999.
[11] T. Kanungo, D. Mount, N. Netanyahu, C. Piatko, R. Silverman, and A. Wu., 'A local search approximation algorithm for k-means clustering', Comput. Geom., vol 28, pp:89-112, 2004.
[12] Mic´o, M.L., Oncina, J., Vidal, E., 'A new version of the nearest-neighbour approximating and eliminating search algorithm (AESA) with linear preprocessing time and memory requirements', Pattern Recognition, Vol. 15, pp. 9–17, 1994.
[13] M. Taheri, R. Boostani, 'Novel auxiliary techniques in clustering', International Conf. on computer science and engineering, 2007. [14] E. C. C. Tsang, D. S. Yeung, and X. Z. Wang, 'OFFSS: Optimal
Fuzzy-Valued Feature Subset Selection', IEEE Trans. on Fuzzy Systems, vol. 11, no. 2, 2003.
[15] M. L. Raymer, W. F. Punch, E. D. Goodman, L. A. Kuhn, and L. C. Jain., 'Dimensionality reduction using genetic algorithms', IEEE Trans. on Evolutionary Computation, vol. 4, no. 2, pp:164 -171, 2000. [16] R. Setiono and H. Liu, 'Neural-network feature selector', IEEE Trans.
Neural Networks, vol. 8, pp. 654–662, May 1997.
[17] M.R. Rezaee, B. Goedhart, B.P.F. Lelieveldt, J.H.C. Reiber, 'Fuzzy feature selection'. PR(32), No. 12, pp:2011-2019, December 1999. [18] R. Caruana and D. Fratage, 'Greedy attribute selection', in Machine
Learning: Proc. 11th Int. Conf., San Francisco, CA, pp:283–288, 1994. [19] R. Battiti, 'Using mutual information for selecting features in
supervised neural net learning', IEEE Trans. Neural Networks, vol. 5, pp:537–550, July 1994.
[20] N.Kwak and C.-H. Choi, 'Input feature selection for classification problems', IEEE Trans. Neural Networks, vol. 13, pp:143–159, Jan. 2002.
[21] Y. Cheng and G.M. Church, 'Biclustering of Expression Data', Proc. Eighth Int’l Conf. Intelligent Systems for Molecular Biology, pp: 93-103, 2000.
(a)
Fig. (3). Classification rate resulted by C4.5 on Leukemia dataset for 2 features per cluster.
Fig. (5). Classification rate resulted by C4.5 on Leukemia dataset for 4 features per cluster.
Fig. (4). Classification rate resulted by C4.5 on Leukemia dataset for 3 features per cluster.
(b)
Fig. (2). Objective function vs. iterations, for 4, 5, 6 and 7 clusters. (a) Crisp (b) Fuzzy
Fig. (1). Objective function vs. the number of clusters. Best, worst, average curves in 20 runs for random initialization and associated curve with proposed initialization technique.(a) Crisp
(a)
[image:6.612.86.232.53.314.2] [image:6.612.321.480.53.180.2] [image:6.612.322.480.214.344.2] [image:6.612.80.220.369.627.2] [image:6.612.321.482.379.506.2]