Abstract—In this paper, we introduce, a new algorithm, QcleanNoise, for detecting noisy instances. The effects of the algorithm in three supervised classifiers: LDA, KNN and RPART, a decision tree classifier, are discussed. Comparison with other procedures is carry out on four well known Machine Learning datasets. The experimental results shows that our algorithm performs better than current procedures detecting efficiently noisy instances using less computational time.
Index Terms—Noise removal, data preprocessing, supervised classification, instance selection.
I. INTRODUCTION
The ideal situation for extracting knowledge from a dataset is when it does has neither outliers nor noise. However, real-world databases are usually dirty and a cleaning process is required before performing a data mining task. The noise in a dataset may deteriorate the performance of a classifier applied on it, since the misclassification error as well as the
computing time may increase and the classifier and decision rules obtained could be more complex.
In a supervised classification context, the quality of a dataset is characterized by two information sources: the predictor attributes and the categorical attribute which defines the classes. The quality of the predictors is determined by their quality to represent the instances to be classified, and the quality of the class attribute is determined by the correct assignment of each instance.
The quality of a dataset is determined by internal and external factors. The internal factor reveals if the predictors and the classes has been correctly selected and are well defined. The external factor measures errors introduced in the predictors or in the class assignment, either systematically or artificially. In particular, an instance contains noise when it causes problems due to external reasons.
According to Zhu et al., (2003), the minimum misclassification error depends on the quality of the information contained on the training set and on the bias of the
Manuscript received June 28, 2007. This work was supported in part by the Office of Naval Research under Grant BS123456.
Luis Daza is with the Department of Mathematical Sciences, University of Puerto Rico at Mayaguez, Mayaguez, PR 00680, USA (e-mail: luis_dp@ math.uprm.edu).
Edgar Acuña is with the Department of Mathematical Sciences, University of Puerto Rico at Mayaguez, Mayaguez, PR 00680, USA (corresponding author, e-mail: edgar@ math.uprm.edu).
induction algorithm used to carry out the classification. This means that improving the data quality of the training set will reduce the misclassification error. The classifier will perform better using a clean training set.
Two type of noise can be distinguished (Zhu et al., 2003, 2006):
a) Noise in the attributes: It is given by the errors occurred during the entrance of the values of the attributes. Among the sources of this type of noise are: variables with missing values, and redundant data.
b) Noise in the classes: It is given by the errors introduced during the assignment of the instances to the classes. The presence of this kind of noise may be due to subjectivity, errors in the data entry process, and incorrect information for assigning a instance to a class. There are two possible sources of class noise: i) Inconsistent instances. These are instances with the same attribute values but belonging to two or more different classes of the dataset, and ii) Error in the classification. Instances assigned incorrectly to a class. This type of error usually happens when there are classes with similar values for the attributes.
The presence of noise in the classes affects significantly the performance of a classifier, since it modifies the class boundaries and it becomes more difficult to determine them. The instances representing noise cause that a classifier assigns incorrect classes to instances that are correctly labeled. Thus, noisy instance have a direct effect on the accuracy of the classifier.
In this paper, we propose a new strategy for searching and identification of noisy instances in a training dataset. A comparative study of the effect of noise removal on the misclassification error is carry out. The proposed technique identifies efficiently the noisy instances. Which then are removed from the training data. The remaining instances are used to construct the classifier and the misclassification error is estimated using cross-validation This noise removal process is applied to four datasets using three classifiers: Linear Discriminant Analysis (LDA) , a decision tree classifier based on recursive partitioning (RPART) and the k-nn classifier (KNN ). All three classifiers are available in the Rsystem for statistical computation and graphics (http://cran.r-project.org).
II. PREVIOUSWORK
The problem of classification under the presence of noise has called the attention of researchers in the Machine Learning
Luis Daza and Edgar Acuna
field and some algorithms of inductive learning have already mechanisms to handled noise. Quinlan (1986) pointed out that when there are high levels of noise in the classes, then to clean out the training set previous to the construction of the classifier improves its predictive power. For instance, the purpose of the pruning process in a decision tree is to reduce the overfitting effect, which is due to the presence of noise on the training set. Other alternative is to use combination of classifiers such as, Bagging (Breiman, 1996) and Boosting (Freund and Schapire, 1996). Unfortunately, pruning and combination of classifiers solve partially the problems caused by the noise. Still the noise can affect dramatically the misclassification error, specially when there is a high level of noise. Gamberger et al. (1999, 2000), suggest that the noise must be eliminated before the construction of the classifier and, in this way the noisy instances will not have influence on the classifier.
There are several procedures to identify noisy instances. Guyon et al. (1996) use the criterion of the maximum information gain, Gamberger, et al., (1999), use a method called saturation filter.
In other methods, the instances considered potentially as noise are detected and removed using C4.5 (John 1995, Zhu et al., 2003), or neural networks (Zeng and Martinez, 2003). Some authors (John, 1995, Brodley and Friedl 1996, 1999), use a procedure similar to remove outliers in regression. That is, they use the same model to detect outliers and to determine the final model once that the outliers are removed. John (1995), presents a robust classifier based on decision trees, which eliminates outliers executing repetitively the C4.5 classifier. Brodley and Friedl (1996, 1999), develop a similar strategy but use cross-validation to reduce the number of iterations. They propose a model for filtering instances. The initial training set that contains noise is filtered using several strategies in order to obtain a new clean set, which is used to construct the classifiers. Several classification algorithms are used to construct the filter, and one instance in the test set is considered as noise if it is incorrectly classified for at least one classifier.
There are several variants of the method depending on the criterion used to consider an instance as noise as well on the number of classifiers used as filter. In Brodley and Friedl (1999), different configurations are evaluated empirically using one single classifier as a filter or several classifiers using either majority voting or consensus voting. The later type of voting means that an instance is considered as noise if it is incorrectly classified for all the classifiers used as filter. In voting for majority an instance is considered as noise if it is classified incorrectly for more of the half of the classifiers. In case that only one classifier is used as filter, every instance incorrectly classified is considered as noise and it must be removed.
Zhu et al., (2003, 2006), focused in the problem of cleaning large and distributed databases. In their procedure, they carried out first a partition of the whole training set, E, in disjoint subsets, each of them sufficiently small to be processed
generated. These classifiers are later used to evaluate the whole dataset. A given instance, is counted an error if it has been identified as noise for all the subsets. An instance with large value in the counting error it will have a high probability to be considered as noise. In order to identify and delete noisy instances, the authors use two strategies: majority and non-objection. Other proposals for detecting noise are given by Lawrence and Schölkopf (2001), and Li (2004). As we can see most of the work has been done on noise detection in supervised classification problems, but there is not much work on noise for unsupervised classification ( see Xiong et al., 2006).
In the following section, we present a new algorithm to detect class noise based on the quality of instances.
III. THEPROPOSEDALGORITHM
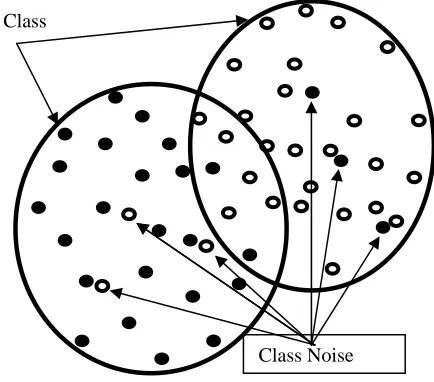
According to the definition of class noise (Zhu et. al., 2003), the noisy instances will be those that are badly located in the cloud of points that define each of the classes (see figure 1). We introduce a measure to evaluate the quality of an instance. Thus, for the i-th instance, we compute Qi=(ri-di)/max(di,ri) , where di is the distance of the i-th
istance to the centroid of its class and ri is the minimum
[image:2.612.338.555.448.639.2]distance of the i-th instance to the centoid of the classes where does not belong to. A noisy instances will have negative values for the quality measure Q. However, some instances located near to the boundary of two or more classes may also have small negative values for the quality measure.
Figure 1. Graphical representation of class noise
The proposed algorithm identifies the noisy instances and distinguishes them from the instances that are in class boundary. The goal of the algorithm is to identify and
Class
and the classes boundaries such that the neither separability of the classes nor the discriminant power of the classification algorithm is altered.
The Fig. 2, shows our QcleanNOISE algorithm. First, the quality measure Q is computed for each instance of the training set. Then , each instance with Q<0 is regarded as a candidate to be a noisy instance. The next step is to find out the k nearest neighbors to each noisy instance candidate. Finally, we count the number of neighbors that belong to the same class. If the majority of the neighbors does not belong to the same class the candidate instance is then regarded as noisy and discarded from the training set.
The computational complexity of the proposed algorithm is, in the worst case,
( )
2N
O . Observing the computational work carried out by the algorithm, we can see that the computation of the quality measure and the selection of the noisy instances candidates have linear complexity O
( )
N . The search for the nearest neighbors determines the quadratic complexity part of the algorithm. However, the search is done only among the instances candidate to be noise rather than in the whole training set. On the other hand, in the implementation of the algorithm, we have use the Approximate Nearest Neighbor (ANN) library (Mount and Arya, 1997), where the search for the nearest neighbors is done in O(
Nlog(N))
.QcleanNOISE(Training Dataset E) {
For( each instance Ii in E)
Find out its quality measure Q(Ii)
endFor
CandNoise = Φ
For( each instance Ii in E)
if ( Q(Ii) < 0 )
CandNoise = CandNoise U { Ii }
endFor
For( each instance Ii in CandNOISE)
Find out its k nearest neighbors NN in E Count(I) =0
For( each NN of Ii )
if (Class(NN) ==Class(Ii) ) Count = Count +1
endFor
For( each instance Ii in CandNOISE)
if (Count(I) < (k+1)/2 ) E = E - { I } endFor
Return E
}
Figure 2. Algorithm QcleanNOISE
IV. EXPERIMENTALRESULTS A. Methodology
In this section, we present experimental results on the performance of the proposed algorithm as well as comparisons with the Brodley and Friedl’s proposals. The accuracy of three classifiers, LDA, KNN y RPART is measured after noise removal. Four well-know datasets: Iris, Breastw, Segment and Landsat are used in the experiments.
Noise is introduced in the datasets in the same way as it is done by several authors (Brodley and Friedl, 1999; Zhu et al., 2003; Gamberger et al., 1999, 2000). In this procedure, given a pair of classes (X, Y) and a noise level w, an instance labeled with the class X will have a w% of probability to be changed to the class Y, and vice versa. According to, Zhu et al., (2003), this procedure is justified due that in real situations only some classes tend to produce noise. It is clear that adding noise in this way, the percentage of noise with respect to the whole training set will be than w%. In our experiments, we introduce noise only into the two classes with the largest amount of instances in the training set.
In each experiment, we use 10-fold cross-validation to estimate the misclassification error. Thus, a 10% of the data is considered as a test set and the remaining 90% is regarded as the training set. In this last set, we introduce noise as is explained above and the performance of the classifier is evaluate in the test set. In order to evaluate the effectiveness of the noise detection method, we use the same measures proposed by Brodley and Friedl, 1999, and Zhu et al., 2003; These measures are the following:
1
E R = D∩ R% R% , E R2 = D% ∩ R R and the noise elimination precision, NEP, NEP= D∩R D. where, D =
set of instances that are detected as noise and are eliminated, and R = set of noisy instances.
D
%
andR
%
represent their respective complement. ER1, occurs when anon-noisy instance is considered as noise, ER2, occurs when
a noisy instance is considered as an instance correctly labeled. The NEP measures the proportion of noisy instances that are detected as noise.
B. Results
The table I shows the values of each of the measures defined above, for our algorithm, QcleanNOISE, and for the three alternatives proposed by Brodley and Friedl (1999), on the Iris dataset. The results are based on fifteen repetition of the experiment. The proposed algorithm QcleanNOISE detects a less number of good instances as noisy (ER1), than the
Brodley’s method that uses voting by consensus. At low level of noise, less than 10%, the elimination strategies using Majority and Consensus voting, show low levels of noise detection for good instances (ER2). But, at high level
of noise, greater than 20%, the levels of the ER2 error
increases quickly. The problem in having large values of ER1 and ER2, is that the noise detection method is
Table I. Measures of noise removal on the Iris dataset
QcleanNOISE Single Majority Consensus
Noise
ER1 ER2 NEP ER1 ER2 NEP ER1 ER2 NEP ER1 ER2 NEP 5% 0.1 0.0 97.5 4.4 6.7 55.3 0.5 0.0 94.6 0.1 1.3 97.5 10% 0.2 2.2 97.9 10.1 12.7 50.0 0.5 0.0 96.7 0.2 5.3 98.1 20% 0.3 5.7 98.5 19.5 20.3 50.3 3.4 2.0 87.9 0.2 25.0 98.9 30% 0.4 16.5 98.6 27.7 32.2 50.4 11.7 10.4 75.9 1.5 41.6 94.5 40% 0.4 27.9 98.6 38.2 39.5 50.6 23.4 21.0 68.7 7.9 55.7 78.4 45% 0.6 41.1 98.3 42.7 46.1 50.0 37.8 35.6 57.3 10.9 66.7 70.2 instances since consider them as noise and/or retaining many
noisy instances since it is considered them as good instances. This problem causes that the classification algorithms constructed using training sets clean out and having large values of ER1 and/or ER2, tend to loss precision
giving high misclassification errors. This can be seen in table II. Our algorithm, QcleanNoise, presents low levels of ER1 and moderate levels of ER2, that lead to a better
precision for the three classifiers studied (see Figs. 3 and 4 ). Regarding the precision for noise detection in the Iris dataset, we can see that our algorithm presents a better precision for all noise levels considered.
Table II. Misclassification error rates for the LDA classifier at different levels of noise removal using four
detection methods on the Iris dataset.
Brodley
Noise None Single Majorit
y Consensus QcleanNOISE
5% 4.7 2.0 2.6 2.1 2.0
10% 7.0 2.2 2.5 2.3 2.1
20% 10.7 3.7 3.0 4.3 2.1
30% 13.2 8.6 5.3 9.1 2.2
40% 15.5 14.2 11.2 13.5 2.6
45% 22.7 20.4 16.9 19.6 2.3
For the Breastw dataset, we can see a similar behavior as the Iris dataset, in both the measures for noise detection as well as in the misclassification error rate (see Fig. 6). As in Iris, for QcleanNoise, the levels of ER1 are quite low, less than 2%, keeping moderate levels of ER2. Also, the precision of noise detection has large values compared with the other alternatives. With respect to the misclassification error rates, we can see that they remain steady when the noise levels increases, whereas the misclassification error rates using the Brodley’s methods raise drastically. Fig 5 shows the behavior of the misclassification error rate for the RPART classifier on the Breastw dataset at several noise levels.
0 5 10 15 20 25 30
5% 10% 20% 30% 40% 45%
Noise
M
iscl
ass
if
icat
io
n
erro
r rat
e
[image:4.612.59.279.416.558.2]None Single Majority Consensus QcleanNOISE
Figure 3. Misclassification error rates for the KNN classifier at different levels of noise removal using four
detection methods on the Iris dataset
0 5 10 15 20 25 30
5% 10% 20% 30% 40% 45%
Noise
M
isc
lassi
fi
cat
io
n
erro
r rat
e
[image:4.612.336.554.503.677.2]None Single Majority Consensus QcleanNOISE
Figure 4. Misclassification error rates for the RPART classifier at different levels of noise removal using four
The third dataset, Segment, has 7 classes, each of them with 330 instances. Under the scheme used to introduce noise into the classes, a 5% of noise introduced into two classes is approximately 1.5% of noise in the whole dataset, and 13% approximately for a 45%. This will diminish the impact of noise on the misclassification error rate as it is visualized in Figs. 6 and 7. We can see a similar impact of the detection methods on the misclassification error rates up to a 30% of introduced noise. However, the tendency is the same as observed in the Iris and Breastw datasets. Table III shows that QcleanNoise outperforms the other noise detection methods in bot ER1 amd NEP, but Brodley’s
majority voting yields better ER2 values that QcleanNoise.
In the last dataset, Landsat, there are 6 classes and the two classes with the most amount of instances represent a 47.26% of the whole dataset. Therefore, like in Segment, the impact of the noise introduction is reduced, although the trend of the results is the same as in the three datasets already considered. Fig. 8 shows the change on the misclassification error for the KNN classifier when the noise level goes from 5 to 45 percent. More results are omitted due to the constrain on the number of pages.
The computer programs were written in C++ and R language, and are available upon request from the second author.
V. CONCLUSION
Our empirical results show that our algorithm for detecting noise, QcleanNoise, which it is based on a data quality measure, outperforms strategies proposed by Brodley and Friedl. Our algorithm gives better results in the measures for evaluation of noise detection. Also, classifiers give lower misclassification error rates once that the training dataset is cleaned out using QcleanNoise. KNN seems to be the classifier most affected for the presence of noise.
REFERENCES
[1] Breiman, L. Bagging predictors. Machine Learning, 1996, 24, 123-140.
[2] Brodley, C.E. and Friedl, M.A. Identifying and eliminating mislabeled training instances, Proc. of 13th National Conf. on Artificial Intelligence, 1996, pp.799-805.
[3] Brodley, C.E. and Friedl, M.A. Identifying mislabeled training data, Journal of Artificial Intelligence Research, 1999, 11, 131-167. [4] Yoav Freund, Robert E. Schapire: Experiments with a New Boosting
Algorithm. ICML 1996: 1996, 148-156
[5] Gamberger, D., Lavrac, N. and Dzerobski, S. Noise detection and elimination in data preprocessing: Experiments in medical domains. Applied Artificial Intelligence.2000.
[6] Gamberger, D., Lavrac, N. and Groselj, C. Experiments with noise filtering in a medical domain, Proc. of 16th ICML Conference, 1999, pp. 143-151, San Francisco, CA.
[7] Guyon, I., Matic, N. and Vapnik, V. Discovering informative patterns and data cleaning. Advances\ in Knowledge Discovery and Data Mining,1996, 181-203. AAAI/MIT Press.
[8] John, G. H. Robust decision trees: Removing outliers from databases. Proc. of the First International Conference on Knowledge Discovery and Data Mining, 1995, pp.174-179, AAAI Press.
[9] Lawrence, N.D. and Schölkopf, B. Estimating a kernel fisher discriminant in the presence of label noise. Proceedings of the eighteen International Conference on Machine Learning , 2001, pp 306-313.
[10] Li, Y. Classification on the presence of class Noise. M.Sc. Thesis, Delft University of Technology, 2004, pp. 30..
[11] Mount, D.M. and Arya, S. ANN: A library for approximate nearest neighbor searching. CGC 2nd Annual Fall Workshop on
Computational Geometry, 1997, URL: http://www.cs.umd.edu/~mount/ANN
[12] Quinlan, J. R. Induction of decision trees. Machine Learning, 1986, 1, 81-106.
[13] Xiong, H., Pandey, G., Steinbach, M. and Kumar, V. Enhancing data analysis with noise removal. IEEE Transactions on Knowledge and Data Engineering, 2006, 18, 304-319.
[14] Zeng, X. and Martinez, T. (2003). A noise filtering method using neural networks. SCIMA 2003. IEEE International Workshop on Soft Computing Techniques in Instrumentation, Measurement and Related Applications, 17 May 2003, pp. 26–31.
[15] Zhu, X., Wu, X. and Chen, Q. Eliminating Class Noise in Large Datasets. Proceedings of the 20th ICML International Conference on Machine Learning (ICML 2003). Washington D.C., 2003, pp. 920-927.
[16] Zhu, X., Wu, X. and Chen, Q. Bridging Local and Global Data Cleansing: Identifying Class Noise in Large, Distributed Data Datasets. Data Mining and Knowledge Discovery, 2006, 12, 275-308.
Table III. Measures of noise renoval on the Segment dataset
QcleanNOISE Single Majority Consensus
Noise
ER1 ER2 NEP ER1 ER2 NEP ER1 ER2 NEP ER1 ER2 NEP
5% 0.2 0.1 95.2 5.0 2.8 48.5 0.4 0.0 94.4 0.1 5.7 96.7
10% 0.2 0.8 96.3 9.6 8.7 49.3 0.4 0.1 94.8 0.1 8.2 97.7
0 5 10 15 20 25 30 35
5% 10% 20% 30% 40% 45%
Noise
M
iscl
assi
fi
cat
io
n
erro
r rat
e
[image:6.612.326.559.85.283.2]None Single Majority Consensus QcleanNOISE
Figure 5. Misclassification error rates for the RPART classifier at different levels of noise removal using four
detection methods on the Breastw dataset
7 8 9 10 11 12 13 14
5% 10% 20% 30% 40% 45%
Noise
M
isclassif
icat
io
n
er
ro
r r
a
te
[image:6.612.66.283.97.297.2]None Single Majority Consensus QcleanNOISE
Figure 7. Misclassification error rates for the RPART classifier at different levels of noise removal using four
detection methods on the Segment dataset
3 5 7 9 11 13 15
5% 10% 20% 30% 40% 45%
Noise
M
iscl
a
ssi
fi
cat
io
n
er
ro
r r
at
e
None Single Majority
[image:6.612.333.568.385.596.2]Consensus QcleanNOISE
Figure 6. Misclassification error rates for the KNN classifier at different levels of noise removal using four
detection methods on the Segment data
8 13 18 23 28 33
5% 10% 20% 30% 40% 45%
Noise
Mis
c
lassif
ication er
ro
r
ra
te
None Single Majority Consensus QcleanNOISE
Figure 8. Misclassification error rates for the KNN classifier at different levels of noise removal using four
[image:6.612.60.288.402.615.2]