Original Article
The correlations of speech-evoked auditory brainstem
responses and cognitive function in patients with
obstructive sleep apnea hypopnea syndrome
Zhonghai Xin1,2, Jinsheng Dai1, Jinfeng Liu1, Xiaohui Wen1, Jingyan Du1, Yanjun Wang1, Ningyu Wang1
1Department of Otolaryngology Head & Neck Surgery, Beijing Chaoyang Hospital, Capital Medical University,
Beijing 100020, China; 2Department of Otolaryngology, Wangjing Hospital, China Academy of Chinese Medical
Sciences, Beijing 100102, China
Received June 22, 2017; Accepted January 4, 2018; Epub April 15, 2018; Published April 30, 2018
Abstract: Objective: Patients with obstructive sleep apnea hypopnea syndrome (OSAHS) are at high risk of cognitive impairment, which has been investigated mainly by event-related potentials (ERPs) P300 and cognitive scale in pre-vious study. Recently, it was reported that abnormal speech-evoked auditory brainstem responses (speech-ABRs) might reflect the disorders at the level of cortex as well as reveal auditory processing disorders at the brainstem level. The aim of this study was to investigate the relationship between speech-ABRs test results and cognitive im-pairment in patients with OSAHS. Methods: 60 patients with OSAHS (patient group) and 25 age matched healthy subjects (control group) were enrolled in this study. The patients were then divided into three groups (mild group, n=19, moderate group, n=20 and severe group, n=21) according to the severity of the syndrome (minimum oxy-gen saturation and Apnea Hypopnea Index). Speech-ABRs and auditory P300 were recorded by professional audi-ologist in shielded room. Cognitive function was evaluated by Montreal Cognitive Assessment (MoCA). SPSS17.0 software was used for statistical analysis. Results: Delayed latency and decreased amplitude of response onset peaks in speech-ABRs were detected in patients compared with control group (both P < 0.05). The V-A slope was decreased with increased disease severity. Prolonged P300 latency and reduced amplitude occurred concomitant to an increase of disease severity as well. However, there were no differences for the interpeak latency either by speech-ABRs or P300. Total MoCA scores decreased progressively, with significant differences between the control group and the mild, moderate and severe groups (all P < 0.05). Correlation and bivariate linear regression analysis revealed that the absolute value of amplitudes of waves V and A were negatively correlated with the latency of P300, and positively correlated with Montreal Cognitive Assessment scores. It implies that abnormal changes in ampli-tudes of waves V and A may reflect the degree of cognitive impairment indirectly in patients with OSAHS. Conclusion: These results suggest that there are deficits in the auditory brainstem pathway encoding speech sounds in patients with OSAHS, and that such deficits might affect and reflect the cognitive function in patients with OSAHS.
Keywords: Obstructive sleep apnea hypopnea syndrome, speech evoked auditory brainstem response, cognitive function, montreal cognitive assessment, event-related potentials
Introduction
Obstructive sleep apnea hypopnea syndrome (OSAHS) is a condition characterized by repeat-ed episodes of sleep apnea (cessation of bre- athing for 10 s or longer) or hypopnea (signifi -cant reduction in breathing), associated with intermittent hypoxemia and frequent arousal, which are significant nocturnal consequences of the disorder [1, 2]. Many studies have report-ed a wide range of neurocognitive impairments in OSAHS patients, including selective and
-ing primarily test memory and language acqui-sition abilities[9]. Other familiar tests use aspects of the Wechsler test; these are mostly used to measure attention/memory function in individuals with cognitive impairment [10].The Montreal Cognitive Assessment (MoCA) is a convenient, stand-alone cognitive assessment instrument that covers various important domains of neurocognitive functions and can be quickly administered to patients [11].In the present study, we used this scale as a tool to screen cognitive function in OSAHS patients. It is well-known that event-related potentials can be used to achieve greater precision and sensitivity during cognitive evaluation. In the early 1960s, Sutton identified event-related potentials (ERPs) and showed their relationship to cognitive processes [12]. Since the 1980s, some scholars [13] have studied cognitive function in patients with OSAHS using ERPs. The main ERP component associated with attention and information processing during the Oddball paradigm task is the P300 [14]. Some studies have reported that patients with OSAHS exhibit sustained and delayed P300 latencies and a reduction in amplitude [3, 15-17], which indicated that ERP responses could be used to identify cognitive dysfunction as an objective marker.
Speech represents the sound combination of certain significance, certain tones and certain loudness features. In conversational speech, there are some delicate markers that imply a listener to begin and end the meaningful seg-ments. How complex sound stimuli get trans-formed into meaningful unit signals in the ner-vous system is very important for their cogni-tive function. The auditory brainstem response (ABR) to speech sound stimuli simulates the acoustic characteristics of the speech signal with high similarity in temporal changes and spectral distributions. After decades of res- earch, the use of speech-evoked auditory brain-stem response has been widely applied [18]. Auditory processing disorders are character-ized by a reduced ability to perceive informa-tion contained in auditory stimuli despite intact auditory pathways. Abnormal speech-evoked ABRs may reflect the disorders at the brain -stem level, but may imply cortical-level disor-ders simultaneously, which are intimately
linked [18, 19]. Some researchers have investi-gated the neural processing of simple acoustic signals, such as a click, at the brainstem level in individuals with OSAHS [20]. But no studies have examined the brainstem response to com-plex auditory signals like speech in OSAHS patients. Several studies have revealed that analysis of speech-ABR is an objective and non-invasive electrophysiological test that is useful for examining auditory brainstem function dur-ing the processdur-ing of complex stimuli like speech in a broad range of developmental and educational disorders [21-23]. These studies showed that poor cortical sensitivity to acoustic change was related to asynchronous onset tim-ing in the auditory brainstem in children with learning disabilities. Therefore, in the present study, we focused specifically on patients with OSAHS and investigated their auditory brainst- em responses to /da/ synthetic syllable stimuli. We expected that the speech-ABR would show evidence of hypoxemia-related differences in amplitude and latency because of a reduced ability to accurately encode rapidly temporal changes in speech.
Materials and methods
Patient group
Sixty male subjects between the ages of 18 and 40 were recruited from Chaoyang hospital, Beijing, China. Since the decline of SaO2 is the main cause for damage of speech and cogni-tive function, sixty participants were divided into three subgroups based on their SaO2: the mild group (n=19; 85% ≤ minimum SaO2 ≤ 90%), the moderate group (n=20; 80% ≤ mini -mum SaO2 < 85%), and the severe group (n=21; minimum SaO2 < 80%) [24].
Inclusion criteria: Subjects are male, diagnosed with OSAHS on the basis of complaints, physi-cal examination, and polysomnography moni-toring; without previous treatment of OSAHS; Educational attainment is at least high school (primary school (6 years), middle school (3 years), high school (3 years) in China); normal hearing and no treatment experience, no visual disorders.
sleep or daytime sleepiness, a history of brain traumatic injury or unstable high blood pres-sure and other diseases (e.g., asthma, hypothy-roidism, periodic leg-movement) causing day-time hypoxemia (SaO2 < 90%).
Control group
Twenty-five healthy and age matched male con -trols (normal: AHI < 5, SaO2 > 90%) were recruit-ed. All controls exhibited good sleeping habits, normal hearing, no visual disorders, no psychi-atric or nervous system diseases, and no recent use of drugs known to affect sleep or daytime sleepiness.
Each participant was written informed of the purpose of the experiment, and were coopera-tive. The protocol complied with the Declaration of Helsinki and was approved by the Ethics Committee/IRBs with No.12-83.
Polysomnography (PSG)
All subjects underwent overnight PSG using standard techniques and scoring criteria for sleep stages (EEG and submentalis EMG), leg movements (anterior tibialis EMG), and arous-als from sleep. Arterial oxyhemoglobin satura-tion was measured by pulse oximetry and air-flow was measured by nasal pressure cannula. Respiratory effort was assessed using thora-coabdominal movements (respiratory induc-tance plethysmography). All PSG studies were scored by licensed and registered PSG tech-nologists, and reviewed by experienced sleep medicine specialists.
P300 test
To assess the auditory P300, we used the Biologic Navigator Pro System (VER 7.0.0, Bio-logic Systems Corporation, Natus Medical Inc., Mundelein, IL). Testing was carried out between 8:00 a.m. and 10:00 a.m., in a sound proof chamber. The sound was presented through a headset. Electroencephalographic recordings were obtained from silver-plate electrodes at Fz midline scalp sites. Reference electrodes were attached to the right earlobe and ground elec-trodes were attached to the left earlobe, according to international 10-20 system. Equal to or lower than 2 kΩ was allowed for imped -ance. EEG data were recorded with a 0.1- to 100 Hz band-pass filter at a sampling rate of
1000 Hz. The test technique was the target stimulus model. The target stimulus was the tone burst at a frequency of 2 kHz, randomly presented 30 times, with a probability of pre-sentation in 20% of the stimuli; the frequent stimulus consisted of a tone burst at a frequen-cy of 1 kHz, with 80% probability of presenta-tion. The rate of stimulus presentation was 1.10 per second and the stimuli were present-ed binaurally with intensity of 70 dB SPL. The response triggered by the perception of the stimuli was a motor response, requiring indi-viduals to identify and silently count the num-ber of occurrences of target stimuli when they perceived rare stimuli. If the difference between the number of silent counts and actual target stimuli was > 10%, the test was deemed inval-id. The data was processed as followed: First, the gross artifacts were rejected by visual inspection, and then eye blinking artifacts were removed using standard blink-correction algo-rithms [25]. After artifact rejection, the data were band-pass filtered at 0.1- to 30 Hz. Each subject was tested twice, and mean values for latencies and amplitudes were calculated.
Speech-ABR test
wave. The VA onset complex was further ana-lyzed by computing slope, which is a measure of neural synchrony for onset responders.
MoCA scale
The MoCA scale is typically used to screen mild cognitive impairment quickly and conveniently, in patients exhibiting normal Mini-Mental State Examination scores [11]. Scores < 26 are con-sidered to indicate mild neurocognitive impair-ment. Each correct answer is equal to one point, while an incorrect answer or no answer is equal to zero points. At the end of the test, we calculated scores for each subdomain, and for the total scale. To certify the reliability and accuracy of the MoCA, subjects underwent the test between 9:00 a.m. and 9:30 a.m., and the test was conducted by the same physician trained in psychology.
Statistical analysis
Data analysis was performed using SPSS 17.0 software (SPSS, Chicago, IL, USA). All data are presented as means ± SD. A normal distribu-tion of the data was assessed using the Kolmogorove-Smirnov test. One-way analysis of variance followed by the least significant differ -ence (LSD) test was used to compare P300 latency and amplitude and Speech-ABR results separately, as well as MoCA scores among the groups of subjects. Pearson correlation coeffi -cients (r) and linear regression were used to evaluate the correlations among P300, speech-ABR and MoCA scores. Values of P < 0.05 were considered statistically significant. Comparis-ons were performed using rank sum tests fol-lowed by the Kruskal Wallis test, to analyze the scores in each MoCA subdomain. On the basis of the repeated hypothesis test, adjusted
val-Table 1. Demographic information (M ± SD)
Groups Age (year) index (kg/mBody mass 2)
Pathogenesis
(year) Minimum SaO2 (%) AHI Educational Level (year)
Mild (n=19) 32.1±4.5 28.2±3.4a 3.8±0.8 87.3±1.2 9.1±2.6 ≥ 12
Moderate (n=20) 33.5±4.3 29.4±3.5a 4.8±1.3 82.1±2.1 21.9±4.3 ≥ 12
Severe (n=21) 34.8±4.9 30.8±3.7a 5.9±1.7 71.3±6.6 54.4±17.9 ≥ 12
Control (n=25) 31.2±4.9 25.2±2.3 - > 90 < 5 ≥ 12
F value 2.546 12.344 - - -
-P value 0.062 0.000 - - -
-Note: aP < 0.05, vs. control group. (mild vs. Control, P=0.003; moderate vs. Control, P=0.000; severe vs. Control, P=0.000)
[image:4.612.91.523.84.189.2](one-way analysis of variance).
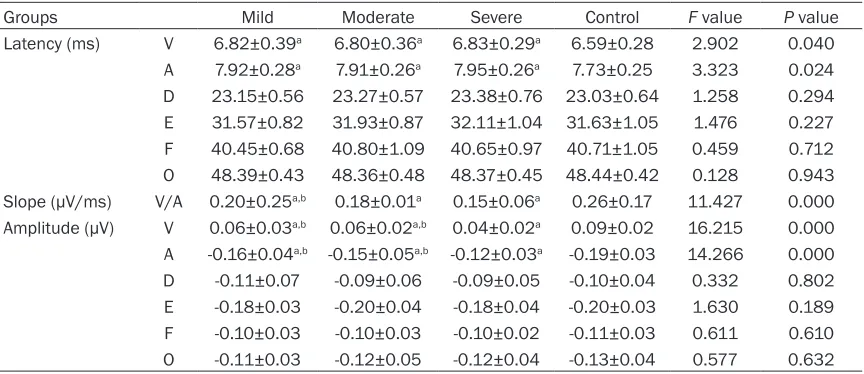
Table 2. Different Speech-ABR waves latencies, amplitudes and V-A slope in patients and control (M ± SD)
Groups Mild Moderate Severe Control F value P value
Latency (ms) V 6.82±0.39a 6.80±0.36a 6.83±0.29a 6.59±0.28 2.902 0.040
A 7.92±0.28a 7.91±0.26a 7.95±0.26a 7.73±0.25 3.323 0.024
D 23.15±0.56 23.27±0.57 23.38±0.76 23.03±0.64 1.258 0.294 E 31.57±0.82 31.93±0.87 32.11±1.04 31.63±1.05 1.476 0.227 F 40.45±0.68 40.80±1.09 40.65±0.97 40.71±1.05 0.459 0.712 O 48.39±0.43 48.36±0.48 48.37±0.45 48.44±0.42 0.128 0.943 Slope (µV/ms) V/A 0.20±0.25a,b 0.18±0.01a 0.15±0.06a 0.26±0.17 11.427 0.000
Amplitude (µV) V 0.06±0.03a,b 0.06±0.02a,b 0.04±0.02a 0.09±0.02 16.215 0.000
A -0.16±0.04a,b -0.15±0.05a,b -0.12±0.03a -0.19±0.03 14.266 0.000
D -0.11±0.07 -0.09±0.06 -0.09±0.05 -0.10±0.04 0.332 0.802 E -0.18±0.03 -0.20±0.04 -0.18±0.04 -0.20±0.03 1.630 0.189 F -0.10±0.03 -0.10±0.03 -0.10±0.02 -0.11±0.03 0.611 0.610 O -0.11±0.03 -0.12±0.05 -0.12±0.04 -0.13±0.04 0.577 0.632
[image:4.612.91.523.259.446.2]ues of P < 0.008 were considered statistically significant. The initial data can be found in Supplementary Data.
Results
Demographic and clinical data
The illness duration of OSAHS patients ranged from 4 to 6 years. Patients and controls were matched by age, gender (male) and education-al level (years of education ≥ 12, above high-school education), with no significant differ -ences between the two groups (P > 0.05). All subjects exhibited normal hearing (the pure tone test and acoustic immittance were nor-mal). However, OSAHS patients exhibited sig-nificantly greater body mass indexes than con -trol subjects (P < 0.05; Table 1).
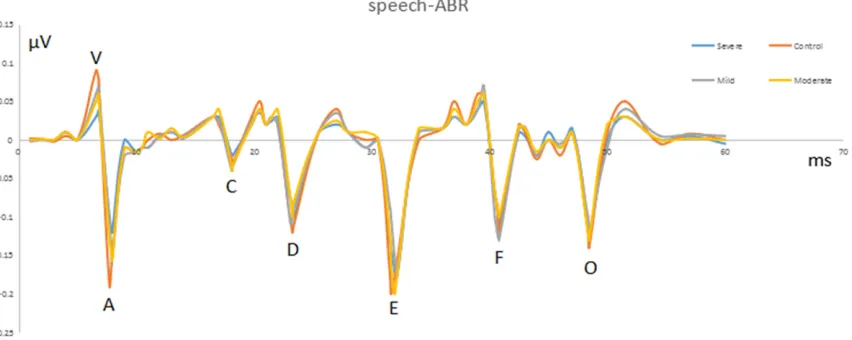
Patterns of wave change in speech-ABR of pa-tient groups
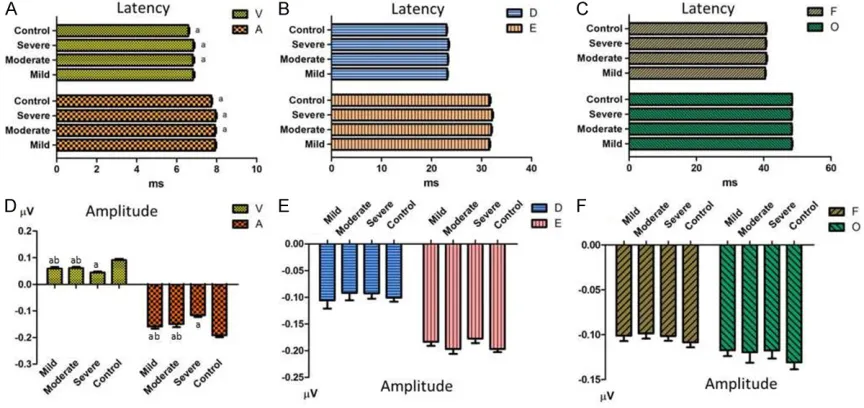
The patient groups showed delayed latency and decreased amplitude of response onset peaks compared with control group counter-parts (both P < 0.05). There was no significant difference in the sustained response (waves D, E and F), waves O and interpeak latency of speech-ABRs among groups. The differences in speech-ABR amplitudes of wave V and A between controls and the mild, moderate and severe groups of OSAHS patients were statisti-cally significant (all P < 0.01). The differences in
speech-ABR amplitudes of wave V and A be- tween the severe group and the control, mild and moderate groups were also statistically significant (all P < 0.05). The V-A slope decre- ased with increased disease severity (Table 2,
Figures 1, 2).
Patterns of wave change of P300 in patient groups
Prolonged P300 latency and reduced ampli-tude occurred concomitant to an increase of disease severity. The differences in P300 laten-cy between controls and the mild, moderate and severe groups of OSAHS patients were sta-tistically significant (P=0.034, 0.001, 0.000, respectively). The differences between the severe group and the control, mild and moder-ate groups were also statistically significant (P=0.001, 0.035, 0.000, respectively). The am- plitude in the severe group appeared to be lower than that in three other groups (P=0.031, 0.030, 0.001 for the mild, moderate, and con-trol groups, respectively), but we found no sig-nificant differences among the mild, moderate and control groups (P > 0.05) (Table 3, Figure 3).
MoCA scores and correlations between P300 and speech-ABRs
[image:5.612.95.521.76.246.2]differences between the control group and the mild, moderate and severe groups of OSAHS patients (F=38.669, P=0.000 < 0.05), as well as within mild, moderate and severe groups (mild vs. control P=0.004; mild vs. moderate P=0.001; mild vs. severe P=0.000; moderate vs. control P=0.000; moderate vs. severe P=0.002; severe vs. control P=0.000). The sub-domain scores revealed a significant reduction in aspects of memory/delayed recall, attention, language and abstraction in severe OSAHS patients compared with the control group (all P < 0.008). In particular, only the differences in language scores between the control group and the mild, moderate and severe groups were statistically significant (P < 0.008 respectively) (Table 4).
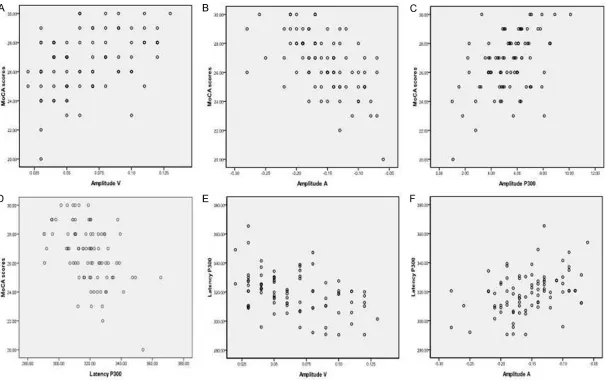
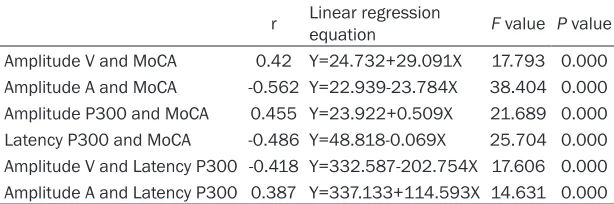
As speech-ABR amplitudes for waves V and A increased, the MoCA scores also progressively increased. Linear regression analysis revealed a positively correlate between these two as the P300 latency became prolonged and the ampli-tude decreased, the MoCA scores decreased progressively. Linear regression analysis reveal-
ed statistically significant correlations between the P300 latency and amplitude and MoCA scores. Furthermore, as speech-ABR ampli-tudes of waves V and A decreased, the P300 latency became progressively prolonged. Am- plitude V and amplitude A were negatively cor-related with Latency P300 (Table 5 and Figure 3).
Discussion
[image:6.612.90.522.73.277.2]OSAHS patients with mild cognitive impairment commonly exhibit excessive daytime sleepi-ness and hypoxemia induced by nocturnal sleep-disordered breathing and apnea epi-sodes [26]. These symptoms have been repre-sented most commonly in terms of attention and memory processing. Cortical and subcorti-cal structures form an integrated neural net-work that interact with each other through afferent and efferent neural pathway [27]. The brainstem is an important structure to them and can both influence and be influenced by this network’s processes. And in this regard, speech encoding in the brainstem auditory Figure 2. The mean latency and amplitude of 6 peaks of the speech-ABR are shown, with error bars representing +1 standard deviation of the mean.
Table 3. Comparison of P300 latency and amplitude in patient groups and control group (M ± SD) Groups Mild (n=19) Moderate (n=20) Severe (n=21) Control (n=25) F value P value Latency (ms) 317.43±9.58a,b 322.05±12.48a,b 330.16±13.90a 309.48±11.83b 11.647 0.000
Amplitude (µV) 5.49±1.50a 5.48±1.56a 4.29±1.80a 5.97±1.93 3.809 0.013
[image:6.612.89.523.343.383.2]pathway can be influenced by hypoxemia-relat -ed inputs from peripheral auditory nervous sys-tems or abnormal orders from more cortical ones via efferent neural fibers [28]. Thus, the disorder of sensory and regulation of the cortex has been associated with hypoxemia-related brainstem neural dysfunction, such as lan-guage impairment [27]. A previous study report-ed that chronic nocturnal intermittent hypox-emia during sleep resulted in dysfunction of the frontal executive cortex, which is particularly vulnerable to hypoxemia, and is proposed to constitute the pathological basis of memory impairment in OSAHS patients [8]. This effect may operate through the forehead and rear head area, generating electrophysiological ac- tivity patterns that lead to ERP abnormalities [29]. Previous research has shown that the cor-tex and hippocampus, P300 generation struc-tures, are particularly sensitive to hypoxemia [30]. Moreover, hypoxemia may induce neuro-nal lesions and atrophy of the hippocampus, which restricts neurocognitive performance [31].
patients with OSAHS. The P300 latency is a sensitive parameter in OSAHS patients. Latency is associated with the interstimuli frequency to the individual’s attention and concentration [3, 33]. It reflects the velocity of brainstem neu -rons in response to a stimulus. The latency of the P300 in the OSAHS group was significantly delayed. As shown in Table 3, this difference exists not only between the patient groups and control group, but also among mild, moderate, and severe groups of OSAHS patients. This sug-gests that the changes in latency in response to hypoxemia are more sensitive than those in amplitude [15].
[image:8.612.91.522.84.204.2]The MoCA is typically considered as the gold standard for examining mild cognitive impair-ment in OSAHS patients. To further examine the role of the P300 in the evaluation of cogni-tive impairment, we analyzed the correlation between the P300 and MoCA. We found that the latency of the P300 was negatively corre-lated with MoCA scores and the amplitude of the P300 was positively correlated with MoCA
Table 4. MoCA total scores and subdomain scores among all groups (M ± SD)
Groups Mild (n=19) Moderate (n=20) Severe (n=21) Control (n=25)
Total scores 27.32±1.16a,c,d 25.85±1.23a,b,d 24.52±1.69a,b,c 28.52±1.16b,c,d
Visuospatial & executive 4,84±0.37 4.65±0.49 4.57±0.6 4.92±0.28
Naming 3.00±0.00 3.00±0.00 2.95±0.22 3.00±0.00
Subdomain scores Memory & delayed recall 4.37±0.60 4.25±0.64 3.90±0.70a 4.56±0.51
Attention 5.79±0.54 5.40±0.68 5.24±0.54a,b 5.76±0.44
Language 1.79±0.71a 1.55±0.60a 0.95±0.80a,b 2.48±0.65
Abstraction 1.63±0.50 1.25±0.64a 1.19±0.60a 1.76±0.44
Orientation 5.95±0.23 5.85±0.37 5.71±0.46 5.96±0.20
Note: 1. MoCA total scores: F=38.669, P=0.000 < 0.05. aP < 0.05, vs. Control group; bP < 0.05, vs. Mild group; cP <0.05, vs.
Moderate group; dP < 0.05, vs. Severe group. (one-way analysis of variance). 2. MoCA subdomain scores:aP < 0.008, vs.
Con-trol group; bP < 0.008, vs. Mild group. (Kruskal Wallis test of rank sum tests, adjusted P values 0.008 is approximate
calcula-tion with Chi-square test).
Table 5. Bivariate correlations and regression within amplitude V, ampli-tude A, latency P300 and MoCA scores
r Linear regression equation F value P value Amplitude V and MoCA 0.42 Y=24.732+29.091X 17.793 0.000 Amplitude A and MoCA -0.562 Y=22.939-23.784X 38.404 0.000 Amplitude P300 and MoCA 0.455 Y=23.922+0.509X 21.689 0.000 Latency P300 and MoCA -0.486 Y=48.818-0.069X 25.704 0.000 Amplitude V and Latency P300 -0.418 Y=332.587-202.754X 17.606 0.000 Amplitude A and Latency P300 0.387 Y=337.133+114.593X 14.631 0.000
Note: Pearson correlation coefficients are represented by r.
[image:8.612.90.397.295.397.2]scores. Thus, we believe that the P300 is an objective means of evaluating the cognitive function of patients with OSAHS, and is an effective supplement to the MoCA scale. MoCA is a brief and sensitive tool for assessing cognitive impairment in OSAHS patients. We found that MoCA scores decreased progres-sively as hypoxemia worsened. Evaluation of MoCA subdomains further revealed selective impairment of memory/delayed recall, atten-tion, language and abstraction in the moder-ate-to-severe groups. These findings are in accordance with the majority of complaints of OSAHS patients. More remarkably, a Kruskal Wallis test analysis of mild, moderate and severe groups showed that only the subdo-mains of language scores were significantly dif -ferent from those in the control group. Based on this finding, we analyzed the composition of this subdomain. It includes two tests, sentence repeats (2 sentences, 2 scores) and word expression fluency (1 score). In the three groups of patients, the average error rates of the three terms were 53%, 40% and 35%, but in control group they were only 8%, 5% and 4%, respec-tively. This shows that the subdomain of lan-guage is sensitive and reliable for cognitive function testing of speech responses. How lis-teners encode such rapid, brief, and complex stimuli into meaningful units and send that information to the cortex is very important for their cognitive function [35].
In Speech-ABR, waves V and A reflect highly synchronized neural responses to the onset of the stimulus. When comparing the latency val-ues of all patients to those of healthy controls, only Peak V and Peak A were significantly differ -ent. These findings indicate that patients with OSAHS have abnormalities in the acoustic rep-resentation of a speech sound as low as the auditory brainstem. Thus, the acoustic charac-teristics of the speech /da/ used to measure speech-ABRs may be challenging to the audi-tory system. The amplitudes of Peak V and Peak A in the OSAHS group were significantly lower than those in the control group. Amplitude reflects the quantity and intensity of brainstem neurons in response to the onset of the stimu-lus. As shown in Table 2, this difference exists not only between patient groups and the con-trol group, but also among the mild, moderate, and severe groups of OSAHS patients, which suggests that the changes in amplitude are
more sensitive to hypoxemia than latency. V/A slope reflects the ratio of interpeak amplitude and interpeak latency of Peak V and Peak A. The smaller the value, the lower the interpeak amplitude and the longer the interpeak latency. The value of the V/A slope is more comprehen-sive and objective than simple measurement of Peak V and Peak A. Moreover, the frequency-following responses (waves D, E, and F) were not significantly different from those in the con -trol group. This might be explained from two aspects, the first, source-class responses rep -resenting steady-state aspects of the stimulus are rate and noise resistant and are not easy to be disrupted in the brainstem auditory path-way; the second, there are distinct neural mechanisms relative to the onset peaks repre-senting acoustic transients in the stimulus (peaks V, A).
Wave O (the offset response) was insignificant -ly different between the study and control groups. This suggests that the timing of responses from onset to offset in brainstem was shortened to stimulate, the compression of reaction time may be the cause of the miss-ing and disorder of speech information codmiss-ing. However, wave C was not analyzed because of its unreliability [36].
Our results reveal that the quantity and inten-sity of the brainstem neurons in response to onset of the stimulus are decreased, and that the encoding of speech sounds in the subcorti-cal auditory pathway can be lagged losubcorti-cally at the level of the response generator. Some researchers suggested that at the levels of the cochlear nucleus and inferior colliculus, there are many types of brain stem cells and the syn-chronous response of them is likely relative to the onset response of the speech-ABR [37]. Because of the existence of the theory of neu-ral synchrony in the centneu-ral auditory system, which may be independent of changes at the periphery, these brain stem cells are likely to be affected by hypoxemia-related loss in cortical structures [38].
from a disorder in auditory neural system at the level of the brainstem. The deficits in the audi -tory brainstem pathway encoding speech are more obvious when hypoxemia was aggravat-ed. Combined with the results of previous stud-ies, our findings suggest that hypoxemia is a leading factor in the correlation between encod-ing of speech and cognitive dysfunction [39]. In this study, the interindividual variability to the response in patient group and control group may lead to the lack of significant differences for lots of the speech-ABR variables. Some researchers found that when recording speech-ABRs, even in normal-hearing subjects using insert earphone, there was possible stimulus artifact disturbance [40]. Because of the simi-larity in temporal changes and spectral distri-butions between the stimulus and response, it is difficult for us to identify this stimulus artifact.
The reason of using alternating polarities is to extract the neural response from the cochlear and eliminate stimulus artifact [40]. Shielded transducers may be helpful in removing the stimulus artifact. The fast Fourier transform (FFT) is the most common algorithm for per-forming spectral analysis [35]. Unfortunately, in our study, we could not perform MATLAB tests to measure spectral analysis of FFR owing to a lack of resources.
Conclusion
In conclusion, the emergence and application of speech-ABR reinforce the viewpoint that the auditory system must include its cognitive func-tion and sensory funcfunc-tion. In other words, sub-cortical function reflects the inherent conflu -ence of sensory and cognitive function; that they may co-exist in an interactive way. There are deficits in the auditory brainstem pathway encoding speech sounds in patients with OSAHS, and that such deficits be an important risk factor for cognitive disorders in the cortex. In future, Speech-ABR can not only provide objective diagnostic tests and techniques to determine appropriate intervention strategies, but also examine the effectiveness of interven-tions in the OSAHS population.
Acknowledgements
We would like to thank the physicians from the Hearing Center of Beijing Chaoyang Hospital,
and the subjects who participated. This study was supported by the National Natural Science Foundation of China,No. 81271090, Scientific Research Fund of the Capital Health Develop- ment, No. 2011-2003-02.
Disclosure of conflict of interest
None.
Address correspondence to: Ningyu Wang, Depart- ment of Otolaryngology Head & Neck Surgery, Bei- jing Chaoyang Hospital, Capital Medical University, Beijing 100020, China. E-mail: 2460331882@ qq.com
References
[1] Beebe DW. Neurobehavioral effects of obstruc-tive sleep apnea: an overview and heuristic model. Curr Opin Pulm Med 2005; 11: 494-500.
[2] Zhang X, Ma L, Li S, Wang Y, Wang L. A func-tional MRI evaluation of frontal dysfunction in patients with severe obstructive sleep apnea. Sleep Med 2011; 12: 335-340.
[3] Gosselin N, Mathieu A, Mazza S, Petit D, Malo J, Montplaisir J. Attentional deficits in patients with obstructive sleep apnea syndrome: an event-related potential study. Clin Neurophysi-ol 2006; 117: 2228-2235.
[4] Mazza S, Pepin JL, Deschaux C, Naegele B, Levy P. Analysis of error profiles occurring dur -ing the OSLER test: a sensitive mean of detect-ing fluctuations in vigilance in patients with obstructive sleep apnea syndrome. Am J Respir Crit Care Med 2002; 166: 474-478. [5] Adams N, Strauss M, Schluchter M, Redline S.
Relation of measures of sleep-disordered breathing to neuropsychological functioning. Am J Respir Crit Care Med 2001; 163: 1626-1631.
[6] Naegele B, Thouvard V, Pepin JL, Levy P, Bon-net C, Perret JE, Pellat J, Feuerstein C. Deficits of cognitive executive functions in patients with sleep apnea syndrome. Sleep 1995; 18: 43-52.
[7] Naegele B, Launois SH, Mazza S, Feuerstein C, Pepin JL, Levy P. Which memory processes are affected in patients with obstructive sleep ap-nea? An evaluation of 3 types of memory. Sleep 2006; 29: 533-544.
[8] Greneche J, Krieger J, Bertrand F, Erhardt C, Maumy M, Tassi P. Short-term memory perfor-mances during sustained wakefulness in pa-tients with obstructive sleep apnea-hypopnea syndrome. Brain Cogn 2011; 75: 39-50. [9] Wind AW, Schellevis FG, Van Staveren G,
dementia in general practice. Int J Geriatr Psy-chiatry 1997; 12: 101-108.
[10] Pan ZJ, Liu WB, Zhang LJ, Xu PF, Zhou JY. [Event-related potentials P (300) with memory function in obstructive sleep apnea syndrome]. Zhonghua Jie He He Hu Xi Za Zhi 2011; 34: 749-752.
[11] Nasreddine ZS, Phillips NA, Bedirian V, Char-bonneau S, Whitehead V, Collin I, Cummings JL, Chertkow H. The montreal cognitive assess-ment, MoCA: a brief screening tool for mild cognitive impairment. J Am Geriatr Soc 2005; 53: 695-699.
[12] Sutton S, Braren M, Zubin J, John ER. Evoked-potential correlates of stimulus uncertainty. Science 1965; 150: 1187-1188.
[13] Findley LJ, Barth JT, Powers DC, Wilhoit SC, Boyd DG, Suratt PM. Cognitive impairment in patients with obstructive sleep apnea and as-sociated hypoxemia. Chest 1986; 90: 686-690.
[14] Picton TW. The P300 wave of the human event-related potential. J Clin Neurophysiol 1992; 9: 456-479.
[15] Gosselin N, Mathieu A, Mazza S, Decary A, Malo J, Montplaisir J. Deficits in involuntary at -tention switching in obstructive sleep apnea syndrome. Neurosci Lett 2006; 408: 73-78. [16] Kotterba S, Rasche K, Widdig W, Duscha C,
Blombach S, Schultze-Werninghaus G, Malin JP. Neuropsychological investigations and event-related potentials in obstructive sleep apnea syndrome before and during CPAP-ther-apy. J Neurol Sci 1998; 159: 45-50.
[17] Vakulin A, Catcheside PG, Baulk SD, Antic NA, van den Heuvel CJ, Banks S, McEvoy RD. Audi-tory evoked potentials remain abnormal after CPAP treatment in patients with severe ob-structive sleep apnoea. Clin Neurophysiol 2012; 123: 310-317.
[18] Banai K, Abrams D, Kraus N. Sensory-based learning disability: Insights from brainstem processing of speech sounds. Int J Audiol 2007; 46: 524-532.
[19] Song JH, Banai K, Russo NM, Kraus N. On the relationship between speech- and nonspeech-evoked auditory brainstem responses. Audiol Neurootol 2006; 11: 233-241.
[20] Bernath I, Bernat I, Pongracz E, Koves P, Sza-kacs Z, Horvath A. Effects of blood hypervis-cosity on functional integrity in the brain stem: a brain stem evoked auditory potential study. Clin Hemorheol Microcirc 2004; 31: 123-128. [21] King C, Warrier CM, Hayes E, Kraus N. Deficits
in auditory brainstem pathway encoding of speech sounds in children with learning prob-lems. Neurosci Lett 2002; 319: 111-115. [22] Skoe E, Kraus N. Auditory brain stem response
to complex sounds: a tutorial. Ear Hear 2010; 31: 302-324.
[23] Banai K, Nicol T, Zecker SG, Kraus N. Brain-stem timing: implications for cortical process-ing and literacy. J Neurosci 2005; 25: 9850-9857.
[24] The sleep apnea committee of Chinese medi-cal association respiratory society. Obstructive sleep apnea hypopnea syndrome diagnosis and treatment guidelines (2011 revised edi-tion). Chin J Tuberc Res Dis 2012; 35: 9-12. [25] Semlitsch HV, Anderer P, Schuster P, Presslich
O. A solution for reliable and valid reduction of ocular artifacts, applied to the P300 ERP. Psy-chophysiology 1986; 23: 695-703.
[26] Naismith S, Winter V, Gotsopoulos H, Hickie I, Cistulli P. Neurobehavioral functioning in ob-structive sleep apnea: differential effects of sleep quality, hypoxemia and subjective sleepi-ness. J Clin Exp Neuropsychol 2004; 26: 43-54.
[27] Strait DL, Hornickel J, Kraus N. Subcortical pro-cessing of speech regularities underlies read-ing and music aptitude in children. Behav Brain Funct 2011; 7: 44.
[28] Banai K, Hornickel J, Skoe E, Nicol T, Zecker S, Kraus N. Reading and subcortical auditory function. Cereb Cortex 2009; 19: 2699-2707. [29] Zhang X, Wang Y, Li S, Huang X, Cui L. Early
detection of cognitive impairment in patients with obstructive sleep apnea syndrome: an event-related potential study. Neurosci Lett 2002; 325: 99-102.
[30] Brown AW, Brierley JB. The earliest alterations in rat neurones and astrocytes after anoxia-ischaemia. Acta Neuropathol 1973; 23: 9-22. [31] Akhoun I, Gallego S, Moulin A, Menard M,
Veuillet E, Berger-Vachon C, Collet L, Thai-Van H. The temporal relationship between speech auditory brainstem responses and the acous-tic pattern of the phoneme /ba/ in normal-hearing adults. Clin Neurophysiol 2008; 119: 922-933.
[32] Pichora-Fuller MK, Schneider BA, Macdonald E, Pass HE, Brown S. Temporal jitter disrupts speech intelligibility: a simulation of auditory aging. Hear Res 2007; 223: 114-121.
[33] Fjell AM, Walhovd KB. Effects of auditory stim-ulus intensity and hearing threshold on the re-lationship among P300, age, and cognitive function. Clin Neurophysiol 2003; 114: 799-807.
[34] Lee HJ, Kim L, Suh KY. Cognitive deterioration and changes of P300 during total sleep depri-vation. Psychiatry Clin Neurosci 2003; 57: 490-496.
[35] Johnson KL, Nicol TG, Kraus N. Brain stem re-sponse to speech: a biological marker of audi-tory processing. Ear Hear 2005; 26: 424-434. [36] Vander WK, Burns KS. Brain stem responses
[37] Gale SD, Hopkins RO. Effects of hypoxia on the brain: neuroimaging and neuropsychological findings following carbon monoxide poisoning and obstructive sleep apnea. J Int Neuropsy-chol Soc 2004; 10: 60-71.
[38] Martins CH, Castro JN, Costa FO, Souza NO. Obstructive sleep apnea and P300 evoked au-ditory potential. Braz J Otorhinolaryngol 2011; 77: 700-705.
[39] Montplaisir J, Bedard MA, Richer F, Rouleau I. Neurobehavioral manifestations in obstructive sleep apnea syndrome before and after treat-ment with continuous positive airway pres-sure. Sleep 1992; 15: S17-S19.