Identifying Leader or Follower using a Binary
Approach
D. M. Akbar Hussain, Member IEEE, IDA, IAENG
∗Abstract—Social network analysis (SNA) has been used to understand the behavior of nodes which could be individuals or group of persons, events or organi-zations etc. Importantly, these nodes propagate in many ways and obviously contains attributes. The leaf nodes/foot soldiers posses low values of centrality measures (degree,betweenness and closeness) indicat-ing relatively not important in comparison to may be other more centrally connected nodes. However, in reality the leaf nodes also called may be follower are very important especially in terrorist cells as they ex-ecute the operations. In this paper a new approach to highlight the distinctiveness of these nodes using a bi-nary concept is presented. The results obtained with our study shows and provides a reasonable point of view in understanding roles of different nodes in the network.
Keywords: Social Network Analysis, Terrorist Cells, Centrality Measures, Foot Soldiers
1
Introduction
Social scientist have developed highly efficient techniques like data mining and decision making tree methods to process large amount of data. Data Mining technique ex-tract particular kind of information from this huge data. Typically, once a particular information is located the data mining application alerts either system or the hu-man operator which determines whether the application has provided the requested information. Data mining also allows to record the search process, so that patterns of objects and information can be visualized as graph. This visualization is quite useful for large amount of data information. In the beginning data mining methodology has been developed largely for businesses applications to help with marketing it also has applications in medical profession. However, more recently it has been used in law enforcement and intelligence operations [1]. The de-velopment and implementation of these system require a cooperative effort on the part of those who develop and those who operate them. The importance of such systems is that they must provide complete information based on the input and typically sound alarm when targeted infor-mation is located however, the final action or judgment
∗Manuscript submitted February 3, 2010 Dr. M. Akbar Hussain
is with the Department of Electronic Systems Aalborg University, Niels Bohrs Vej 8, 6700 Esbjerg, Denmark. Email: [email protected]
is still made by the user. On the other hand decision tree methodology can be used to make decisions. The core idea behind decision tree technique is to correctly locate and identify the choice options which are explicitly eval-uated in terms of the importance of their outcome. The probability of that outcome is used in creating a sequence of decision map from start to end. The most positive as-pect of this method is that decision is made explicit so that others can use the decision tree if faced with the similar questions. Similar to data mining techniques for application in law enforcement and intelligent operations decision trees can also be used to guide decisions. Both of these tools; data mining and decision tree have applica-tions in the analysis of social networks. In our proposed method after the discovery of important nodes individu-ally decision tree approach can be used to establish/reveal further links between these important nodes.
for the analysis, investigation, studying the behavior and tracking terrorist networks (individuals). In this paper we present a simulated study to investigate the behavior of individual nodes using a binary concept explained later in the text.
Typically, one has to identify the following characteristics in the context of SNA:
1. Important individual, event, place or group.
2. Dependency of individual nodes.
3. Leader-Follower identification.
4. Bonding between nodes.
5. Vulnerabilities identification.
6. Key players in the network.
7. Potential threat from the network.
8. Efficiency of overall network.
Application of existing tools on the complex socio-technical systems like SNA is very demanding to win-kle out the required information. Most of the measures and tools work best when the data is complete; i.e., when the information is inclusive about the interactions among the nodes. However, the difficulty is that large scale dis-tributed, covert and terrorist networks typically have con-siderable missing data. Normally, a sampled snapshot data is available, some of the links may be intentionally hidden (hence missing data may not be randomly dis-tributed). Also data is collected from multiple sources and at different time scales and granularity. In addi-tion inclusive and correct informaaddi-tion may be prohibitive because of secrecy. Obviously, there could be other dif-ficulties but even these provide little guidance for what to expect when analyzing these complex socio-technical systems with the existing tools. We have provided de-tails about social network analysis, centrality measures and their mathematics used in the social network anal-ysis in section 2 as comparison has been made between these measures and our proposed technique. Implemen-tation of the proposed technique is explained in section 3 with analysis and discussion of various networks and finally concluding remarks are presented in section 4.
Kathleen Carley has provided the following key charac-teristics for classification and distinctiveness of nodes [3].
1. An individual or group that if given new information can propagate it rapidly.
2. An individual or group that has relatively more power and can be a possible source of trouble, po-tential dissidents, or popo-tential innovators.
3. An individual or group where movement to a com-peting group or organization would ensure that the competing unit would learn all the core or critical information in the original group or organization (in-evitable disclosure).
4. An individual, group, or resource that provides re-dundancy in the network.
The above characteristics are important and typically used as guide lines for the analysis of terrorist/covert cells/networks.
2
SNA
&
Centrality Measures
Social networks provides mapping and the social network analysis measure relationships and movement between people, groups, events, organizations or other informa-tion/knowledge processing entities. People, organization and groups are represented as nodes in the network while the links show relationships or movement between the nodes. SNA provides both visual and mathematical anal-ysis of human relationships. This methodology could also be used by the management to perform Organizational Network Analysis [2]. There are many ways to determine important members of a network. The most straight-forward technique is to compute member’s degree; the number of direct connections to other members of the network apart from degree more well known measures arebetweennessand thecloseness.
A node with relatively few direct connections could still be important if it lies between two or more large groups. On the other hand a member could also be important if it has direct and indirect links in such a way that it is placed closest to all other members of the group, in other words the node has to go through fewer intermediaries to reach other members than anyone else. It is important to note that terrorist cells have complex, dynamical and decen-tralized structures and these standard measures may not be enough to reveal information about important nodes. SNA has been used with other measures to highlight im-portant nodes in terrorist cells [4, 5], other applications like Googles PageRank systems is using the concept of network theory and centrality, in medical field network analysis has been used to track the spread of HIV, more recently a very interesting research for the understanding of relationships from Enron’s email records [6].
2.1
Degree
is central if it is strategically located on the communica-tion route joining pairs of other nodes [7, 8]. Being cen-tral it can influence other nodes in the network, in other words potentially it can control the flow of information. The potential of control makes the centrality conceptual model for these nodes. The idea of centrality is not new it was first applied to human communication by Baveles in 1948 [7, 9]. In this study relationship between structural centrality and influence in group processes were hypothe-sized. Following Baveles it was concluded that centrality is related to group efficiency in problem-solving, percep-tion of leadership and the personal satisfacpercep-tion of partic-ipants [10, 11, 12]. In the fifties and sixties more research was conducted on these measures and it was concluded that centrality is relevant to the way groups get orga-nized to solve problems. The following references pro-vide a very deep and pioneering work on these measures [13, 14, 15, 16, 17, 18, 19, 20, 21, 22].
The centrality concept is not exclusive to deal with group problem tasks, it has been used in other discipline as well [23, 24]. A number of centrality measures have been pro-posed over the past years. Most of the centrality mea-sures are based on one of two quite different conceptual ideas and can be divided into two large classes [25]. The measures in the first class are based on the idea that the centrality of an individual in a network is related to how it is near to others. Second class of measures is based on the idea that central nodes stand between others on the path of communication [26, 27, 28]. A node being on the path of other nodes communication highway has the potential to control what passes through it. The simplest and most straightforward way to quantify the individual centrality is therefore the degree of the individual, i.e., the number of its immediate neighbors. In a graph if every node is reachable from any node in the graph it is called a connected graph also each path in the graph is associ-ated with a distance equal to the number of edges in the path and the shortest path to reach a given pair of nodes is geodesic distance. Nieminen has provided a very sys-tematic elaboration of the concept of degree [29]. Scott has extended the concept based on degree beyond imme-diate (first) neighbors by selecting the number of points an individual can reach at a distance two or three [30]. Similarly, Freeman produced a global measure based on the concept of closeness in terms of the distances among various nodes [27]. The simplest notion of closeness is obtained by the sum of the geodesic distances from an individual to all the other nodes in the graph [31].
Typically, centrality means degree, with respect to com-munication a node with relatively high degree looks im-portant. In a social network a node that is directly con-nected with many other nodes actually see itself and be seen by others in the network as indispensable. This means a node with low degree is isolated from direct in-volvement and see itself and by others not to be a
stake-holder. A general measure of centralityDc(pi) based on
degree for a nodepi is given by [27];
Dc(pi) = n
j=1
d(pj, pi) (f or all j=i) (1)
where
d(pj, pi) =
1 ifpj, pi directly connected
0 otherwise
A node can be connected with maximum of (n−1) num-ber of nodes in ansize network. Therefore, the maximum degree value is (n−1), so to have a relationship which is proportion of other nodes that are directly connected to pi can be written as.
Dc(pi) =
n
j=1d(pj, pi)
(n − 1) (2)
2.2
Betweenness
Betweenness (also called load) measures to what extent a node can play the role of intermediary in the interaction between the other nodes. The most popular and sim-ple betweenness measure based on geodesic path is pro-posed by Freeman and Anthonisse [26, 28]. In many real scenarios however, communication does not travel exclu-sively through geodesic paths. For such situations two more betweenness measures are developed first based on all possible paths between couple of nodes [32] and second based on random paths [33]. Consider a graphG= (V, E) with verticesV and edgesE, a path from a source ver-tex to a target verver-tex is an alternating sequence of edges. The length of this path is the total number of edges from source to target and shortest path of these alternating routes is called the geodesic. Therefore, nodes located on many shortest paths (geodesics) between other nodes will have higher betweenness compared with others. For a graphG= (V, E) with n vertices, the betweennessBc(k)
for a vertexk is:
Bc(k) =
i=j,i=k
σij(k)
σij (3)
where σij is the number of shortest paths from i to j,
andσij(k) is the number of shortest geodesic paths from i to j that pass through vertexk. It can be normalized by dividing through the number of pairs of vertices not includingk, which is (n−1)(n−2). Calculation of be-tweenness is quite complicated for networks when several geodesics connect a pair of nodes, which is the case in most real world networks. Also, Bc(k) is dependent on
Freeman [27] has provided relative centrality of any node in the network by the following relationship.
Bc(k) = Bc(k)
(n2−3n+ 2)/2 (4)
The idea is that maximum value ofBc(k) is achieved by
the central point of the star that is given by;
(n2−3n+ 2)
2 (5)
Therefore, the relative betweenness centrality is deter-mined by the ratio given in equation 4 and is re-written as equation 6.
Bc(k) = (n22−B3c(nk+ 2)) (6)
2.3
Closeness
A more sophisticated centrality measure closeness based on geodesic distance can be defined, which is the mean geodesic (i.e., shortest path) distance between a node and all other nodes reachable from it. Closeness can be re-garded as a measure of how long it will take information to spread from a given node to other nodes in the net-work. From retrospect closeness can provide the infor-mation about nodes independence. Although we are not utilizing the closeness centrality in our implementation, however it was necessary to provide brief detail about closeness to complete the discussion on standard central-ity measures typically used in SNA. The simplest mathe-matics for closeness centrality is provided by [31], which is determined by summing the geodesics from a node of interest to all other nodes in the network and taking its inverse. Closeness grows as the distance between node i and other nodes for example (j....n) increases. The ClosenessCc is given by;
Cc(i) =n 1
j=1d(pj, pi) (7)
Where d is the geodesic distance between respective nodes, for all those nodes which are not connected the geodesic distance is infinity. The above expression is de-pendent on the size (number of nodes) of the network and it is appropriate to have an expression which is indepen-dent of this limitation. Beauchamp [34] suggested that relative Closeness (point centrality) for a nodei is given by;
Cc(i) =n(n − 1)
j=1d(pj, pi) (8)
3
Implementation
&
Analysis
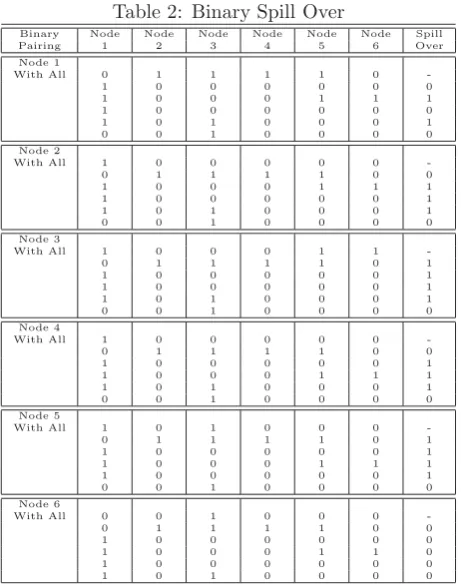
The main idea behind our technique is quite simple as we consider a binary matching between all possible pair-ing and the node which has the lowest or null spill over
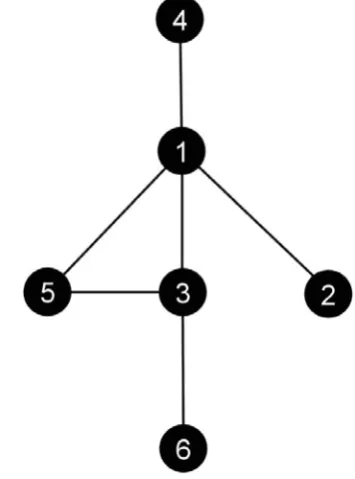
could be considered as the leader and subsequent nodes may have other roles in the network depending on the degree of spill over. We explain the implementation of our model by considering an example random network of nodes (graph) as shown in figure 1.
Figure 1: Network of 6 Nodes
It is apparent from the graph that nodes: 2, 4 and 6 can either be followers or leaders where as other nodes have various positions to be of some importance. Table 1 pro-vides the values for three centrality measures and it can be seen that various nodes have different standing based on which centrality measure one consider for evaluation. However, it is difficult to figured out who could be the leader so we use our binary approach by considering all nodes and pairing through binary way as shown in table 2.
[image:4.595.325.503.124.364.2]As pointed out earlier we know that nodes 2, 4 and 6 can be either leaders or followers (foot soldiers). Now from table 2 it can be seen that Node 6 has the least or null spill over and according to our assumption we believe that node having the least amount of spill over indicate node sitting at a higher level having less amount of communication with the rest of the network which is a typical case of a leader in terrorist network. Nodes 2 and 4 have equal amount of spill over so both can be followers. The other nodes in the network has larger spill over so obviously standing at other positions in the network.
Table 1: Centrality Measures for Figure 1
Centrality Measures
4
Conclusion
[image:5.595.47.278.296.590.2]SNA has been performed by researchers in various con-texts, for example in the analysis of structure and gener-ative mechanism of networks, structural analysis of ties among different nodes. For this purpose various central-ity measures exist apart from standard measures like de-gree, betweenness and closeness. Our proposed model for discovering leaders or followers also comes in the latter category. We have shown through simulation by consider-ing a random network to locate leaders or foot soldier by determining the amount of spill over between nodes pair-ing. The proposed method provides us a clear vision in determining the role of a leader or follower which is hard to determine with standard centrality measures. However our proposed method is still in the development stage al-though we have provided quite simple and clear evidence of its functionality but we believe that more work with larger and complex networks is necessary in future.
Table 2: Binary Spill Over
Binary Node Node Node Node Node Node Spill
Pairing 1 2 3 4 5 6 Over
Node 1
With All 0 1 1 1 1 0
-1 0 0 0 0 0 0
1 0 0 0 1 1 1
1 0 0 0 0 0 0
1 0 1 0 0 0 1
0 0 1 0 0 0 0
Node 2
With All 1 0 0 0 0 0
-0 1 1 1 1 0 0
1 0 0 0 1 1 1
1 0 0 0 0 0 1
1 0 1 0 0 0 1
0 0 1 0 0 0 0
Node 3
With All 1 0 0 0 1 1
-0 1 1 1 1 0 1
1 0 0 0 0 0 1
1 0 0 0 0 0 1
1 0 1 0 0 0 1
0 0 1 0 0 0 0
Node 4
With All 1 0 0 0 0 0
-0 1 1 1 1 0 0
1 0 0 0 0 0 1
1 0 0 0 1 1 1
1 0 1 0 0 0 1
0 0 1 0 0 0 0
Node 5
With All 1 0 1 0 0 0
-0 1 1 1 1 0 1
1 0 0 0 0 0 1
1 0 0 0 1 1 1
1 0 0 0 0 0 1
0 0 1 0 0 0 0
Node 6
With All 0 0 1 0 0 0
-0 1 1 1 1 0 0
1 0 0 0 0 0 0
1 0 0 0 1 1 0
1 0 0 0 0 0 0
1 0 1 0 0 0 0
References
[1] Shaw Michael J. Subramaniam Chandrasekar Tan Gek Woo Welge Michael E.:. Knowledge manage-ment and data mining for marketing. decision sup-port systems. vol. 31(1) 127-137, 2001.
[2] Valdis Krebs:. Connecting the dots, tracking two identified terrorists, 2002.
[3] Kathleen M. Carley Ju-Sung Lee David Krackhardt:. Destabilizing networks, dept. of social and decision sciences, carnegie mellon university, pittsburgh, pa 15143, november 2001.
[4] Dil M. Akbar Hussain:. Destabilization of terror-ist networks through argument driven hypothesis model, journal of software, vol. 2, no. 6, pages 22 - 29, 2007.
[5] Dil M. Akbar Hussain Daniel Ortiz-Arroy:. Locating key actors in social networks using bayes posterior probability framework, lecture notes in computer sci-ence. InIntelligence and Security Informatics, Vol-ume 5376/2008.
[6] Adibi J.: Shetty, J. Discovering important nodes through graph entropy the case of enron email database. in: Linkkdd 2005: Proceedings of the 3rd international workshop on link discovery, pp. 7481. acm, new york (2005).
[7] Bavelas A:. A mathematical model for group struc-tures”. human organization 7: Pages 16 - 30, 1948.
[8] Shaw M. E:. Group structure and the behaviour of individuals in small groups, journal of psychology, vol. 38, pages 139 - 149, 1954.
[9] Bavelas A:. Communication patterns in task ori-ented groups”. journal of the acoustical society of america vol. 22, pages 271 - 282, 1950.
[10] Leavitt Harold J:. Some effects of communication patterns on group performance. journal of abnormal and social psychology vol. 46, pages 38 - 50, 1951.
[11] Smith Sidney L:. Communication pattern and the adaptability of task-oriented groups: an experimen-tal study. cambridge, ma: Group networks lab-oratory, research laboratory of electronics, mas-sachusetts institute of technology, 1950.
[12] Bavelas A. and D. Barrett:. An experimental ap-proach to organizational communication. personnel vol. 27, pages 366 - 371, 1951.
[13] Glanzer M. and R. Glaser:. Techniques for the study of team structure and behaviour. part ii: Empirical studies of the effects of structure. technical report, pittsburgh, american institute, 1957.
[14] Glanzer M. and R. Glaser:. Techniques for the study of group structure and behaviour. part ii: Empirical studies of the effects of structure in small groups. psychological bulletin 58, pages l - 27, 1961.
[16] Shaw M. E:. Communication networks”, in l. berkowitz (ed.), advances in experimental social psy-chology, vol. vi, pages 111 - 147, new york, academic press, 1964.
[17] Stephenson K. A. and Zelen M:. Rethinking cen-trality: Methods and examples, social networks 11, pages 1 - 37, 1989.
[18] Flament C:. Applications of graph theory to group structure. englewood cliffs, nj, prentice hall, 1963.
[19] Burgess R. L:. Communication networks and be-havioural consequences”. human relations 22, pages 137 - l59, 1968.
[20] Snadowski A:. Communication network research: an examination of controversies”. human relations 25, pages 283 - 306, 1972.
[21] Rogers D. L:. Socio-metric analysis of inter-organizational relations: application of theory and measurement. rural socioeonv 39, pages 487 - 503, 1974.
[22] Rogers D. L:. Communication networks in organi-zations. communication in organizations, pages 108 - 148, 1976, new york, free press.
[23] Cohn B. S. and M. Marriott:. Networks and centres of integration in indian civilization. journal of social research i, pages 1 - 9, 1958.
[24] Pitts F. R:. A graph theoretic approach to historical geography, the professional geographer 17, pages 15 - 20, 1965.
[25] Latora V. and Marchiori M:. A measure of centrality based on network efficiency, arxiv.org preprint cond-mat/0402050, 2004.
[26] Freeman Linton C:. A set of measures of centrality based on betweenness, sociometry 40, pages 35 - 41, 1971.
[27] Freeman Linton C:. Centrality in social networks: Conceptual clarification, social networks 1, page 215 - 239, 1979.
[28] Anthonisse J. M:. The rush in a graph, university of amsterdam mathematical centre, amsterdam, 1971.
[29] Nieminen J:. On centrality in a graph. scandinavian journal of psychology 15, pages 322 - 336, 1974.
[30] Scott J:. Social networks analysis. 2nd edition, sage publications, london, 2003.
[31] Sabidussi G:. The centrality index of a graph. psy-chometrika 31, pages 581 - 603, 1966.
[32] Freeman Linton C. Stephen P. Borgatti and Dou-glas R. White:. Centrality in valued graphs, a mea-sure of betweenness based on network flow. social networks 13, pages 141 - 154, 1991.
[33] Newman M. E. J:. A measure of betweenness cen-trality based on random walks, cond-mat/0309045, 2003.