doi:10.4236/jwarp.2009.14034 Published Online October 2009 (http://www.SciRP.org/journal/jwarp/).
Study on Reducing Leachate Production
by Saw Powder Adding
Jun YIN1, Baojun JIANG1, Xiaoyan WU2, Liang LIANG2, Xue LIU2
1
School of Municipal and Environmental Engineering, Harbin Institute of Technology, Harbin, China.
2
Jilin Province Key Laboratory of Water Pollution Control and Resources Reuse, Jilin Architectural and Civil Engineering Institute, Changchun, China
E-mail: [email protected]
Received June 26, 2009; revised July 29, 2009; accepted August 6, 2009
Abstract
In order to study the effect of saw powder on leachate production, degradation of rubbish, COD and NH3-N
concentration of leachate, three cylinder reactors for anaerobic landfill disposal were built to simulate the op-eration of landfill. In this experiment, leachate quantity, settling height of rubbish layer, COD and NH3-N
concentration were monitored. The results come from experiment data analyses indicate that saw powder has strong effect on reducing leachate quantity and accelerating degradation of rubbish. In 60 days, saw powder mixed in rubbish layer can reduce 1200-1300mL leachate every liter rubbish, moreover, rubbish layer with saw powder mixed in settled more leachate than rubbish layer with no saw powder mixed in for 5cm. The ex-perimental resultsindicate that saw powder can reduce COD concentration of leachate and adsorb NH3-N, too.
Keywords:Leachate, Saw Powder, Reduction, Landfill, Degradation
1. Introduction
Nowadays, people take ground water as drinking water resource in many regions of China, and it is closely re-lated with people’s health, however, the ground water could be polluted by leachate seriously. As a kind of or-ganic wastewater with complex integrant, its COD con-centration is regular at 2000-80000mg/L, which is sev-eral hundred times higher than COD concentration of domestic sewage and industrial effluents; NH3-N
con-centration of leachate is usual at 1000-6000mg/L, which is 20-40 times higher than domestic sewage’s and indus-trial effluent’s [1]. Furthermore, there are more than ten kinds of heavy metal ions in leachate, so it is a difficulty for leachate treatment all over the world. Nowadays, many researchers have done widely study in leachate treatment field, and a lot of useful results have been ob-tained [2]. However, little research has been done in leachate reduction. Obviously, the costs of leachate treatment is higher than the cost of sewage and industrial wastewater treatment, therefore, if developing a operated easily and cost lower to reduce leachate quantity tech-nology, the burden of dealing with leachate can be re-duced and the costs of leachate treatment can be lowered too. Saw powder is a kind of scrap which comes from timber processing, and physical characters are bulk
den-sity 0.19kg/cm3, total pore volume 78.3%, big pore vol-ume 34.5%, small pore volvol-ume 43.8% [3–8], so saw powder has perfect absorption ability because of this nature. Saw powder was added in rubbish as absorbent and filler in this experiment, a rubbish column no saw powder added in was taken as contrast reactor. The re-search contents are that the effect and mechanism of saw powder reducing leachate quantity; the effect of saw powder on rubbish degradation; the effect of saw powder on COD and NH3-N concentration of leachate and the
effect of saw powder on pollutant stripping.
2. Materials and Methods
2.1. Experimental Device
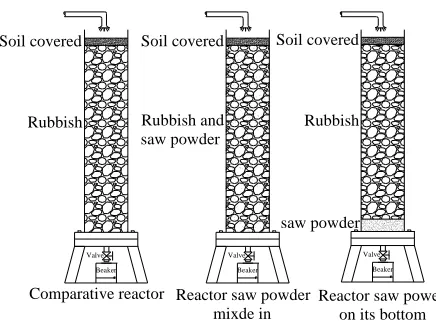
was added on the bottom of the third reactor, the same quantity saw powder was mixed homogeneously in rub-bish in the second reactor. The rubrub-bish layer was 0.76 meters in height in the first and third reactor, considering saw powder occupation of some volume, the rubbish layer was 0.80 meters in height in the second reactor (but still measured as 0.76 meters in rubbish height), soil layer with 0.05 meters thickness was covered on the top of the rubbish layer in three reactors. The total volume of rub-bish compacted in every reactor was 5.8875 liters. Leachate was collected by the beaker on the bottom of the experimental device. The organic glass columns used in the experimental cannot take any reactions with leachate. The experimental device was presented as Figure 1.
2.2. Experimental Methods
In the experiment, 300mL tap water was sprayed on the head of the reactors homogeneously every 5 days to simulate raining. Then, the volume of leachate produced from rubbish layer in the reactors and heights of rubbish layer were measured every 24 hours, COD concentration of leachate was measured every 48 hours, NH3-N
con-centration of leachate was measured every 120 hours. COD measure method used in the experiment was Potas-sium dichromate method (GB11914-89), NH3-N measure
method used in the experiment was Nessler's Reagent Colorimetric method (GB7479-87).
3. Results and Disdussion
[image:2.595.61.279.540.702.2]3.1. The Effect of Adding Saw Powder on Leachate Reduction
Figure 2 is shown the variation of leachate quantity pro-ducing from rubbish layers in three reactors with time. Every abscissa represents days of experiment, every or-dinate represents the ratio of total leachate volume pro-
Reactor saw power on its bottom Reactor saw powder
mixde in Comparative reactor
Beaker Valve Beaker
Valve Soil covered
Rubbish
Soil covered
Rubbish and saw powder
saw powder Soil covered
Rubbish
Beaker Valve
Figure 1. The chart of experimental device.
ducing from the beginning of the experiment to the day abscissa corresponding and rubbish volume. The curved lines shows that leachate quantity of the second and the third reactors was always shorter than leachate quantity of the first reactor, moreover, leachate quantity of the second reactor was shorter than leachate quantity of the third reactor. In the first 25 days, the trend that leachate quantity of the second and the third reactors were shorter than leachate quantity of the first reactor wasn’t obvious, then, leachate quantity of reactors with saw powder added began to be shorter than leachate quantity of comparative reactor obviously, leachate quantity of the second reactor was 1000-1400mL shorter than leachate quantity of the first reactor every liter rubbish, 1200- 1300mL shorter in mostly time; leachate quantity of the third reactor was 700-1100mL shorter than leachate quantity of the first reactor every liter rubbish, 900- 1000mL shorter in mostly time. The reduction effect of saw powder on leachate became more and more obvious. The results of the experiment also indicate that the re-duction result is better of saw powder mixed in rubbish than saw powder added on the bottom of rubbish. After 50 days, saw powder in the third reactor began to be-come black step by step and settled a little, which showed that saw powder had begun to degrade obvi-ously.
The authors think that there are two phases to com-plete the reduction of saw powder on leachate. In the first phase, it mainly depends on adsorption water effect of saw powder. A fraction of water is adsorbed by saw powder during the course of leachate flow the whole rubbish layer. In first 25 days, soil covered layer and rubbish layer don’t reach their field moisture capacity, most sprayed water was absorbed by soil and rubbish, only a little water was absorbed by saw powder, so the reduction effect of saw powder on leachate wasn’t obvi-ous. After rubbish layer reached its field moisture capac-ity, saw powder absorbed water in rubbish layer fully, this reduced leachate quantity. On the condition of the same saw powder quantity was added, there were more
0.0 2000.0 4000.0 6000.0 8000.0 10000.0 12000.0
0 5 10 15 20 25 30 35 40 45 50 55 60 65
T ime(/d)
L
each
at
e(
m
L
)/
ru
b
b
is
h
(L
)
[image:2.595.314.532.555.702.2]Leachate quantity of comparative reactor Leachate quantity of reactor saw powder mixed in Leachate quantity of reactor saw powder on its bottom
(C6H10O5)n
C6H12O6Acetone butyl alcohol fermentation
CH3COCH3+C4H9OH+CH3COOH+CO2+H2C3H7COOH+CH3COOH+CO2+H2
CH3CH2CH2COOH+2H2O
Hydrogen-producing acetogenic
2CH3COOH+2H2Butyric acid
CH3CH2CH2CH2OH+3H2O
Hydrogen-producing acetogenic
2CH3COOH+4H2CH3COCOOH
2
Anaerobic co
CH3CHO
H2CH3CH2OH
CH3CH2OH+H2O
Hydrogen-producing acetogenic
CH3COOH+2H2CH3COOH
Methanogens
CH4+CO2chances of touching saw powder for water in rubbish in the second reactor than water in rubbish in the third re-actor when it flowed rubbish layer in seepage, therefore more water was absorbed and less leachate produced in the second reactor. In the second phase, it mainly de-pends on consumption water effect of saw powder during its degradation. Saw powder in the reactors was degraded by microorganisms in rubbish little by little with the ex-tended rubbish landfill time. The main ingredient of saw powder is cellulose, the proportion of cellulose in saw powder is more than 50%. The degradation processing of cellulose can be showed as the following biochemical function:
It can be known from the functions that water in the rubbish cell be consumed during the course of degrada-tion cellulose, hydrogen of consumed water becomes hydrogen element of methane, oxygen of consumed wa-ter becomes oxygen element of carbon dioxide, but there is not water produce during the whole course of saw powder degradation. A part of water consumed in the second phase comes from water absorbed by saw powder in the first phase,so the reduction effect of saw powder on leachate in the second phase is secondary to the re-duction effect in the first phase. Furthermore, there are more microorganisms in rubbish layer than that in saw powder layer on the bottom of reactor, saw powder mixed in rubbish can be degraded more completely than saw powder on the bottom of the reactor, so more water is consumed and less leachate is produced.
3.2. The Effect of Adding Saw Powder on Rub-bish Degradation Velocity
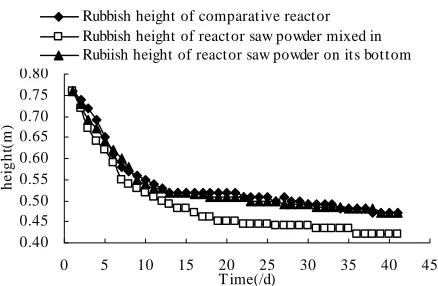
The variation curved lines of rubbish layer heights in three reactors with time are showed in Figure 3. The curved lines show that rubbish layers in first reactor and third reactor settled almost at the same velocity, however, rubbish in second reactor settled more quickly than rub-bish in first reactor. After 41 days, rubrub-bish layer height in fist and third reactor became 0.47 meters, rubbish layer height in fist and third reactor became 0.42 meters, this experimental result indicates that saw powder mixed in rubbish layer can accelerate rubbish degradation, but saw powder added on the bottom of rubbish layer hasn’t
effect on velocity of rubbish degradation. Saw powder mixed in rubbish layer can take the action of filler, mi-croorganisms attaching on surface of saw powder form biomembrane, moreover, water saw powder absorbing was utilized effectively by microorganisms, so rubbish surrounding saw powder could be degraded more quickly. But at the same time, saw powder absorbed and con-sumed water in rubbish layer during the course of deg-radation, lowered water content of rubbish, which decel-erated rubbish degradation. Because water content is an important factor of influencing rubbish degradation, it is benefit to dissolve nutrients microorganisms needing if water content of rubbish is enough, then all kinds of biochemical reactions can take place normally and mi-croorganisms can attain nutrients easily, it is benefit to microorganisms propagation, which accelerates rubbish degradation. On the contrary, water content of rubbish isn’t enough will result in lowering rubbish degradation velocity. Generally speaking, as a kind of filler, saw powder still can accelerate rubbish degradation. The ex-perimental data indicates that the settling height of rub-bish layer with saw powder mixed in always 0.02~0.05 meters lower than the settling height of comparative rub-bish layer in 41 days of rubrub-bish degradation.
3.3. The Effect of Adding Saw Powder on COD of Leachate
The COD concentration variation of leachate with time is
0.40 0.45 0.50 0.55 0.60 0.65 0.70 0.75 0.80
0 5 10 15 20 25 30 35 40 45
T ime(/d)
he
igh
t(
m
)
[image:3.595.315.534.555.698.2]Rubbish height of comparative reactor Rubbish height of reactor saw powder mixed in Rubiish height of reactor saw powder on its bottom
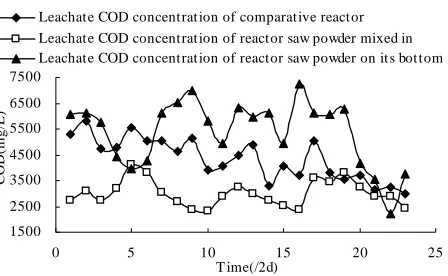
showed in Figure 4, the COD content variation of leachate with time is showed in Figure 5. COD content represents multiplication of COD concentration and leachate quantity produced that day. Curved lines in Figure 4 indicates that COD concentration of leachate produced in the first reactor was lower than COD con-centration of leachate produced in the third reactor, but higher than that of the second reactor. Saw powder absorbed water in rubbish, which reduced leachate quantity, therefore COD concentration of leachate stripping from the third reactor was higher than COD concentration of leachate stripping from the first reac-tor. Water in rubbish was absorbed by mixed saw powder, which can result in COD concentration of leachate raise. But saw powder also takes the action of filler, which can accelerate rubbish degradation, so dissolved organisms in leachate produced in the second reactor can be degraded more completely than dis-solved organisms in leachate produced in the first re-actor, which result in COD content of stripping leachate from the second reactor was lower than COD content of stripping leachate from the first reactor, so COD concentration of leachate produced in the second reactor is lower than COD concentration of leachate produced in the first reactor. The experimental result
1500 2500 3500 4500 5500 6500 7500
0 5 10 15 20 25
T ime(/2d)
C
OD(
m
g
/L
)
[image:4.595.62.286.375.513.2]Leachate COD concentrat ion of comparative reactor Leachate COD concentrat ion of reactor saw powder mixed in Leachate COD concentrat ion of reactor saw powder on it s bottom
Figure 4. The COD concentration variation of leachate with time.
0 500 1000 1500 2000
0 5 10 15 20 25
T ime(/2d)
T
h
e
to
to
l o
f C
O
D
c
o
n
te
st(
m
g
)
[image:4.595.307.531.417.522.2]Leachat e COD content of comparative reactor Leachat e COD content of reactor saw powder mixed in Leachat e COD content of reactor saw powder on it s bottom
Figure 5. The COD content variation of leachate with time.
indicates that saw powder can reduce leachate quantity and lowering COD concentration of leachate. Saw powder on the bottom of rubbish layer don’t touch rubbish completely and there were few microorganisms in saw powder layer, so it cannot take the action of accelerating rubbish degradation. Curved lines in Fig-ure 4 indicate that pollutant quantity stripping from second reactor was shorter than pollutant quantity stripping from first reactor, however, the difference of pollutant quantity stripping from the third reactor and pollutant quantity stripping from first reactor isn’t ob-vious, which proves the experimental result that saw powder mixed in rubbish can accelerate rubbish deg-radation and reduce pollutant quantity stripping from rubbish further.
3.4. The Effect of Adding Saw Powder on NH3-N
of Leachate
High concentration NH3-N is a mainly character of
leachate, and it is also a difficulty for leachate treatment, NH3-N concentration of leachate produced from rubbish
layer of first and second reactor were monitored in the experiment, the variation curved lines of NH3-N
concen-tration with time are showed in Figure 6, the variation
0 1000 2000 3000 4000 5000
0 2 4 6 8 10
T ime(/5d)
NH
3
-N
(m
g
/L
)
Leachate NH3-N concentration of comparative reactor
[image:4.595.313.535.554.702.2]Leachate NH3-N concentration of reactor saw powder mixed in
Figure 6. NH3-N concentration variation of leachate with time.
0 200 400 600 800 1000 1200 1400
0 2 4 6 8
T ime(/5d)
T
h
e
to
to
l o
f N
H
3
-N
c
o
n
te
st(
m
g
)
10 Leachate NH3-N content of omparative reactor Leachate NH3-N content of reactor saw powder mixed in
[image:4.595.59.282.558.701.2]curved lines of NH3-N content with time are showed in
Figure 7, NH3-N content represents multiplication of
NH3-N concentration and leachate quantity produced that
day. The curved lines indicate that NH3-N concentration
variation of leachate produced from rubbish layer of first and second reactor was basically the same, because leachate quantity of rubbish layer in second reactor was shorter than leachate quantity of rubbish layer in first reactor and rubbish in second reactor degraded more rapidly than rubbish in first reactor, NH3-N concentration
of leachate produced in rubbish of second reactor should be higher obviously than NH3-N concentration of
leachate produced in rubbish of first reactor, but in fact NH3-N concentration of leachate produced from first and
second reactor were basically the same, this phenomenon proves that saw powder can adsorb NH3-N. Adsorption
of saw powder on NH3-N prevented from NH3-N
con-centration rising which probably happen because of the reduction and acceleration degradation effect of saw powder. Figure 7 shows that there wasn’t too much dif-ference of NH3-N content stripping from rubbish layer of
first reactor and that of second reactor, this experimental result proves that saw powder can adsorb NH3-N further.
4. Conclusion
1) Saw powder has obvious reduction effect on leachate. Leachate quantity can be reduced 1200-1300mL for liter rubbish by mixing saw powder in rubbish; leachate quantity can be reduced 900-1000mL every liter rubbish by adding saw powder on the bottom of rubbish layer. According to this experimental result, less than 600m3 leachate can be reduced every 500t rubbish during the course of degradation, which reduces greatly the burden of dealing with leachate, and it will bring many social benefits.
2) Saw powder can obviously accelerate rubbish deg-radation and mineralization. The experimental results indicate that rubbish layer mixed saw powder in settle 5cm more than rubbish layer no saw powder in 60 days.
3) Saw powder mixed in rubbish can lower COD con-centration of leachate, but level of pollutant stripping from rubbish layer of second reactor and first reactor is
almost the same. Saw powder has strong adsorption ef-fect on NH3-N.
5. Future Perspective
The reduction of leachate is still in the initial stage, a brief analysis and summary is done in the essay, there are masses of work should be carried out in the future, such as the best sawdust dosage, other filler (discarded news-paper, active carbon, zeolite), operation process, and so on.
6
. References
[1] Z. Salem, K. Hamouri and R. Djemaa, “Evaluation of landfill leachate pollution and treatment,” Desalination, Vol. 220, pp. 108–109, 2008.
[2] S. Bilgili, “COD fractions of leachate from aerobic and anaerobic pilot scale landfill reactors,” Journal of Haz-ardous Materials, Vol. 1, No. 55, pp. 15–18, January 2008.
[3] X. Y. Shi, B. Xiao, J. F. Li, and X. Y. Yang, “Application of sawdust to heavy metal containing wastewater treat-ment,” Industrial Water Treatment, Vol. 27, No. 4, pp. 12–15, April 2007.
[4] S. L. Huo, B. D. Xi, H. C. Yu, and L. S. He, “Character-istics of dissolved organic matter (DOM) in leachate with different landfill ages,” Journal of Environmental Sci-ences, Vol. 20, pp. 492–498, 2008.
[5] E. Neczaj, M. Kacprzak, J. Lachc, and E. Okoniewska, “Effect of sonication on combined treatment of landfill leachate and domestic sewage in SBR reactor,” Desalina-tion, Vol. 204, pp. 227–233, 2007.
[6] C. Visvanathan, M. K. Choudhary, M. T. Montalbo, and V. Jegatheesan, “Landfill leachate treatment using ther-mopile membrane bioreactor,” Desalination, Vol. 204, pp. 8–16, 2007.
[7] L. Zhu, “Landfill leachate treatment with anovel process: Anaerobic annonium oxidation (Anammox) combined with soil infiltration system,” Journal of Hazardous Ma-terials, Vol. 151, pp. 202–212, 2008.