Citation: Muñoz, M.M., Stimola, M.A., Algar, A.C., Conover, A., Rodriguez, A., 1
Landestoy, M.A., Bakken, G.S., Losos, J.B. 2014. Evolutionary stasis and lability in 2
thermal physiology in a group of tropical lizards. Proceedings of the Royal Society B: 3
Biological Sciences 281: 2013244. DOI: 10.1098/rspb.2013.2433 4
5
This is a post peer-review version 6
Title: Evolutionary stasis and lability in thermal physiology in a group of tropical lizards. 7
8
Authors: Martha M. Muñoz*1, Maureen A. Stimola*2, Adam C. Algar3, Asa Conover4, 9
Anthony Rodriguez5, Miguel A. Landestoy6, George S. Bakken7, and Jonathan B. Losos1 10
*denotes equal contribution 11
12
Addresses: 13
1 Department of Organismic and Evolutionary Biology and Museum of Comparative 14
Zoology, Harvard University, Cambridge, MA, 02138 USA 15
2 Department of Ecology, Evolution and Environmental Biology, Columbia University, 16
1200 Amsterdam Avenue, NY, 10027 USA 17
3 School of Geography, University of Nottingham, Sir Clive Granger Building, 18
University Park, Nottingham NG7 2RD, United Kingdom 19
4 Stuyvestant High School, 345 Chambers Street, New York, NY, 10282 USA 20
5 Department of Wildlife, Fish, & Conservation Biology, University of California, Davis, 21
One Shields Avenue, Davis, CA, 95616 USA 22
6 Sociedad Ornitológica de la Hispaniola, Gustavo Mejía Ricart 119 B, Apto. 401, 23
Galerías Residencial, Santo Domingo, República Dominicana 24
7 Department of Biology, Indiana State University, Terre Haute, IN, 47809 USA 25
26
Key words: thermoregulation, thermal physiology, physiological evolution, Anolis 27
Abstract 24
Understanding how quickly physiological traits evolve is a topic of great interest, 25
particularly in the context of how organisms can adapt in response to climate warming. 26
Adjustment to novel thermal habitats may occur either through behavioural adjustments, 27
physiological adaptation, or both. Here we test whether rates of evolution differ among 28
physiological traits in the cybotoids, a clade of tropical Anolis lizards distributed in 29
markedly different thermal environments on the Caribbean island of Hispaniola. We find 30
that cold tolerance evolves considerably faster than heat tolerance, a difference that 31
results because behavioural thermoregulation more effectively shields these organisms 32
from selection on upper than lower temperature tolerances. Specifically, because lizards 33
in very different environments behaviourally thermoregulate during the day to similar 34
body temperatures, divergent selection on body temperature and heat tolerance is 35
precluded, whereas night-time temperatures can only be partially buffered by behaviour, 36
thereby exposing organisms to selection on cold tolerance. We discuss how exposure to 37
selection on physiology influences divergence among tropical organisms and its 38
implications for adaptive evolutionary response to climate warming. 39
40
Introduction 41
Rising temperatures present unique challenges for tropical ectotherms, which 42
already generally function near their upper thermal limits: even small temperature 43
increases can have disproportionately large negative consequences for these organisms 44
(Deutsch et al. 2008; Huey et al. 2009). Studies assessing tropical ectotherms’ 45
will have the most pronounced effects on organismal fitness by correlating physiological 47
traits with environmental data and using these relationships to infer where range shifts 48
and local extinctions will occur (e.g., Sinervo et al. 2010; Chen et al. 2011). However, the 49
evolutionary potential of populations to respond to novel selective pressures imposed by 50
rising temperatures is an equally important and comparatively unexplored aspect of 51
response to climate warming (Williams et al. 2008). 52
Behaviour and physiology can interact to determine how organisms interact with 53
their thermal environments (Stevenson 1985). Organisms that thermoregulate limit 54
exposure to suboptimal temperatures – a phenomenon commonly referred to as the 55
‘Bogert effect’ (Bogert 1949; Huey et al. 2003). Physiological traits that behavioural 56
thermoregulation can shield from selection should evolve less than traits that cannot be so 57
easily buffered and thus are exposed to stronger selection. Because many environments 58
are more thermally complex in the day than at night (Sarmiento 1986; Ghalambor et al. 59
2006), thermoregulation should be more effective at shielding diurnal organisms from 60
selection on upper than lower physiological limits and, consequently, tolerance to cold 61
should evolve faster than tolerance to heat. 62
In this study we compare rates of physiological evolution in the cybotoids, a 63
tropical clade of Anolis lizards from the Caribbean island of Hispaniola whose members 64
differ extensively in thermal habitat (Schwartz 1989; Glor et al. 2003). Previous work by 65
Hertz and Huey (1981) found similar body temperatures and heat tolerance among three 66
cybotoid species and provided ecological data suggesting they are good thermoregulators. 67
Our study expands on this work in terms of populations, species, and physiological traits 68
found from sea level to almost 3,000 meters (Henderson and Powell 2009); as a result, 70
the environments they experience pose different selective pressures and provide the 71
opportunity for behavioural and physiological adaptation to different thermal extremes. 72
We first present a comparative analysis of three ecologically important 73
physiological traits – cold tolerance (CTmin), body temperature (Tb), and heat tolerance
74
(CTmax) – across thermal environments. We then compare rates of evolution among these
75
traits using a likelihood-based approach and test whether behavioural thermoregulation 76
can limit exposure to extreme temperatures using field estimates of basking site selection 77
and night-time temperatures. Finally, we discuss the role of behaviour in setting the pace 78
of physiological evolution in tropical ectotherms and how behaviour influences adaptive 79
evolutionary potential in physiological traits. 80
81
Materials and Methods 82
Study Organisms and Study Sites 83
The cybotoid anoles are a clade of nine species from Hispaniola commonly found 84
on trunks or near the ground (Schwartz 1989). Species occupy nearly all available 85
climatic environments from xeric semi-deserts to high elevation mountains, which have 86
been occupied independently by two different lineages (Glor et al. 2003; Wollenberg et 87
al. 2013). Our sampling was conducted in June and July 2011 and focused on the seven 88
cybotoids found in the Dominican Republic (Fig. 1). The other two species are A. 89
breslini, which is restricted to northwestern Haiti and is ecologically quite similar to A. 90
whitemani (Williams 1963), and A. haetianus, which is found only in Western Haiti and 91
several populations that, together, encompassed most of a species’ altitudinal range (Fig. 93
1; Table 1). Anolis cybotes is found nearly island-wide; we sampled it at three elevations 94
in each of the two principal mountain chains, the Sierra de Baoruco (SB) and Cordillera 95
Central (CC). In the SB we sampled the mid-elevation species, A. strahmi and A. 96
whitemani, and the high elevation species, A. armouri. In the CC, we sampled the mid-97
elevation species A. marcanoi, and the high elevation species, A. shrevei. 98
We gathered climatic measurements for each locality by extracting all 99
temperature variables (bio 1 – bio 11; Supp. Table 1) from environmental layers available 100
in the WorldClim dataset (resolved to approximately 1km2; Hijmans et al. 2005). These 101
variables summarize seasonal and annual temperature trends. To account for collinearity 102
among thermal variables, we reduced data dimensionality using a principal components 103
(PC) analysis on the correlation matrix. 104
105
Measurement of physiological performance indices 106
We measured field body temperature, Tb, during one continuous 13-hour period
107
(0600 – 1900 hr) at 13 localities from 20 June to 31 July 2011. Due to logistical 108
constraints, one locality (A. shrevei – 1950 m) was sampled from 0600 - 13:45, but 109
results for that population are consistent with those from other populations (Table 1). 110
Following established methods (Huey 1974; Hertz 1992), we walked slowly through each 111
habitat and used a standard noose to capture adult male lizards, which are more 112
conspicuous and easier to sample than females. For every lizard, we recorded core 113
temperature (Tb) to the nearest 0.1ºC using a thermocouple (Type T, Copper-Constantan)
114
Each lizard was measured only once. Tb generally correlates closely with the optimal
116
performance temperature (Topt, the temperature at which organisms maximally perform a
117
function such as running) in many diurnal lizards, including tropical anoles (Huey et al. 118
2012). 119
For each lizard captured, we recorded the time, weather conditions (sunny, mixed, 120
or overcast skies), and “basking status” (basking in the full or filtered sun, perching in the 121
shade under sunny or mixed skies, or in the shade under overcast skies) following Hertz 122
(1992). For a statistical analysis of basking site choice, we removed observations for 123
lizards captured in overcast conditions, because these lizards did not have the opportunity 124
to choose between perching in the sun or in the shade. We tested for weather-dependent 125
basking choice using a logistic regression model such that individuals’ basking behaviour 126
(perching in shade = 0, perching in sun = 1) was evaluated as a function of elevation, 127
weather (sunny or mixed skies), and an elevation ! weather interaction. An effect of
128
elevation alone would indicate that certain basking behaviours are more likely to occur at 129
different elevations, whereas a significant interaction would indicate that active lizards 130
differ in how they exploit weather conditions at different elevations. 131
We measured the critical thermal minimum (CTmin) and maximum (CTmax), which
132
refer to the low and high temperatures at which an organism loses locomotor function; 133
these are widely used for measuring the tolerance limits of performance in ectotherms 134
(Spellerberg 1972; Lutterschmidt and Hutchison 1997). CTmin and CTmax are estimated as
135
the lower and upper temperatures at which a lizard fails to right itself when flipped onto 136
its back (Spellerberg 1972). After capture, we gave adult male lizards a 24-hour rest 137
near 23°C at all sites. To measure core temperature during the tolerance experiments, an 139
Omega temperature probe (Type T, 36 gauge) was placed approximately 1 cm into the 140
cloaca of each lizard and secured to the base of the tail using a small piece of surgical 141
tape, ensuring that tail movement was uncompromised. The temperature probe was 142
connected to a digital temperature logger (HH147U, Omega). The lizard was placed into 143
a perforated plastic container where it could move freely. After the lizard attained 144
ambient temperature, the container was moved to an insulated icebox coated with a layer 145
of crushed ice. Because the rate of temperature change during a tolerance experiment can 146
alter an organism’s performance (Terblanche et al. 2007), we reduced body temperature 147
at a constant rate of approximately 1˚C/min for all lizards. To conduct the experiment, we 148
reduced body temperature to 14˚C, at which point we flipped the lizard onto its back 149
using a pair of blunt tweezers and stimulated it to flip itself back over by gently probing 150
the base of its tail and pressing its thighs. If the lizard flipped over after 15 seconds, we 151
then lowered core temperature 0.5˚C and repeated this procedure, continuing until a 152
temperature was reached at which the lizard failed to right itself in the allotted time. 153
CTmin was recorded as the temperature at which the righting response was lost.
154
Animals were given 24 hours to rest in the ice chest before CTmax trials. The
155
method for estimating CTmax was similar to that of CTmin except that a 100 W light bulb
156
was suspended approximately 30 cm above the Tupperware. We placed lizards in a 157
Tupperware container and increased their core temperature at a rate of ~1˚C/min by 158
exposing them to the heat source. We began flipping lizards when they began to cool 159
described above, and recorded the temperature at which the righting response was lost as 161
CTmax.
162
Estimation of CTmin and CTmax is potentially confounded by the rate of
163
temperature change, body size, and starting conditions (Gaston and Spicer 1998; 164
Terblanche et al. 2007; Chown et al. 2009). We performed linear regressions with mean 165
population CTmin and CTmax as the dependent variables against the population means for
166
rate of temperature change, initial experimental temperature, and body mass (Supp. Table 167
2). We conducted separate analyses for each pair of dependent and independent variables, 168
and each regression was weighted by the variance in CTmin or CTmax. Because none of
169
these models were statistically significant (Supp. Table 3), we used raw CTmin and CTmax
170
values in subsequent analyses. 171
We compared physiological traits to thermal habitat (3 PC variables, see Results) 172
using population means and independent contrasts. We calculated standardized 173
independent contrasts (scaled by the expected variance) for the weighted species means 174
of each physiological trait (CTmin, Tb, and CTmax) and each of the thermal habitat
175
variables (PC I, PC II, PC III) using the pic function in the APE package (Felsenstein 176
1985; Paradis 2006) in R (R Development Core Team 2012). Although they are not 177
properties of the organisms, environmental traits may reflect underlying ecological traits 178
(Garland et al. 1992; Oufiero et al. 2011). We used the time-calibrated, majority rule 179
consensus tree of Mahler et al. (2010), with the topology generated using Bayesian 180
maximum clade credibility (Drummond and Rambaut 2007). This consensus tree 181
contains 187 of ~375 recognized species of anoles (all but 19 species of Caribbean 182
the origin to compare the contrasts for physiological traits with the contrasts for thermal 184
environment traits using the lmorigin function in APE (Paradis 2006). 185
186
Measuring rates of physiological trait evolution 187
To ensure comparability among traits, we used the fitContinuous function in the 188
GEIGER package (Harmon et al. 2008) in R to fit three different models of evolution to 189
each physiological trait. These models were: (1) Brownian Motion a random walk; (2) 190
Ornstein-Uhlenbeck, a random walk in which characters tend to return to a single 191
optimum; and (3) Early Burst, in which the overall rate of evolution exponentially slows 192
through time (Hansen 1997; Blomberg et al. 2003; Butler and King 2004; Freckleton and 193
Harvey 2006). We calculated the Akaike Information Criterion corrected for small 194
sample size (AICC; Sugihara 1978) for each model and compared the fits by examining
195
the Akaike weights (Burnham and Anderson 2002). 196
We used Adams’ (2013) method to evaluate whether the rate of evolutionary 197
change varied among physiological traits. This method compares a model that allows 198
rates to vary among traits to one in which the rates are constrained to be equal using a 199
likelihood ratio test and AICC. To account for intraspecific measurement error, we
200
incorporated the standard error of the mean in our estimation of rates of evolution. We 201
used the APE library (Paradis et al. 2004; Paradis 2012) and new code supplied by 202
Adams (2013) in R. 203
204
Because of the large differences in CTmin we discovered among populations (see
206
Results), we conducted an experiment to assess how short-term acclimation influences 207
variation in this trait. In June 2013, we collected adult male lizards from two populations 208
differing greatly in thermal environment– Anolis armouri (Loma de Toro, elevation = 209
2318 m; n = 18) and A. cybotes (Los Patos, elevation = 45 m; n = 19). Kolbe et al. (2012) 210
found that a two-week acclimation at 22.5˚C was sufficient to elicit a strong plastic 211
response in CTmin in a lowland population of A. cristatellus from Puerto Rico without
212
inducing severe thermal stress. We maintained lizards at 19.4˚C (range = 17.4˚C – 213
21.9˚C) for three weeks and measured CTmin following the procedure described above.
214
215
Night-time environmental temperature measurement 216
We measured night-time operative temperature (Te) in the same two,
thermally-217
contrasting, localities. Te refers to an organism’s equilibrium temperature in the absence
218
of metabolic heating or evaporative cooling (sensu Bakken 1992), which we estimated 219
using replicas made of electroformed copper. These models mimic the thermal properties 220
of a thermoconforming lizard (e.g., color, shape, size; Bakken and Gates 1975). We 221
embedded iButton® data loggers (DS1921K Maxim) in copper models shaped using a 222
mold of A. cybotes – this new generation of copper models permits automated 223
temperature recording (for details of their construction, see Bakken and Angilletta 224
[2013]). Methods for calibrating the copper models are given in the Supplemental 225
Materials. We deployed these models (12 on trees, 11 on rocks, and 11 under rocks) in 226
Los Patos (June 5 – 7, 2013) and in Loma de Toro (11 each on trees, on rocks, and under 227
rocks) June 14 – 16, 2013 with the devices set to automatically record Te at ten minute
intervals. We randomly selected perches, orientation, and height for model placement on 229
trees following Hertz (1992). In addition, we also recorded sleep site selection for lizards 230
at each of these localities during the experimental period. 231
232
Results 233
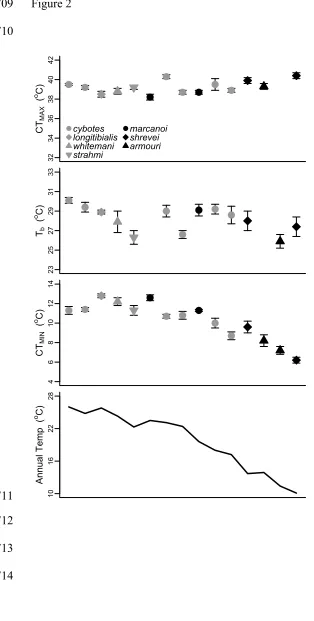
Thermal habitat varies markedly across Hispaniola 234
For this study, we visited various localities in the Dominican Republic that 235
spanned more than 2400 meters in altitude and a variety of habitats ranging from lowland 236
scrub to montane pine forests. Not surprisingly, sites varied considerably in temperature 237
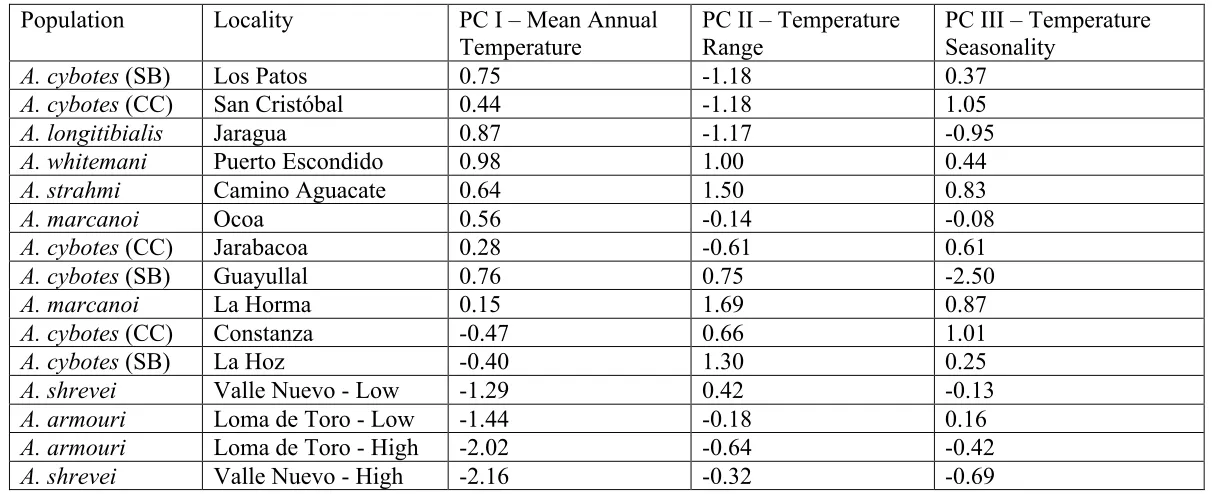
(Fig. 2). In the principal component analysis of the WorldClim thermal variables, we 238
recovered three axes with eigenvalues greater than 1 that together explained 99.6% of the 239
variation in the thermal data (Supp. Table 4 & 5). PC I (hereafter ‘Thermal PC I’) 240
explained 73.2% of the variation and loaded highly for mean annual temperature, mean 241
temperatures of the wettest and driest quarters, maximum temperature of the warmest 242
month, and minimum temperature of the coldest month. PC II (14.2% variation 243
explained; hereafter ‘Range PC II’) loaded highly for daily and annual temperature 244
ranges, whereas PC III (12.2% variation explained; ‘Seasonality PC III’ axis) loaded with 245
variables related to thermal seasonality. 246
247
Analyses of thermoregulation and physiology 248
In approximately 164 hours of field observations, we collected Tb from 435 lizards and
249
basking site data from 381 lizards. The extent of basking in the sun varied greatly at 250
different elevations (logistic interaction term; "2 = 4.07, df = 1, p = 0.044); lizards at
higher elevation were more likely to bask in the sun when it is available, whereas those at 252
lower elevation sought shade under sunny conditions. Neither CTmax nor Tb varied
253
significantly with any of the thermal habitat PC variables (Table 2). Tolerance to cold 254
(CTmin was positively correlated with Thermal PC I (r = 0.934, p < 0.001), which loaded
255
heavily with mean annual temperature, and this relationship remained significant after 256
phylogenetic correction (Table 2). 257
258
Evolutionary analyses of physiology 259
Brownian motion was the most strongly supported model for all three traits 260
(CTmin, Tb, and CTmax) – Akaike weights were > 0.93 in all cases (Supp. Table 6),
261
allowing for a comparison of evolutionary rates among traits. Likelihood ratio tests 262
indicated that, overall, the three physiological traits evolved at different rates, although 263
the differences were just above the significance threshold (p = 0.06) when intraspecific 264
measurement error was taken into account (Table 3). Pairwise comparisons showed that 265
rates of evolution for CTmin were significantly higher than for CTmax, even when
266
intraspecific measurement error was considered. However, differences in rates of 267
evolution between Tb and other traits were not significant in the analysis incorporating
268
intraspecific variation (Table 3), either because rates do not actually differ, or because 269
high variance in Tb obscures differences in rates of evolution.
270
271
Cold acclimation experiment 272
Mean CTmin was not significantly different between wild-measured (mean =
273
0.136). Mean CTmin remained the same (7.2˚C) between wild-measured and
cold-275
acclimated A. armouri. CTmin was significantly higher in A. cybotes than in A. armouri in
276
both the wild-measured (unpaired t-test: t = 7.72, p < 0.001) and cold-acclimated 277
treatments (t = 9.28, p < 0.001). 278
279
Night-time temperature experiment 280
Night-time operative temperatures (Te) showed marked differences between high
281
and low elevation (Fig. 3). At Los Patos (low elevation), Te ranged from 24.6 – 29.8˚C,
282
whereas at Loma de Toro Te (high elevation), it ranged from 10.9 – 18.1˚C. Te was on
283
average, though not always, somewhat higher under rocks than on top of rocks or on trees 284
(Fig. 3; Supp. Fig. 1), particularly early in the evening. All lizards at Los Patos were 285
observed sleeping on vegetation (43 observations), whereas lizards at Loma de Toro were 286
observed sleeping on vegetation (14/30) and underneath rocks (16/30) in roughly equal 287
numbers (test for differences in site selection among populations: "2 = 26.3, df = 1, p <
288
0.001). 289
290
Discussion 291
Thermoregulatory behaviour influences the rate of physiological evolution 292
The question of how behaviour influences patterns of physiological evolution 293
dates back to the middle of the last century (Cowles and Bogert 1944; Bogert 1949) and 294
has received renewed interest in light of concern about how ectothermic organisms can 295
respond to climate warming (Huey et al. 2009; Kearney et al. 2009). We studied a clade 296
cold montane environments. Despite occurring in environments that differ by as much as 298
15°C in mean annual temperature, field body temperature and heat tolerance were 299
remarkably similar among populations, indicating that behavioural thermoregulation can 300
be extraordinarily effective in limiting exposure to excessively hot or cold temperatures 301
(i.e. the ‘Bogert effect’; Huey et al. 2003). Our behavioural analysis demonstrates that 302
lowland lizards were more likely to retreat to the shade under sunny conditions, whereas 303
upland lizards were more likely to bask when the sun was out, a result in agreement with 304
previous work on three of these species (Hertz and Huey 1981). Our results are 305
particularly striking given that other anole species exhibit markedly different body 306
temperatures, even when they occur in sympatry (Ruibal 1961; Rand 1964; van Berkum 307
1986; Hertz et al. 2013, but see Huey and Webster 1976; Gunderson and Leal 2012). 308
Given the ability of cybotoids to thermoregulate to approximately the same 309
temperature throughout its range, it is not surprising that CTmax also shows very little
310
interspecific variation. However, these lizards have a much more limited ability to 311
thermoregulate at night, particularly at high elevation, where operative temperatures 312
measured on all types of sleep sites were so low that they would incapacitate 313
approximately 80% of lowland lizards (Fig. 3; Supp. Fig. 1). In the absence of thermal 314
refuges, populations have no option but to adapt physiologically. Indeed, we found that 315
none of the lizards from high elevation experienced night-time temperatures lower than 316
their CTmin (Fig. 3).
317
An alternative explanation for this finding is that differences in CTmin represent
318
non-genetic effects of living in different environments. Previous studies suggest that 319
(Janzen 1967): our data support this view, as cold tolerance exhibits little acclimation, 321
even less so than in other anoles (Kolbe et al. 2012), which suggests that there is likely a 322
genetic basis for the observed variation in CTMIN.
323
The inability of thermoregulation to buffer selection on physiology during the 324
night is an explanation for the fast rate of CTmin evolution in this clade (Table 3; Huey et
325
al. 2003). The relative stasis in CTmax documented here aligns with results from recent
326
meta-analyses showing that there is less variation in heat tolerance than in cold tolerance 327
in several ectotherm clades (Sunday et al. 2010; Araújo et al. 2013). In short, 328
behavioural thermoregulation allows cybotoid species to maintain similarly warm body 329
temperatures during the day, but not during the night, forcing species in montane 330
environments on Hispaniola to adapt to lower temperatures. 331
332
What limits heat tolerance evolution? 333
Behavioural thermoregulation can help explain why CTmax is less variable than
334
CTmin in the cybotoids, but not why the response to different environmental conditions
335
involved behavioural, rather than physiological, change. Given that time spent 336
thermoregulating imposes a cost with regard to its effect on other activities such as 337
foraging, predator avoidance, and reproduction (e.g., Huey 1974; Grant and Dunham 338
1988; Adolph and Porter 1993), it is unclear why selection should favour the maintenance 339
of high body temperatures in montane habitats, instead of physiological adaptation to 340
lower temperatures. One possibility is that behavioural modifications are easier to evolve 341
than changes in physiological tolerances (Mayr 1963; West-Eberhard 2003). Given that a 342
temperature, the evolution of physiological tolerances may necessitate the concerted 344
evolution of many genes (discussed in Angilletta 2009; Huey 2009). In contrast, shifts in 345
basking frequency change seasonally within populations, and so behavioural shifts at 346
different elevations may not require substantial evolutionary change. Moreover, even if 347
evolutionary shifts in behaviour are required, such changes may require fewer genetic 348
changes than shifts in physiology (Blomberg et al. 2003). 349
This “evolution along lines of least genetic resistance” (sensu Schluter 1996) 350
explanation suggests that there is no inherent advantage to warmer body temperatures, 351
but an alternative explanation for the lack of evolutionary variability in CTmax revolves
352
around the fitness benefits of high temperatures. Specifically, selection may favour the 353
maintenance of high body temperatures in cold environments because rates of 354
biochemical reactions increase with optimal temperature (Bennett 1987; Huey and 355
Kingsolver 1989; Huey 2009). Indeed, warm-adapted ectotherms generally experience 356
higher levels of physiological performance than cold-adapted organisms (Savage et al. 357
2004; Angilletta et al. 2010). However, if this “hotter is better” hypothesis is true, it still 358
fails to address why low elevation populations have not evolved even higher heat 359
tolerances. 360
361
Impacts of climate change 362
Climate warming will likely have different effects on cybotoids from lowland and 363
upland habitats. Warming temperatures threaten to make current ranges thermally 364
inhospitable for many cool-adapted montane ectotherms, which may force their ranges 365
will benefit, at least in the short term, from climate warming. As the climate warms, 367
environmental temperatures will more often approximate lizards’ preferred temperatures, 368
and thus the time lizards need to spend thermoregulating should decrease and the number 369
of hours available for other activities should increase; on the other hand, higher 370
temperatures may allow species from lower elevations to migrate upward, leading to 371
negative interspecific interactions (Huey et al. 2009). 372
The challenge facing lowland cybotoids will be to avoid stressfully hot 373
temperatures as habitats continue to warm. Many tropical lizards, particularly those near 374
sea level, are already frequently experiencing temperatures exceeding their preferred 375
ranges (e.g., Huey et al. 2009; Sinervo et al. 2010). As warming continues, lizards in such 376
lowland populations will eventually be unable to maintain temperatures within their 377
preferred range for long enough periods to survive. At that point, lowland populations 378
can only avoid local extinction by shifting their physiology to adapt to these higher 379
environmental temperatures. 380
Evolutionary stasis in CTmax may suggest a limited ability to evolve and, thus, a
381
heightened vulnerability to environmental warming. Some studies on Drosophila support 382
the idea that heat tolerance evolution is genetically constrained, as the amount of genetic 383
diversity for heat tolerance is limited compared to that for cold tolerance (Hoffmann et al. 384
2003, 2012; Ragland and Kingsolver 2008). The observation that CTmin evolves readily in
385
cybotoids and in other ectotherms (Barrett et al. 2010; Leal and Gunderson 2012) would 386
tend to support this hypothesis. Nonetheless, it is hard to construe why diverse 387
physiological systems would be constrained from evolving upper, but not lower 388
(Donaldson and Olson 1957) have demonstrated that heat tolerance can increase in 390
response to selection, although there appears to be an upper ceiling on how high heat 391
tolerance can evolve (Hamilton 1973); no similar experiments have ever been conducted 392
on vertebrates. Moreover, although cybotoid anoles show relatively little variation in heat 393
sensitivity, some other anole clades have diversified extensively while adapting to 394
different thermal environments (Hertz et al. 2013). Looking more broadly, other lizard 395
species possess heat tolerances that approach 50°C (reviewed in Sunday et al. 2010; 396
Araújo et al. 2013), suggesting that if genetic constraints exist in lizards, they are 397
phylogenetically localized. Finding an explanation for variation among clades in 398
physiological diversity could aid in assessing ectotherms’ vulnerability to climate 399
warming, but it is a challenge that will require integration of physiological, behavioural, 400
and evolutionary approaches. 401
402
Acknowledgments 403
We thank O. Baez-Landestoy and R. Castañeda for field assistance, the Ministerio de 404
Medio Ambiente y Recursos Naturales and the Museo Nacional de Historia Natural in the 405
Dominican Republic for granting our research permit requests, and P. Hertz, S. Lambert, 406
J. Lawrence, M. Stute, and Y. Stuart for helpful feedback on this project and manuscript. 407
We thank three reviewers for greatly improving this manuscript. Financial support was 408
provided by a National Science Foundation Grant (DEB: Award No. 0918975) to JBL, an 409
NSF Graduate Research Fellowship to MMM, a Putnam Expedition Grant to MMM, and 410
a Craig Family Award to MAS. 411
Works Cited 413
Adams, D.C. 2013. Comparing evolutionary rates for different phenotypic traits on a 414
phylogeny using likelihood. Syst. Biol. 62, 181—192. 415
416
Adolph, S.C., and Porter, W.P. 1993. Temperature, activity, and lizard life histories. Am. 417
Nat. 142, 273—295. 418
419
Angilletta Jr, M.J. 2009. Thermal Adaptation: A Theoretical and Empirical Synthesis. 420
Oxford, UK: Oxford University Press. 421
422
Angilletta Jr, M.J., Huey, R.B., and Frazier, M.R. 2010. Thermodynamic effects on 423
organismal performance: Is hotter better? Physiol. Biochem. Zool. 83, 197—206. 424
425
Araújo, M.B., Ferri-Yáñez, F., Bozinovic, F., Marquet, P.A., Valladares, F., and Chown, 426
S.L. 2013. Heat freezes niche evolution. Ecol. Lett. 16, 1206—1219. 427
428
Bakken, G.S. 1992. Measurement and application of operative and standard operative 429
temperatures in ecology. Am. Zool. 32, 194—216. 430
431
Bakken, G.S., and Angilletta, M.J. 2013. How to avoid errors when quantifying thermal 432
environments. Funct. Ecol. in press 433
434
implications for field ecology, physiology, and evolution. In Perspectives of Biophysical 436
Ecology (eds D.M. Gates and R.B. Schmerl), pp. 255—290. New York: Springer-Verlag. 437
438
Barrett, R.D.H., Paccard, A., Healy, T.M., Bergek, S., Schulte, P.M., Schluter, D., and 439
Rogers, S.M. 2010. Rapid evolution of cold tolerance in stickleback. Proc. R. Soc. B 278, 440
233—238. 441
442
Bennett, A.F. 1987. Evolution of the control of body temperature: Is warmer better?, In 443
Comparative Physiology: Life in the water and on land (eds P. Dejours, L. Bolis, C.R. 444
Taylor, and E.R. Weibel), pp. 421—431. Padova: Liviana Press. 445
446
Blomberg, S.P., Garland Jr., T., and Ives, A.R. 2003. Testing for phylogenetic 447
signal in comparative data: behvioural traits are more labile. Evolution 57, 717—745. 448
449
Bogert, C.M. 1949. Thermoregulation in reptiles, a factor in evolution. Evolution 3, 450
195—211. 451
452
Burnham, K.P., and Anderson, D.R. 2002. Model selection and multimode inference: a 453
practical information-theoretic approach. New York: Springer-Verlag. 454
455
Butler, M. A., and King, A.A. 2004. Phylogenetic comparative analysis: a modeling 456
approach for adaptive evolution. Amer. Nat. 164, 683—695. 457
Chen, I.C., Hill, J.K., Ohlemüller, R., Roy, D.B., and Thomas, C.D. 2011. Rapid range 459
shifts of species associated with high levels of climate warming. Science 333, 1024— 460
1026. 461
462
Chown, S.L., Jumbam, K.R., Sørensen, J.G., and Terblanche, J.S. 2009. Phenotypic 463
variance, plasticity and heritability estimates of critical thermal limits depend on 464
methodological context. Funct. Ecol. 23, 133—140. 465
466
Cowles, R.B. and Bogert, C.M. 1944. A preliminary study of the thermal requirements of 467
desert reptiles. B. Am. Mus. Nat. Hist. 83, 265—296. 468
469
Deutsch, C.A., Tewksbury, J.J., Huey, R.B., Sheldon, K.S., Ghalambor, C.K., Haak,
470
D.C., and Martin P.R. 2008. Impacts of climate warming on terrestrial ectotherms across
471
latitude. Proc. Natl. Acad. Sci. USA 105, 6668—6672.
472
473
Donaldson, L.R., and Olson, P.R. 1957. Development of rainbow trout brood stock by
474
selective breeding. Trans. Am. Fish. Soc. 85, 93—101.
475
476
Drummond, A.J., and Rambaut, A. 2007. BEAST: Bayesian evolutionary analysis by 477
sampling trees. BMC Evol. Biol. 7, 214. 478
479
Felsenstein, J. 1985. Phylogenies and the comparative method. Am. Nat. 125, 1—15. 480
Freckleton, R.P., and Harvey, P.H. 2006. Detecting non-Brownian trait evolution in 482
adaptive radiations. PLoS Biology 4, e373. 483
484
Garland, Jr., T., Harvey, P.H., and Ives, A.R. 1992. Procedures for the analysis of 485
comparative data using phylogenetically independent contrasts. Syst. Bio. 41, 18—32. 486
487
Gaston, K.J., and Spicer, J.I. 1998. Do upper thermal tolerances differ in geographically 488
separated populations of the beachflea Orchestia gammarelllus (Custacea: Amphipoda)? 489
J. Exp. Mar. Biol. Ecol. 229, 265—276. 490
491
Ghalambor, C.K., Huey, R.B., Martin, P.R., Tewksbury, J.J., and Wang, G. 2006. Are 492
mountain passes higher in the tropics? Janzen’s hypothesis revisited. Integr. Comp. Biol. 493
46, 5—17. 494
495
Gilchrist, G.W., and Huey, R.B. 1999. The direct response of Drosophila melanogaster 496
to selection on knock-down temperature. Heredity 83, 15—29. 497
498
Glor, R.E., Kolbe, J.J., Powell, R., Larson, A., and Losos, J.B. 2003. Phylogenetic 499
analysis of ecological and morphological diversification in Hispaniolan trunk-ground 500
anoles (Anolis cybotes group). Evolution 57, 2383—2397. 501
502
Grant, B.W., and Dunham, A.E. 1988. Thermally imposed time constraints on the activity 503
505
Gunderson, A.R., and Leal, M. 2012. Geographic variation in vulnerability to climate 506
warming in a tropical Caribbean lizard. Funct. Ecol. 26, 783—793. 507
508
Hamilton, W.J., III. 1973. Life's color code. New York: McGraw Hill. 509
510
Hansen, T.F. 1997. Stabilizing selection and the comparative analysis of adaptation. 511
Evolution 51, 1341—1351. 512
513
Harmon, L. J., Weir, J.T., Brock, C., Glor, R.E., and Challenger, W. 2008. GEIGER: 514
investigating evolutionary radiations. Bioinformatics 24, 129—131. 515
516
Henderson, R.W. and Powell, R. 2009. Natural History of West Indian Reptiles and 517
Amphibians. Gainesville: University Press of Florida. 518
519
Hertz, P.E. 1992. Temperature regulation in Puerto Rican Anolis lizards: a field test using 520
null hypotheses. Ecology 73, 1405—1417. 521
522
Hertz, P.E., Arce-Hernandez, A., Ramirez-Vazquez, J., Tirado-Rivera, W., and Vazquez-523
Vives, L. 1979. Geographical variation of heat sensitivity and water loss rates in the 524
tropical lizard Anolis gundlachi. Comp. Biochem. Phys. A 62, 947—953. 525
Hertz, P.E., Arima, Y., Harrison, A., Huey, R.B., Losos, J.B., and Glor, R.E. 2013. 527
Asynchronous evolution of physiology and morphology in Anolis lizards. Evolution 677, 528
2101—2113. 529
530
Hertz, P.E., and Huey, R.B. 1981. Compensation for altitudinal changes in the thermal 531
environment by some Anolis lizards on Hispaniola. Ecology 62, 515—521. 532
533
Hijmans, R.J., Cameron, S.E., Parra, J.L., Jones, P.G., and Jarvis, A. 2005. Very high 534
resolution interpolated climate surfaces for global land areas. Int. J. Climatol. 25, 1965— 535
1978. 536
537
Hoffmann, A.A., Chown, S.L, and Clusella-Trullas, S. 2012. Upper thermal limits in 538
terrestrial ectotherms: how constrained are they? Functional Ecology 27, 934—949. 539
540
Hoffmann, A.A., Sorensen, J.G., and Loeschcke, V. 2003. Adaptation of Drosophila to 541
temperature extremes: bringing together quantitative and molecular approaches. J. 542
Therm. Biol. 28, 175—216. 543
544
Huey, R.B. 1974. Behvioural thermoregulation in lizards: importance of associated costs. 545
Science 184, 1001—1003. 546
547
Huey, R.B. 2009. Evolutionary physiology of insect thermal adaptation to cold 548
Jr.), Cambridge University Press, Cambridge, U.K. 550
551
Huey, R.B., Deutsch, C.A., Tewksbury, J.J., Vitt, L.J., Hertz, P.E., Álvarez Pérez, H.J., 552
and Garland, Jr., T. 2009. Why tropical forest lizards are vulnerable to climate warming. 553
P. Roy. Soc. B-Biol. Sci. 276, 1939—1948. 554
555
Huey, R.B., Hertz, P.E., and Sinervo, B. 2003. Behvioural drive versus behvioural inertia 556
in evolution: A null model approach. Am. Nat. 161, 357—366. 557
558
Huey, R.B., Kearney, M.R., Krockenberger, A., Holtum, J.A.M., Jess, M., and Williams, 559
S.E. 2012. Predicting organismal vulnerability to climate warming: roles of behaviour, 560
physiology, and adaptation. Philos. T. Roy. Soc. B 367, 1665—1679. 561
562
Huey, R.B. and Kingsolver, J.G. 1989. Evolution of thermal sensitivity of ectotherm 563
performance. Trends Ecol. Evol. 4, 131—135. 564
565
Huey, R.B. and Webster, T.P. 1976. Thermal biology of Anolis lizards in a complex 566
fauna: the cristatellus group on Puerto Rico. Ecology 57, 985—994. 567
568
Janzen, D.H. 1967. Why are mountain passes higher in the tropics? Am. Nat. 101, 233— 569
249. 570
Kearney, M., Shine, R., and Porter, W.P. 2009. The potential for behavioural 572
thermoregulation to buffer ‘cold-blooded’ animals against climate warming. Proc. Natl. 573
Acad. Sci. USA 106, 3835—3840.
574
575
Kembel, S.W., Cowan, P.D., Helmus, M.R., Cornwell, W.K., Morlon, H., Ackerly, D.D., 576
Blomberg, S.P., and Webb, C.O. 2010. Picante: R tools for integrating phylogenies and 577
ecology. Bioinformatics 26:1463—1464. 578
579
Kolbe, J.J., VanMiddlesworth, P.S., Losin, N., Dappen, N., and Losos, J.B. 2012. 580
Climatic niche shift predicts thermal trait response in one but not both introductions of 581
the Puerto Rican lizard Anolis cristatellus to Miami, Florida, USA. Ecol. Evol. 2, 1503— 582
1516. 583
584
Leal, M., and Gunderson, A.R. 2012. Rapid change in the thermal tolerance of a tropical 585
lizard. Am. Nat. 180, 815—822. 586
587
Lutterschmidt, W.I., and Hutchison, V.H. 1997. The critical thermal maximum: history 588
and critique. Can. J. Zoolog. 75, 1561—1574. 589
590
Mahler, D.L., Revell, L.J., Glor, R.E., and Losos, J.B. 2010. Ecological opportunity and 591
the rate of morphological evolution in the diversification of Greater Antillean anoles. 592
Evolution 64, 2731—2745. 593
Mayr, E. 1963. Animal Species and Evolution. Cambridge, MA: The Belknap Press of 595
Harvard University Press. 596
597
Oufiero, C.E., Gartner, G.E.A., Adolph, S.C., and Garland, Jr., T. 2011. Latitudinal and 598
climatic variation in body size and dorsal scale counts in Sceloporus lizards: A 599
phylogenetic perspective. Evolution 65, 3590—3607. 600
601
Parmesan C. 2006. Ecological and evolutionary responses to recent climate change. 602
Annu. Rev. Ecol. Syst. S 37, 637—669. 603
604
Paradis, E. 2006. Analysis of phylogenetics and evolution with R. New York: Springer. 605
606
Paradis E. 2012. Analyses of phylogenetics and evolution with R. New York: Springer. 607
608
Paradis E., Claude J., Strimmer K. 2004. APE: analyses of phylogenetics and evolution in 609
R language. Bioinformatics 20, 289—290. 610
611
R Development Core Team 2012. R: a language and environment for statistical 612
computing. Vienna, Austria: R Foundation for Statistical Computing. 613
614
Ragland, G.J., and Kinsolver, J.G. 2008. Evolution of thermotolerance in seasonal 615
environments: the effects of annual temperature variation and life-history timing in 616
618
Rand, A.S. 1964. Ecological distribution in anoline lizards of Puerto Rico. Ecology 45, 619
745—752. 620
621
Ruibal, R. 1961. Thermal relations of five species of tropical lizards. Evolution 15, 98— 622
111. 623
624
Sarmiento, G. 1986. Ecological features of climate in high tropical mountains. In High
625
altitude tropical biogeography (eds F. Vuilleumier and M. Monasterio), pp. 11—46. New
626
York: Oxford University Press.
627
628
Savage, V.M., Gillooly, J.F., Brown, J.H., West, G.B., and Charnove, E.L. 2004. Effects
629
of body size and temperature on population growth. Am. Nat., 163, 429—441.
630
631
Schluter, D. 1996. Adaptive radiation along genetic lines of least resistance. Evolution 632
50, 1766—1774. 633
634
Schwartz, A. 1989. A review of the cybotoid anoles (Reptilia: Sauria: Iguanidae) from 635
Hispaniola. Milwaukee Public Mus. Contrib. Biol. and Geol. 78, 1—32. 636
637
Sinervo, B., Méndez-De-La-Cruz, F., Miles, D.B., Heulin, B., Bastiaans, E., Cruz, M.V.-638
S., Lara-Resendiz, R., Martínez-Méndez, N., Calderón-Espinosa, M.L., Meza-Lázaro, 639
C.F.D., Ibargüengoytía, N., Puntriano, C.A., Massot, M., Lepetz, V., Oksanen, T.A., 641
Chapple, D.A., Bauer, A.M., Branch, W.R., Clobert, J., and Sites, J.W. 2010. Erosion of 642
lizard diversity by climate change and altered thermal niches. Science, 328, 894—899. 643
644
Spellerberg, I.F. 1972. Temperature tolerances of southeast Australian reptiles examined 645
in relation to reptile thermoregulatory behaviour and distribution. Oecologia 9, 23—46. 646
647
Stevenson, R. D. 1985. The relative importance of behvioural and physiological 648
adjustments controlling body temperature in terrestrial ectotherms. Am. Nat. 126, 362— 649
386. 650
651
Sugihara, N. 1978. Further analysis of the data by Akaike’s information criterion and the 652
finite corrections. Comm. Stat. Theory Methods A7, 13—26. 653
654
Sunday, J.M., Bates, A.E., and Dulvy, N.K. 2010. Global analysis of thermal tolerance 655
and latitude in ectotherms. Proc. R. Soc.B 278, 1823—1830. 656
657
Terblanche, J.S., Deere, J.A., Clusella-Trullas, S., Janion, C., and Chown, S.L. 2007. 658
Critical thermal limits depend on methodological context. P. Roy. Soc. B-Biol. Sci. 274, 659
2935—2942. 660
661
van Berkum, F.H. 1986. Evolutionary patterns of thermal sensitivity of sprint speed in 662
664
West-Eberhard, M. 2003. Developmental Plasticity and Evolution. New York: Oxford 665
University Press. 666
667
Williams, S. E., Shoo, L. P., Isaac, J. L., Hoffmann, A. A., and Langham, G. 2008. 668
Towards an integrated framework for assessing the vulnerability of species to climate 669
change. PLoS Biol. 6, 2621—2626. 670
671
Williams, E.E. 1963. Anolis whitemani, new species from Hispaniola (Sauria, Iguanidae). 672
Breviora 197, 1—8. 673
674
Wollenberg, K.C., Wang, I.J., Glor, R.E., and Losos, J.B. 2013. Determinism in the 675
diversification of Hispaniolan trunk-ground anoles (Anolis cybotes species complex). 676
Evolution, in press 677
678
Tables.
Species Locality Alt (m) CTMIN Û& TB Û& CTMAX Û& Wild-Measured
A. cybotes (SB) Los Patos 45 11.3±0.4 (16) 30.1±0.3 (45) 39.5±0.1 (20) A. cybotes (CC) San Cristóbal 56 11.4±0.2 (16) 29.4±0.5 (53) 39.2±0.2 (16) A. longitibialis Jaragua 105 12.8±0.2 (18) 28.9±0.2
(101)
38.5±0.3 (18)
A. whitemani Puerto Escondido 411 12.2±0.4 (15) 27.9±1.1 (17) 38.8±0.3 (15) A.strahmi Camino Aguacate 454 11.3±0.5 (6) 26.3±0.7 (7) 39.2±0.2 (6)
A. marcanoi Ocoa 458 12.6±0.3 (9) - 38.2±0.3 (9)
A. cybotes (CC) Jarabacoa 690 10.7±0.2 (18) 29.0±0.6 (39) 40.3±0.2 (18) A. cybotes (SB) Guayullal 727 10.8±0.4 (15) 26.6±0.4 (53) 38.7±0.2 (15) A. marcanoi La Horma 879 11.3±0.1 (16) 29.1±0.6 (48) 38.7±0.2 (16) A. cybotes (CC) Constanza 1390 10.0±0.5 (11) 29.2±0.5 (10) 39.5±0.6 (11) A. cybotes (SB) La Hoz 1395 8.7±0.4 (9) 28.6±0.9 (11) 38.9±0.2 (9) A.shrevei Valle Nuevo -
Low
1950 9.6±0.6 (9) 28.0±1.0 (10) 39.9±0.3 (9)
A. armouri Loma de Toro - Low
2020 8.2±0.6 (9) - 39.3±0.3 (9)
A. armouri Loma de Toro - High
2318 7.2±0.4 (12) 25.9±0.7 (21) -
A.shrevei Valle Nuevo - High
2450 6.2±0.3 (11) 27.4±1.0 (20) 40.4±0.3 (11)
Cold Acclimated
A. cybotes Los Patos 45 10.6±0.3 (19) - -
A. armouri Loma de Toro - High
[image:31.792.50.537.76.426.2]2318 7.2±0.3 (18) - -
Table 1. Locality name, species sampled, and altitude (m) are given. Mean critical thermal minimum (CTMIN), body temperature (TB),
midday body temperature (midday TB), and critical thermal maximum (CTMAX) are given for each population. Units for physiological
(A) Populations (B) Contrasts
Reg. Coeff. PearsoQ¶Vr p Reg. Coeff. 3HDUVRQ¶Vr p
C TM I N (13, 5)
PC I / Mean Annual Temperature 1.87 0.934 <0.001 1.56 0.973 0.001
PC II / Temperature Range -0.20 0.022 0.755 0.05 0.032 0.951
PC III / Seasonality 0.46 0.140 0.503 0.38 0.132 0.790
TB (11, 5)
PC I / Mean Annual Temperature 0.52 0.363 0.142 0.78 0.637 0.143
PC II / Temperature Range -0.35 -0.296 0.341 -0.48 -0.421 0.460
PC III / Seasonality 0.68 0.479 0.054 -0.73 -0.381 0.464
C TM A X (12, 5)
PC I / Mean Annual Temperature -0.29 -0.618 0.110 -0.24 0.186 0.204
PC II / Temperature Range -0.16 -0.228 0.300 0.13 0.881 0.672
[image:32.792.90.640.67.251.2]PC III / Seasonality 0.13 0.193 0.524 0.03 0.865 0.957
Table 2. Results from linear regressions assessing the relationship between physiological traits (critical thermal minimum, CTMIN;
mean body temperature, TB; and critical thermal maximum, CTMAX) and thermal environment (PC I / Mean Annual Temperature, PC
A. Full Analysis
Trait V2 Uncorrected Corrected
CTMIN 10.60 AICC (OBS) = 167.3 AICC (OBS) = 171.7
TB 6.36 AICC (CONS) = 175.8 AICC (CONS) = 173.2
CTMAX 0.78 LRTdf=2 = 12.56, p = 0.002 LRTdf=2 = 5.57, p = 0.06
B. Pairwise Analysis
Comparison Uncorrected LRTdf=1; p Corrected LRTdf=1; p CTMIN vs CTMAX 12.40; < 0.001 7.85; 0.005
CTMIN vs TB 0.87; 0.350 0.32; 0.574
CTMAX vs TB 6.86; 0.009 -4.70; 1.00
Table 3. Comparison of evolutionary rates for CTMIN, TB, and CTMAX. (A) Presents the full analysis of evoluationary rates (V2)
incorporating covariation among all three traits. One test accounted for intraspecific measurement error (Corrected), while the other did not (Uncorrected). AICC scores for a model that allows rates to vary (observed) among traits and a model that constrains rates of
Figure Legends. 680
Figure 1. Map showing altitudinal variation and the localities for each cybotoid 681
population sampled in this study. The map inset shows the location of Hispaniola with 682
respect to the other islands in the Caribbean basin. Grayscale indicates elevation and 683
range from dark (low) to light (high) elevation. Species are denoted in different color 684
triangles in the phylogeny generated based on Mahler et al. (2010) (See Methods). 685
686
Figure 2. Population means (± 1 SEM) are given for critical thermal maximum (CTMAX),
687
body temperature (Tb), and critical thermal minimum (CTMIN). The mean annual
688
temperature for each locality is provided in the bottom panel. The x-axis denotes 689
elevation rank for each population. Species are denoted in different colours and shapes. 690
691
Figure 3. (A) Box plots showing the variation in operative temperatures during 1-hour 692
time blocks. Each time block summarizes temperatures collected over three consecutive 693
nights in June 2013 at low elevation (45 m) and high elevation (2318 m). Color denotes 694
the type of perch where the temperature was measured as follows: on a tree – white; on 695
top of a rock – light gray; underneath a rock – dark gray. (B) CTmin measured in
696
individuals of A. cybotes (left) and A. armouri (right) from the same localities in part (A) 697
are given. 698
699
Supplemental Figure 1. Operative temperatures measured at high elevation (2318 m) and 700
low elevation (45 m) on each type of perch: trees (green); on top of rocks (gray); and 701
Figure 1 703
704
705
706
707
708
!
)
!
)
G
F
G
F
G
F
G
F
G
F
G
F
!
/
#
0
#
0
X
Y
X
Y
!
.
[
"
¯
0 50 100
km
marcanoi
strahmi longitibialis shrevei cybotes armouri whitemani
3000 m
0 m
#
0
!
.
!
/
X
Y
G
F
!
)
[
[image:35.612.69.520.144.434.2]Figure 2 709
710
711
712
713
714
32
34
36
38
40
42
C
TM
A
X
(
o C)
cybotes
longitibialis whitemani
strahmi
marcanoi
shrevei armouri
Tb
(
o C)
23
25
27
29
31
33
4
6
8
10
12
14
C
TM
IN
(
o C)
Annual Temp
(
o C)
10
16
22
[image:36.612.59.373.76.697.2]Figure 3 715
716
717
718
2000 -2100 2100 -2200
2200
-2300 2300 -0000 0000 -0100 0100 -0200 0200 -0300 0300 -0400 0400 -0500 0500 -0600 !
"# "! $# $! %#
&'()'
*+,-*'./012
...345...6789
&7('...1&(7:
;...<
Low (45 m)
High (2318 m)
Device placement:
= on trees; = on top of rocks; = under rocks
[image:37.612.67.496.123.375.2]Supp Figure 1 719
720
721
722
723
!"#$
%&'''%%%%%%%%%%%&(''%%%%%%%%%%%%%'&('%%%%%%%%%%')''%%%%%%&'''%%%%%%%%%%&(''%%%%%%%%%%%%%'&('%%%%%%%%%%')''%%%%%&'''%%%%%%%%%%&(''%%%%%%%%%%%%%'&('%%%%%%%%%%%')''%%%%
*$+",$-%./0,$1%23%45$$-%%%%%%%%%%%%%%%%%%%%%%%%%%%%%%%%%%%%*$+",$-%./0,$1%23%52,6-%
%%%%%%%%%%%%%%%%%%%%%%%%%%%%%%*$+",$-%./0,$1%731$5%52,6-8 9' 98 &' &8 ('
!$#.$
Species Coordinates Alt (m) bio 1 bio 2 bio 3 bio 4 bio 5 bio 6 bio 7 bio 8 bio 9 bio 10 bio 11
A. cybotes (SB) 17.96, -71.19 45 26.0 9.9 0.76 1.03 32.2 19.3 12.9 26.8 24.6 27.2 24.5 A. cybotes (CC) 18.43, -70.13 56 24.8 10.1 0.77 0.94 30.9 17.9 13.0 25.7 23.6 25.9 23.4 A. longitibialis 17.80, -71.45 105 25.8 9.9 0.73 1.10 32.3 18.9 13.4 26.9 24.5 27.2 24.3 A. whitemani 18.32, -71.57 411 24.3 12.3 0.76 1.13 31.9 15.9 16.0 25.3 22.7 25.6 22.7 A. strahmi 18.35, -71.63 454 22.3 12.9 0.77 1.18 30.0 13.3 16.7 23.3 20.6 23.6 20.6 A. marcanoi 18.55, -70.50 458 23.5 11.1 0.75 1.13 30.6 15.9 14.7 24.5 21.8 24.7 21.8 A. cybotes (CC) 19.10, -70.61 690 23.1 10.8 0.76 1.01 29.6 15.5 14.1 24.1 21.6 24.2 21.6 A. cybotes (SB) 18.06, -71.14 727 22.4 11.7 0.71 1.48 30.3 14.0 16.3 21.9 20.5 24.0 20.2 A. marcanoi 18.65, -70.54 879 19.6 13.3 0.77 1.20 27.7 10.5 17.2 20.6 18.1 20.9 17.8 A. cybotes (CC) 18.86, -70.73 1390 18.0 12.4 0.77 1.12 25.4 9.3 16.1 19.0 16.4 19.2 16.4 A. cybotes (SB) 18.18, -71.28 1395 17.2 13.0 0.76 1.29 25.1 8.2 16.9 17.7 15.5 18.6 15.3 A. shrevei 18.84, -70.70 1950 13.7 12.3 0.75 1.28 21.4 5.1 16.3 14.7 12.0 15.1 11.9 A. armouri 18.30, -71.70 2020 13.9 11.8 0.75 1.16 21.1 5.4 15.7 14.9 12.2 15.2 12.2 A. armouri 18.29, -71.71 2318 11.4 11.4 0.74 1.23 18.5 3.1 15.4 12.5 9.6 12.7 9.6 A. shrevei 18.73, -70.60 2450 10.1 11.7 0.74 1.35 17.5 1.8 15.7 11.4 8.4 11.6 8.2
Supplemental Table 1. Coordinates and altitude are given for each population sampled. Mountain chain for Anolis cybotes is given as SB (Sierra de Baoruco, West) and CC (Cordillera Central, East). Thermal variables were extracted from the WorldClim database (Hijmans et al. 2005) and are given for each of the sampling localities, with codes (bio 1 – bio 11) as defined in Supp. Table 1. Bioclimatic variables extracted from the WorldClim database are as follows – bio 1: Mean Annual Temperature (MAT); bio 2: mean diurnal range; bio 3: isothermality; bio 4: temperature seasonality; bio 5: maximum temperature of the warmest month; bio 6:
Species Locality CTMIN CTMAX
Start Temp. (ºC) Cooling Rate (ºC/min)
Body Mass (g) Start Temp. (ºC) Heating Rate (ºC/min)
Body Mass (g)
A. cybotes (W) Los Patos 26.7±0.9 (20) 0.99±0.01 (16) 7.42± 1.23 (19) 27.8±0.3 0.86±0.00 7.15±1.25
A. cybotes (E) San Cristóbal 24.8±0.3 (16) 0.92±0.00 6.74±1.60 26.5±0.6 0.90±0.01 6.34±1.20
A. longitibialis Jaragua 26.8±2.7 (18) 1.00±0.01 7.48±0.37 31.1±0.7 0.82±0.01 7.42±0.37
A. whitemani Puerto Escondido 27.0±0.2 (15) 0.94±0.00 4.66±0.54 29.1±0.4 0.92±0.00 4.66±0.54
A. strahmi Camino Aguacate 27.3±0.9 (6) 0.93±0.01 6.92±0.75 29.6±0.4 0.99±0.01 6.92±0.75
A. marcanoi Ocoa 26.9±0.1 (9) 0.90±0.00 3.42±0.84 28.4±0.3 0.98±0.00 3.42±0.84
A. cybotes (E) Jarabacoa 29.2±0.5 (18) 1.04±0.00 6.52±0.65 29.5±0.2 0.88±0.01 6.16±0.53
A. cybotes (W) Guayullal 24.9±1.1 (18) 0.96±0.01 (16) 9.07± 1.37 (16) 28.2±0.3 0.86±0.01 (15) 8.45±1.62
A. marcanoi La Horma 25.7±0.5 (16) 0.87±0.01 4.22±0.32 28.9±0.3 0.86±0.00 4.22±0.32
A. cybotes (E) Constanza 24.6±0.5 (11) 0.97±0.01 4.95±1.11 24.8±0.3 0.98±0.01 4.65±1.15
A. cybotes (W) La Hoz 27.7±0.3 (9) 0.92±0.00 6.84±2.25 30.8±0.1 0.86±0.00 (8) 6.02±3.24
A. shrevei Valle Nuevo - Low 24.6±0.4 (9) 0.79±0.01 4.62±0.33 26.8±0.4 0.99±0.00 4.31±0.36
A. armouri Loma de Toro - Low 24.4±0.8 (9) 0.94±0.02 5.82±1.29 26.8±1.1 0.98±0.00 5.23±1.81
A. armouri Loma de Toro - High 29.7±0.2 (12) 0.93±0.00 6.43±1.86 - - -
A. shrevei Valle Nuevo - High 26.6±0.8 (11) 0.84±0.01 4.79±0.07 28.5±0.1 0.76±0.01 4.46±0.07
Supplemental Table 2. Mean start temperature (˚C), rate of temperature change (˚C/min), and lizard body mass (g) are given for each
population for CTMIN and CTMAX experiments. Values are mean ±1 SEM and sample sizes are given in parentheses. Only sample sizes
Supplemental Table 3: Summary of results from linear regression assessing the relationship between mean population (A) critical thermal minimum, CTMIN, and (B) critical thermal maximum, CTMAX, and several variables - start temperature, body mass, and rate of temperature change. Regressions were weighted by the variance in CTMIN and CTMIN.
A. CTMIN Reg. Coeff. df t Pearson’s r p Start Temperature -0.21 13 -0.57 -0.107 0.578
Mass -0.03 13 0.09 0.057 0.927
Cooling Rate 12.87 13 1.46 0.357 0.168 B. CTMAX
Start Temperature -0.09 12 -0.84 -0.276 0.416
Mass 0.01 12 0.10 -0.107 0.924
!"#$"%&'( PC I PC II PC III
)*+(,%$-(./( !"#$% 01234( 1215( )'"6(7$8#6"&(9"6:'(,%$-(3/( 01235( !"#&% 1215( ;<-=>'#?"&$=@(,%$-(A/( 121A( 12.1( !"##%
+'?B'#"=8#'(C'"<-6"&$=@(,%$-(D/( 012A3( 124E( '!"$(%
)"F$?8?(+'?B'#"=8#'(-G(H"#?'<=()-6=>(,%$-(
4/( !"##% 012.A( 1214(
)$6$?8?(+'?B'#"=8#'(-G(I-&J'<=()-6=>(,%$-(K/( !"#)% 012AK( 121L( +'?B'#"=8#'(*668"&(9"6:'(,%$-(E/( 012A3( !"#)% 012.4( )'"6(+'?B'#"=8#'(-G(H'=='<=(M8"#='#(,%$-(L/( !"#&% 0123L( 12.4( )'"6(+'?B'#"=8#'(-G(7#$'<=(M8"#='#(,%$-(5/( !"#*% 0123K( 12..( )'"6(+'?B'#"=8#'(-G(H"#?'<=(M8"#='#(,%$-(.1/( !"#$% 0123D( 121K( )'"6(+'?B'#"=8#'(-G(I-&J'<=(M8"#='#(,%$-(../( !"#*% 0123E( 12.3( N$:'6O"&8'( L2.( .2K( .2A( P'#Q'6=(!"#$"6Q'(NFB&"$6'J( EA23( .D23( .323(
Population Locality PC I – Mean Annual Temperature
PC II – Temperature Range
PC III – Temperature Seasonality
A. cybotes (SB) Los Patos 0.75 -1.18 0.37
A. cybotes (CC) San Cristóbal 0.44 -1.18 1.05
A. longitibialis Jaragua 0.87 -1.17 -0.95
A. whitemani Puerto Escondido 0.98 1.00 0.44
A. strahmi Camino Aguacate 0.64 1.50 0.83
A. marcanoi Ocoa 0.56 -0.14 -0.08
A. cybotes (CC) Jarabacoa 0.28 -0.61 0.61
A. cybotes (SB) Guayullal 0.76 0.75 -2.50
A. marcanoi La Horma 0.15 1.69 0.87
A. cybotes (CC) Constanza -0.47 0.66 1.01
A. cybotes (SB) La Hoz -0.40 1.30 0.25
A. shrevei Valle Nuevo - Low -1.29 0.42 -0.13
A. armouri Loma de Toro - Low -1.44 -0.18 0.16
A. armouri Loma de Toro - High -2.02 -0.64 -0.42
A. shrevei Valle Nuevo - High -2.16 -0.32 -0.69
[image:43.792.62.671.102.349.2]lnL AICC weight
Trait BM OU EB BM OU EB
CTMIN -14.99 -14.38 -14.99 0.98 0.01 0.01
TB -13.20 -11.06 -13.20 0.94 0.05 0.01
CTMAX -5.86 -5.49 -5.86 0.98 0.01 0.01
Supplemental Table 6. Results of model fitting tests showing likelihood estimates and AICC weights for the Brownian Motion (BM),
Supplementary Methods
Model Calibration
We assessed the accuracy of the copper models with embedded Thermochrons by equilibrating models at three biologically-relevant temperatures alongside a thermometer using a setup similar to Angilletta and Krochmal (2003). To this end we placed 28 models (as many as would fit) in a large incubator at the Concord Field Station, Harvard University in Bedford, MA and allowed them to acclimate over the course of an hour to three temperatures – 12, 23, and 32°C – after which temperature was recorded. On average, models deviated 0.13°C from the set incubator temperature, and the magnitude of deviation was consistently low across temperatures (Table 1).
Table 1. Accuracy of copper models (n = 28) was estimated by calculating the difference between the set temperature and model temperature.
Incubator
Temperature (°C)
Model Temperature (Mean °C ± 1sd)
Mean deviance from incubator temperature
12 11.45 ± 0.21 -0.55
23 23.61 ± 0.39 0.61
32 32.32 ± 0.31 0.32
We measured the difference in equilibrium temperatures between copper models
(Te) and a live lizard (TB) by exposing both to different temperatures, radiation, and
convective conditions (reviewed in Dzialowski 2005). One live adult male Anolis
armouri lizard and one copper lizard model were tethered to a cardboard panel using
dental floss and a thermocouple (Type T, Omega) was inserted into the cloaca of each and secured using medical tape. The panel was exposed to different thermal conditions in fifteen minute intervals including: in the sun and shade on a sunny day (air temperature
[TA] = 31.1°C), outdoors on a breezy overcast day (TA = 22°C), indoors in an
air-conditioned room (TA = 18.9°C), and indoors in a cold chamber (TA = 4°C). To avoid
thermal stress body temperatures (TB) were not allowed to drop below 10°C or go above
35°C. Te and TB were automatically recorded every minute. The correlation between TB
and Te was strong (0.889) and the coefficient of this relationship was close to 1 (coeff. =
1.03). This slope was offset by 0.86°C such that TB = 1.03(Te) + 0.86. Thus, to estimated
TB from Te we corrected all copper model temperatures by adding 0.86°C.
Works Cited
Angilletta, M.J., and A.R. Krochmal. 2003. The Thermochron: A truly miniature and
inexpensive temperature logger. Herpetological Review, 34(1): 31—32.
Dzialowski, E.M. 2005. Use of operative temperature and standard operative temperature