Sex Differences in Metabolic and Adipose Tissue
Responses to Juvenile-Onset Obesity in Sheep
Ian D. Bloor,* Sylvain P. Sébert,* Vivek Saroha, David S. Gardner,
Duane H. Keisler, Helen Budge, Michael E. Symonds, and Ravi P. Mahajan Early Life Nutrition Research Unit (I.D.B., S.P.S., V.S., H.B., M.E.S.), Academic Division of Child Health, and Division of Anaesthesia and Intensive Care (R.P.M.), School of Medicine, Queen’s Medical Centre, University Hospital, The University of Nottingham, Nottingham NG7 2UH, United Kingdom; School of Veterinary Medicine and Science (D.S.G.), Sutton Bonington Campus, The University of Nottingham, Leicestershire LE12 5RD, United Kingdom; and Division of Animal Sciences (D.H.K.), University of Missouri, Columbia, Missouri 65211
Sex is a major factor determining adipose tissue distribution and the subsequent adverse effects of obesity-related disease including type 2 diabetes. The role of gender on juvenile obesity and the accompanying metabolic and inflammatory responses is not well established. Using an ovine model of juvenile onset obesity induced by reduced physical activity, we examined the effect of gender on metabolic, circulatory, and related inflammatory and energy-sensing profiles of the major adipose tissue depots. Despite a similar increase in fat mass with obesity between genders, males demonstrated a higher storage capacity of lipids within perirenal-abdominal adipocytes and exhibited raised insulin. In contrast, obese females became hypercortisolemic, a response that was positively correlated with central fat mass. Analysis of gene expression in perirenal-abdominal adipose tissue demonstrated the stimulation of inflammatory markers in males, but not females, with obesity. Obese females displayed increased expression of genes involved in the glucocorticoid axis and energy sensing in perirenal-abdominal, but not omental, adipose tissue, indicating a depot-specific mechanism that may be pro-tective from the adverse effects of metabolic dysfunction and inflammation. In conclusion, young males are at a greater risk than females to the onset of comorbidities associated with juvenile-onset obesity. These sex-specific differences in cortisol and adipose tissue could explain the earlier onset of the metabolic-related diseases in males compared with females after obesity.(Endocrinology154: 3622–3631, 2013)
O
besity and associated comorbidities are now the leading preventable causes of mortality, and approximately 3 million adults die annually as a result of being overweight (1). Excess weight gain and obesity can be attributed to an in-crease in the ratio of calorie consumption to expenditure, and this balance may be reset by a combination of lifestyle and environmental and genetic factors (2). The recent increased prevalence of obesity implies that behavioral and socioeco-nomic factors, ie, modern sedentary lifestyles and an inade-quate diet, especially that associated with social deprivation in Western societies, are involved to a greater extent than genetic constitution (3). There is increasing evidence thatchildren and/or adolescents who become obese are highly likely to remain so as adults (4). Furthermore, risk factors associated with obesity depend not only on the age at obesity onset but also on the amount of accumulated fat tissue and its anatomical distribution. With central obesity, which is more prevalent in males, fat tissue accumulates in the upper body, ie, within intraabdominal and ectopic regions (5), whereas in premenopausal females, increased sc fat is accu-mulated in peripheral and lower-body areas, ie, within the gluteal and femoral regions (5). This gender dimorphism in fat distribution is well established, and females tend to have more adipose tissue than males. Nevertheless, body mass
ISSN Print 0013-7227 ISSN Online 1945-7170 Printed in U.S.A.
Copyright © 2013 by The Endocrine Society Received March 4, 2013. Accepted July 15, 2013. First Published Online July 24, 2013
* I.D.B. and S.P.S. contributed equally to this work.
Abbreviations: a.u., arbitrary unit; AUC, area under the curve; CV, coefficient of variation; GTT, glucose tolerance test; HPA, hypothalamic-pituitary-adrenal.
index-matched males have nearly twice the amount of vis-ceral adipose tissue than females (5). Reduced visvis-ceral adi-posity in premenopausal females has been linked to the lower prevalence of obesity-related metabolic conditions, such as hypertension, diabetes, hyperlipidemia, and cardiovascular diseases, than those seen in body mass index-matched males, although the incidences converge after the menopause with those of males (6).
Adipose tissue secretes a range of adipokines, which play important local and systemic roles in metabolism, immunity, reproduction, and the cardiovascular system (7). In obesity, adipocytes undergo hypertrophy and hy-perplasia, resulting in increased production and secretion of adipokines, which induce macrophage recruitment and infiltration (8). This results in a cumulative state of inflam-matory molecule production with additional macrophage recruitment and activation, a mechanism proposed to con-tribute to the chronic low-grade inflammation associated with obesity (9). Additionally, central obesity promotes ac-tivity of the hypothalamic-pituitary-adrenal (HPA) axis, in-dicating that obesity is a form of systemic stress (10) when the relationship between adipokine signaling hormones such as leptin and adiponectin, together with glucocorticoids and the HPA axis, become dysregulated (10 –13). Glucocorticoid status is one contributory factor in the pathologies surround-ing obesity, and plasma cortisol has been reported to be raised in females compared with males (14), although the extent to which this may contribute to sex-specific responses remains to be established.
We have previously shown an amplified inflammatory profile within perirenal-abdominal adipose tissue and ad-verse cardiovascular function in a sheep model of juvenile onset obesity, mediated by a combination of increased food intake and reduced physical activity commencing from the time of weaning (15). Using a more modest model of juvenile obesity in which only physical activity was re-stricted, we have established that there is a pronounced difference between genders in adverse effects on the renal inflammatory response (14). The extent to which the ad-ipose tissue response to obesity onset in early life differs between depots is not known. We therefore compared the effect of gender and obesity between the 2 major fat depots in the sheep, ie, omental and perirenal-abdominal depots. We wanted to investigate the hypothesis that the devel-opment of juvenile-onset obesity promotes metabolic dys-function and an amplified inflammatory state, mediated by sex and adipose depot-specific adaptations.
Materials and Methods
Animal model
Animal experimentation was conducted in accordance with the UK Home Office and the UK Animals (Scientific Procedures)
Act (1986). All animal work complied with the Principles of Laboratory Animal Care (National Institutes of Health publi-cation number 85–23, revised 1985) and approved by a local research ethics committee at the University of Nottingham. As previously published (14), immediately after weaning at 3 months, nonidentical twin sheep born to Blue-faced Swaledale mothers (except for 2 sets of male-male twins) were separated and randomly allocated into different physical activity groups, ie, rearing in either a restricted obesogenic barn environment with a stocking rate of 6 sheep per 19 m2or in an unrestricted lean
pasture environment with a stocking rate of 6 sheep per 1125 m2.
The choice of using a mild induction of obesity was motivated by the hypothesis that a supraphysiological induction of obesity could mask the gender specificity of early-onset responses (14). This ex-perimental protocol resulted in lean females (n⫽7), obese females (n⫽9), lean males (n⫽11) and obese males (n⫽9). All animals at each stage were fed to fully meet their metabolic requirements (16) with a mix of hay and concentrated pellets (Manor Farm Feeds). At 17 months of age, between July and August when all females were anestrous, each sheep was surgically implanted with temporary jugular vein catheters and an iv glucose tolerance test (GTT) undertaken, 12 hours after food withdrawal, with 5-mL blood samples withdrawn into EDTA tubes at⫺10-,⫺5-, 0-, 10-, 20-, 30-, 60-, 90-, and 120-minute time points after 0.5 g/kg⫺1
glucose perfusion, to enable calculation of area under the curve (AUC) (17). A normal feeding regimen was restored after the GTT had been performed and, 5-mL blood samples were withdrawn from overnight fasted animals into lithium heparin tubes for use in determination of plasma leptin and cortisol levels at 0-, 2-, 4-, 8-, and 24-hour time points after being fed to metabolic requirements. Blood samples were centrifuged at 2500⫻gfor 10 minutes at 4°C to obtain plasma, which was stored at⫺80°C until analysis. Ani-mals were humanely euthanized: all adipose depots were weighed, frozen in liquid nitrogen, and stored at⫺80°C, whereas represen-tative samples of the perirenal-abdominal depot were partially dis-sected and fixed in 10% formalin for histological processing.
Laboratory analyses
Adipocyte histology
Sections (5m) were sledge microtomed (Anglia Scientific) at random from perirenal-abdominal adipose tissue samples, mounted on Superfrost Plus slides (Menzel-Gläser Inc), and stained using hematoxylin and eosin. Sections were visualized through a Leica digital resolution microscope (Leica Microsys-tems) at ⫻20 magnification and photographed for analysis (Hamamatsu digital camera). Adipocyte perimeters and areas were measured for all complete adipocytes in the field of vision, using one slide for lean (⬃40 cells per animal) and two slides for obese sheep (⬃20 cells per animal). Individual adipocyte perimeters (micrometers) and areas (square micrometers) were determined using Volocity version 5.2.0 image software (PerkinElmer).
Gene expression analysis
ND-1000 spectroscopy (Nanodrop Technologies). RNA samples were normalized by dilution to 1 ng/L, reverse transcribed using a Superscript II reverse transcriptase enzyme kit (Invitrogen Ltd), and cDNA was amplified on a Touchgene Gradient thermocycler (Techne Inc).
Quantitative PCR was performed using SYBR Green Taq poly-merase master mix (Thermo Scientific) with ovine-specific oligo-nucleotide primers against a cDNA gene standard curve to verify the efficiency of the reaction and with appropriate negative con-trols. The mRNA abundance for the following genes was deter-mined: 11-hydroxysteroid dehydrogenase type 1 (11BHSD1) forward,GGCCAGATCCCTGTCGAT,reverse,AGCGGGATAC
CTTCTTT; 11-hydroxysteroid dehydrogenase type 2
(11BHSD2) (19); adiponectin forward, ATCAAAGTCTGGAA CCTCCTATCTAC, reverse, TTGCATTGCAGGC TCAAG; adi-ponectin receptor forward, GGCAAGTGTGACATCTGGTTTC, reverse, GAAACGGAACTCCTGGAGGTT; glucocorticoid re-ceptor type 2 (GR) (20); IL-6 (IL6) (21); leptin forward, GGGT
CACTGGTTTGGGACTTCA, reverse, ACTGGCGAGGATCT GTTGGTA; leptin receptor forward, TGAAACCACTGCCTCC ATCC, reverse, TCCACTTAAACCATAGCGAATC, AMP-related kinase (AMPK) (22); Bcl-2-associated X protein (BAX); mammalian target of rapamycin (mTOR); monocyte chemoattrac-tant protein 1 (MCP1) (23); and toll-like receptor 4 (TLR4) (21). Gene expression was determined using GeNorm normalization against multiple reference genes L19 ribosomal protein 19 (RPL19) (24) and large ribosomal protein (RPO) (25), using GeNorm software version 3.5 (Primer Design Ltd).
Plasma metabolite and hormone analysis
Plasma glucose [inter- and intraassay coefficient of variation (CVs) of 3.5% and 2.3%], nonesterified fatty acid (inter- and intraassay CVs of 3.8% and 1.8%), and triglyceride (inter- and intraassay CVs of 4.2% and 2.9%) concentrations were deter-mined colormetrically, insulin (inter- and intraassay CVs of 5.4% and 4.4%) and cortisol (inter- and intraassay CVs of 4.6% and 3.5%) by ELISA for which the limits of detection were 0.15 ng/mL and 6.9 nM, respectively (17) and plasma leptin (inter- and intraas-say CVs of 7.4% and 4.9%) by RIA, which was specific for ovine leptin, and the limit of detection was 0.8 ng/mL (26).
Statistical analysis
[image:3.594.44.537.99.210.2]For consistency, all data are expressed as mean⫾SEM. Data were subjected to the Kolmogorov-Smirnov test to deter-mine their distribution followed by either ANOVA or Kruskal-Wallis statistical tests, respectively, for parametric and non-parametric data, with applied multiple testing post hoc corrections. Exceptions to this were the adipocyte population fre-quencies, which were treated with an F test for variance distribution (see Figure 3); time course analyses (see Figure 4), which were treated with a 2-way ANOVA with repeated measures; and correlations, which were treated with linear regression
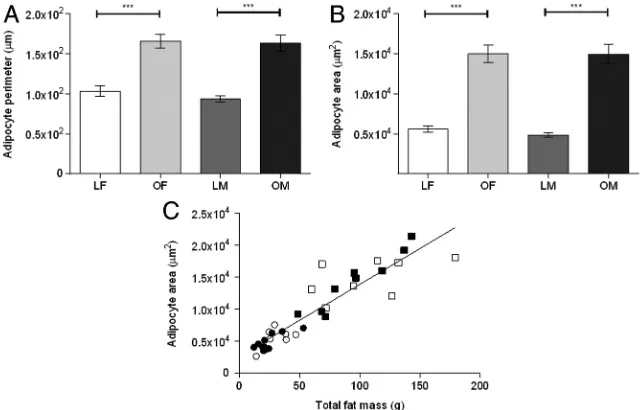
Figure 1. Mean perirenal-abdominal adipocyte perimeter (A) and area (B), for lean (L), obese (O) female (F) and male (M) sheep. Values are mean⫾SEM. ***,P⬍.001. C, Positive linear relationship between perirenal-abdominal adipose tissue (PAT) mass and adipocyte area (r2
[image:3.594.40.360.479.684.2]⫽0.85;P⬍.0001) in lean (open circles) and obese females (open squares) and lean (filled circles) and obese males (filled squares).
Table 1. Food Intake and Whole-Body, Lean, Perirenal-Abdominal, and Omental Fat Mass of Lean and Obese Young Adult Sheep
Lean Female (nⴝ7)
Obese Female (nⴝ9)
Lean Male (nⴝ11)
Obese Male (nⴝ9)
Effect of Gender Within Body Weight Group
Relative energy intake, MJ/kg⫺1per 24 h⫺1
0.35⫾0.02 0.38⫾0.02 0.29⫾0.02 0.36⫾0.02 NS Body weight, kg 49.50⫾1.04 61.56⫾2.07a 56.38⫾2.59 83.84⫾1.82a P⬍.005
Lean mass, kg 39.72⫾0.87 44.03⫾1.22 49.09⫾1.89 62.41⫾1.30 P⬍.005 Relative fat mass, % 8.42⫾1.12 14.31⫾1.26a 6.77⫾0.66 12.93⫾1.06a NS
Perirenal-abdominal fat, kg 0.31⫾0.04 1.06⫾0.13b 0.22⫾0.02 0.96⫾0.11a NS
Omental fat, kg 0.33⫾0.06 1.62⫾0.17c 0.26⫾0.05 1.54⫾0.16b NS
Abbreviations: NS, no significant difference. Values are mean⫾SEM. a
P⬍.005, effect of obesity within gender group. b
P⬍.001, effect of obesity within gender group. c
analysis and Pearson’s correlation coefficient (see Figure 5). These analyses were performed using PASW version 17.12 statistics soft-ware (IBM UK). Statistical significance was accepted with a confi-dence interval of 95% (P⬍.05).
Results
The effects of sex and juvenile obesity on fat mass and adipose tissue composition
As previously published (14), total body and lean tissues weights were increased by the obesogenic environment, and the increase in both omental and perirenal-abdominal fat mass was similar in both genders, whereas the food intake (per kilogram of body weight) was similar between groups (Table 1). In perirenal-abdominal adipose tissue, this was accompanied by an increase in adipocyte perimeter and area irrespective of sex (Figure 1 and Supplemental Figure 1, pub-lished on The Endocrine Society’s Journals Online web site at http:// endo.endojournals.org), with the depot size being pos-itively correlated with adipocyte area. Lean males had more
small adipocytes than females, a differ-ence that disappeared with adipocyte enlargement after obesity (Figure 2).
The effect of increased adiposity on basal and
stimulated plasma hormone and metabolite concentrations
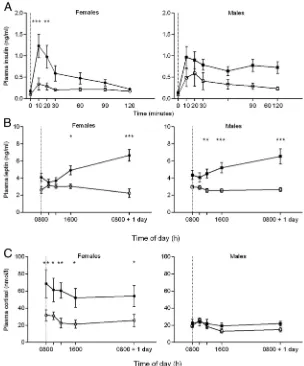
Fasting insulin increased with obesity in males but not females (Ta-ble 2), whereas AUC after the GTT was increased in both genders (Fig-ure 3A). Plasma leptin prior to feed-ing was unaffected by gender (Table 2), whereas its response to feeding was greater in obese animals (Figure 3B). In contrast, prior to feeding, plasma cortisol was higher in females than males, although this difference was statistically significant only in obese animals (Table 2). The raised plasma cortisol in obese females was maintained throughout the 24-hour sampling period (Figure 3C). There were no significant differences in plasma glucose, nonesterified fatty acids (NEFAs), or triglycerides with obesity or between genders (Table 2). For all animals, the total fat mass was positively correlated with leptin response to feeding, whereas vis-ceral fat mass was positively correlated with cortisol in females only (Figure 4).
Effect of gender and obesity on genes
regulating metabolic, inflammatory, apoptotic, and energy-sensing pathways and glucocorticoid action
[image:4.594.63.364.63.186.2]In perirenal-abdominal fat, gene expression for adi-ponectin was higher in obese males than females, whereas the abundance of transcripts for its receptor, together with Figure 2. Frequency distribution (percentage) of perirenal-abdominal adipocyte area for lean
and obese female (grey bars) and lean male and obese male (black bars) sheep. Variance of distribution between lean groups by F test showed significance (P⫽.0002). Between obese groups there was no statistical significance.
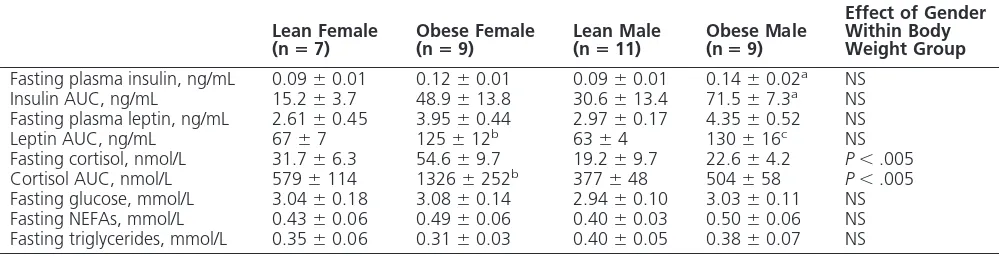
Table 2. Endocrine and Metabolic Responses Under Fasting and Stimulated Conditions in Lean and Obese Young Adult Sheep
Lean Female
(nⴝ7) Obese Female(nⴝ9) Lean Male(nⴝ11) Obese Male(nⴝ9)
Effect of Gender Within Body Weight Group
Fasting plasma insulin, ng/mL 0.09⫾0.01 0.12⫾0.01 0.09⫾0.01 0.14⫾0.02a NS
Insulin AUC, ng/mL 15.2⫾3.7 48.9⫾13.8 30.6⫾13.4 71.5⫾7.3a NS
Fasting plasma leptin, ng/mL 2.61⫾0.45 3.95⫾0.44 2.97⫾0.17 4.35⫾0.52 NS Leptin AUC, ng/mL 67⫾7 125⫾12b 63⫾4 130⫾16c NS
Fasting cortisol, nmol/L 31.7⫾6.3 54.6⫾9.7 19.2⫾9.7 22.6⫾4.2 P⬍.005 Cortisol AUC, nmol/L 579⫾114 1326⫾252b 377⫾48 504⫾58 P⬍.005
Fasting glucose, mmol/L 3.04⫾0.18 3.08⫾0.14 2.94⫾0.10 3.03⫾0.11 NS Fasting NEFAs, mmol/L 0.43⫾0.06 0.49⫾0.06 0.40⫾0.03 0.50⫾0.06 NS Fasting triglycerides, mmol/L 0.35⫾0.06 0.31⫾0.03 0.40⫾0.05 0.38⫾0.07 NS
Abbreviation: NEFA, nonesterified fatty acid; NS, no significant difference. Values are mean⫾SEM. aP⬍.05, effect of obesity within gender group.
b
[image:4.594.49.550.566.694.2]those of leptin and its receptor, was unaffected by obesity and gender (Table 3). For omental fat, however, the mRNA abundance for leptin was greater in females than males, a difference that was amplified with obesity [female: lean, 0.07⫾0.01; obese, 0.48⫾0.01 (P⬍.001); male: lean, 0.05⫾0.01; obese, 0.24⫾0.04 arbitrary units (a.u.) (male vs female,P⬍.05)]. In contrast, in omental fat, gene expression for adiponectin was raised with obe-sity but unaffected by gender [female: lean, 0.21⫾0.03; obese, 0.34 ⫾0.03 (P⬍.05); male: lean, 0.21 ⫾ 0.04; obese, 0.34 ⫾ 0.04 a.u. (lean vs obese P ⬍ .05)], but mRNA for leptin and adiponectin receptors andIL6was below the limits of detection in this depot. When mRNA markers of inflammation within perirenal-abdominal ad-ipose tissue were considered, each gene measured was highly abundant. Furthermore,IL6gene expression was greater in lean but not obese males compared with females (Table 3). In contrast, mRNA abundance for bothTLR4
andMCP1were raised with obesity in males but not females in perirenal-abdominal but not omental fat (eg, TLR4: female, lean 0.31 ⫾ 0.05; obese, 0.42 ⫾ 0.04; male: lean, 0.31 ⫾ 0.02; obese, 0.39 ⫾ 0.06 a.u.).
The mRNA abundance for the GRwas similar between genders, ir-respective of body weight, in both fat depots examined, although it was raised with obesity in the perirenal-abdominal depot in females (Table 3), and in the omental depot in males [female: lean 0.39 ⫾ 0.05; obese 0.51⫾0.03; male: lean 0.37⫾0.04; obese 0.55⫾0.08 a.u. (P⬍.05)]. In contrast, 11HSD1 mRNA abun-dance was similar between all groups in the omental depot (female: lean 0.46 ⫾ 0.08; obese 0.35 ⫾ 0.03; male: lean 0.40⫾0.08; obese 0.36⫾ 0.04 a.u.) but in the perirenal-ab-dominal depot was lower in obese males than females (Table 3). Gene expression for11HSD2was below the limits of detection in the omental fat, but in the perirenal-abdominal, the depot was higher in lean males than females (Table 3).
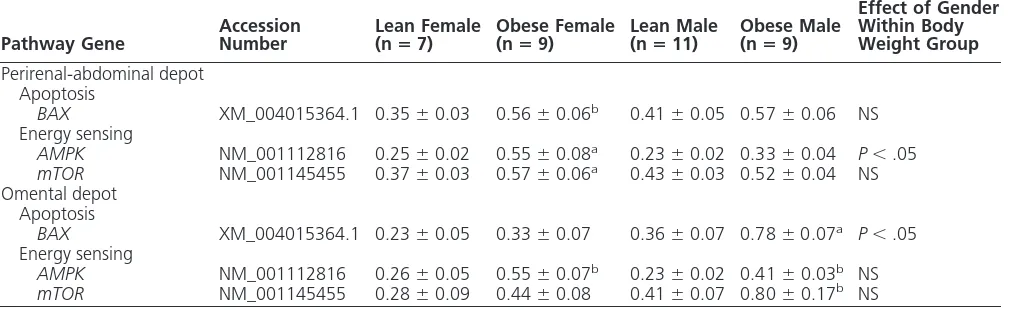
There were marked differences between genders and fat depots in the genes involved in apoptosis (BAX) and energy sensing (AMPK and mTOR) (Table 4). In perirenal-abdominal fat, the expression of each of these genes was greater only in obese females than lean females, whereas in omental fat, an ef-fect of obesity was found in the males but not females.
Discussion
[image:5.594.48.352.67.433.2]A major finding from our study is that although obesity promoted comparable increases in total fat mass and adi-pocyte size in both sexes, females alone were characterized as showing a pronounced increase in plasma cortisol with obesity. Raised cortisol is an established measure of phys-iological stress (27), suggesting that the higher plasma cor-tisol previously reported in adolescent females (28) reap-pears with obesity. This could therefore represent an adaptive response that protects females from the early on-set of the adverse effects from obesity (14). Similarly, the Figure 3. Time course of changes in plasma insulin during a GTT (A), plasma leptin (B), and
impaired insulin response to a glucose challenge found in obese males could be related to their failure to increase plasma cortisol with obesity, ultimately placing them at increased risk of diabetes.
Overall, in accord with epidemiological evidence (29), only obese males had elevated plasma insulin, indicating their increased sensitivity to developing insulin resistance. These gender differences in insulin responsiveness have been attributed to sex hormones because, in humans, they disap-pear after the menopause when estrogen declines at the ex-pense of androgens. This hormonal shift is suspected to be a major determinant behind the subsequent rise in visceral fat
mass in females, which can lead to in-sulin resistance (30). The exact mech-anism behind a sex hormone-medi-ated retardation in the rate of development of insulin resistance in obesity observed in females is cur-rently unknown but could potentially include a change in cortisol action. The effect of gender in response to obe-sity on HPA axis activation and the resulting stress response are likely to be due, in part, to differences in the circulating gonadal sex steroid hor-mone milieu. Estrogen, acting through the central nervous system, can am-plify HPA function, whereas T has the opposite effect (31). It is possible there-fore that juvenile-onset obesity pro-motes estrogenic effects on the HPA axis in females. This results in raised cortisol, an outcome not observed in the obese males, which conversely may be due to suppressive effects of T (32).
Changes in adipose tissue deposition and physiology
[image:6.594.62.364.63.258.2]We have shown that both sexes exhibit an increase in total fat mass after early life exposure to an obesogenic environment. As expected, lean and obese female animals were fatter than the males, results that are consistent be-tween species including humans (33). In obese humans, total fat mass is greater than 32% and greater than 25%
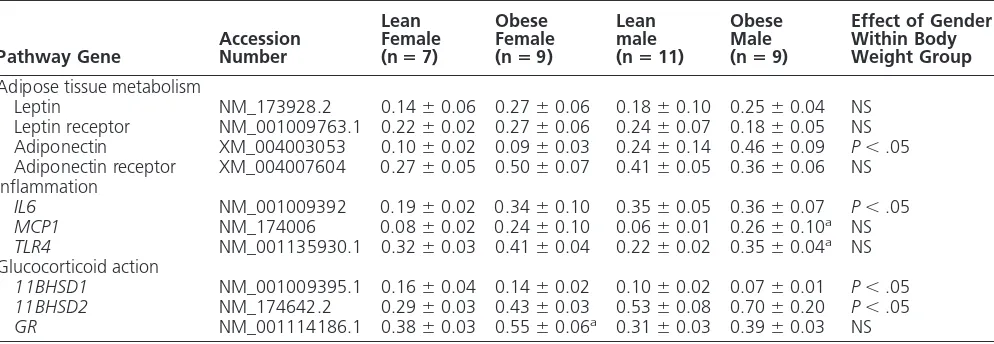
Table 3. Effect of Gender and Juvenile Obesity on Gene Expression Markers of Adipose Tissue Metabolism, Inflammation, and Glucocorticoid Action in Perirenal-Abdominal Adipose Tissue of Young Adult Sheep
Pathway Gene AccessionNumber
Lean Female (nⴝ7)
Obese Female (nⴝ9)
Lean male (nⴝ11)
Obese Male (nⴝ9)
Effect of Gender Within Body Weight Group
Adipose tissue metabolism
Leptin NM_173928.2 0.14⫾0.06 0.27⫾0.06 0.18⫾0.10 0.25⫾0.04 NS Leptin receptor NM_001009763.1 0.22⫾0.02 0.27⫾0.06 0.24⫾0.07 0.18⫾0.05 NS Adiponectin XM_004003053 0.10⫾0.02 0.09⫾0.03 0.24⫾0.14 0.46⫾0.09 P⬍.05 Adiponectin receptor XM_004007604 0.27⫾0.05 0.50⫾0.07 0.41⫾0.05 0.36⫾0.06 NS Inflammation
IL6 NM_001009392 0.19⫾0.02 0.34⫾0.10 0.35⫾0.05 0.36⫾0.07 P⬍.05
MCP1 NM_174006 0.08⫾0.02 0.24⫾0.10 0.06⫾0.01 0.26⫾0.10a NS
TLR4 NM_001135930.1 0.32⫾0.03 0.41⫾0.04 0.22⫾0.02 0.35⫾0.04a NS
Glucocorticoid action
11BHSD1 NM_001009395.1 0.16⫾0.04 0.14⫾0.02 0.10⫾0.02 0.07⫾0.01 P⬍.05
11BHSD2 NM_174642.2 0.29⫾0.03 0.43⫾0.03 0.53⫾0.08 0.70⫾0.20 P⬍.05
GR NM_001114186.1 0.38⫾0.03 0.55⫾0.06a 0.31⫾0.03 0.39⫾0.03 NS
Abbreviations:GR, glucocorticoid receptor (type 2);11BHSD1, 11B hydroxysteroid dehydrogenase type 1;11BHSD2, 11B hydroxysteroid dehydrogenase type 2;IL6, IL-6;MCP1, monocyte chemoattractant protein 1; NS, no significant difference;TLR4, Toll-like receptor 4. Values are mean⫾SEM.
[image:6.594.51.548.528.700.2]aP⬍.05, effect of obesity within gender group.
of body weight for females and males, respectively (34). Yet in the present study, despite the 2-fold increase of total body fat including central depots, obese females had ap-proximately 15% and males had apap-proximately 13% to-tal fat mass. We therefore suggest that our study’s model of juvenile-onset obesity, which is mediated only through restricted physical activity, resulted in a moderate obesity, which was still sufficient to cause significant changes in adiposity and metabolic homeostasis.
The 3-fold enlargement in perirenal adipocytes with obesity, irrespective of gender, indicates that depot en-largement was a consequence of adipocyte hypertrophy rather than hyperplasia, a finding also observed in humans (35). Population distribution analysis identified that lean males had smaller perirenal adipocytes than females, but after exposure to an obesogenic environment, this differ-ence was removed. These results reflect gender differdiffer-ences in responsiveness of visceral adipocytes, with males having a larger storage capacity for triglycerides and lipids, po-tentially encouraging increased central deposition with early-onset obesity. In adult humans, sc adipocytes are larger and have increased triglyceride storage compared with intraabdominal adipocytes, and in females, adi-pocytes from this depot are more active, playing a greater role in the metabolic profile (36).
Differences in gender response to obesity in metabolic and inflammatory pathways between central fat depots
The adaptive response to raised cortisol in females did not appear to extend to adipose tissue because there were only modest differences in gene expression responsiveness
between genders and the magnitude of overall response to obesity was similar. In human obesity, hypercortisolism is a prominent feature, both systemically and intracellularly (37), when cortisol production and clearance are simul-taneously elevated, but plasma concentrations are unaf-fected (38). A positive relationship between elevated cor-tisol clearance and increased fat mass is present in females (39), suggesting their adipose tissue has a greater capacity to bind cortisol acting through its receptor. This divergent sensitivity between sexes is supported by the gender-spe-cific relationship we observed between central fat mass and plasma cortisol response to feeding.
[image:7.594.36.542.103.258.2]Adult onset obesity also affects glucocorticoid metab-olism with raised gene expression for both GR and 11BHSD1, which is greater in visceral compared with sc adipose tissue (40) when increased plasma cortisol is pos-itively correlated to visceral obesity (40). Surprisingly, in our study, gene expression for 11BHSD1 was reduced with obesity in perirenal-abdominal, but not omental, fat, and this would be predicted to reduce local cortisol syn-thesis (42). Chronic exposure to elevated cortisol and con-comitant activation of the HPA axis can contribute to the pathogenesis and development of abdominal obesity (43). Despite a divergent relationship between genders found in the present study, the increase in fat mass with obesity was similar as were the metabolic consequences in terms of changes in plasma leptin. Raised plasma and tissue cortisol can, however, suppress inflammation via inhibition of im-mune cell function (44) and, as a consequence, can be protective against the chronic low-grade inflammation that accompanies obesity (45) as we have previously found in the kidneys of obese females (14).
Table 4. Contrasting Effect of Gender and Juvenile Obesity on Gene Expression for Markers of Apoptosis and Energy Sensing Between Perirenal-Abdominal and Omental Adipose Tissue of Young Adult Sheep
Pathway Gene
Accession Number
Lean Female (nⴝ7)
Obese Female (nⴝ9)
Lean Male (nⴝ11)
Obese Male (nⴝ9)
Effect of Gender Within Body Weight Group
Perirenal-abdominal depot Apoptosis
BAX XM_004015364.1 0.35⫾0.03 0.56⫾0.06b 0.41⫾0.05 0.57⫾0.06 NS
Energy sensing
AMPK NM_001112816 0.25⫾0.02 0.55⫾0.08a 0.23⫾0.02 0.33⫾0.04 P⬍.05
mTOR NM_001145455 0.37⫾0.03 0.57⫾0.06a 0.43⫾0.03 0.52⫾0.04 NS
Omental depot Apoptosis
BAX XM_004015364.1 0.23⫾0.05 0.33⫾0.07 0.36⫾0.07 0.78⫾0.07a P⬍.05
Energy sensing
AMPK NM_001112816 0.26⫾0.05 0.55⫾0.07b 0.23⫾0.02 0.41⫾0.03b NS
mTOR NM_001145455 0.28⫾0.09 0.44⫾0.08 0.41⫾0.07 0.80⫾0.17b NS
Abbreviations: AMPK, AMP-related kinase; BAX, Bcl-2-associated X protein; mTOR, mammalian target of rapamycin; NS, no significant difference. Values are mean⫾SEM.
aP⬍.01, effect of obesity within gender group. b
Although fat mass is a primary determinant of plasma leptin across species (46), positive correlations between hyperleptinemia, hyperlipidemia, insulin resistance, and hypertension have been shown to be independent of total adiposity (47). We saw no relationship between plasma leptin and insulin but a positive correlation between total fat mass and plasma leptin, irrespective of gender. It is possible that a combination of early-onset obesity, to-gether with the relatively moderate nature of the obeso-genic challenge, contributed to raised plasma leptin in an attempt to control appetite and energy balance and thus further weight gain. Furthermore, leptin gene transcrip-tion and protein synthesis are both affected by gross changes in energy intake (48), although this response can be adipose depot and gender specific (49), with an en-hanced leptin mRNA response in sc, compared with vis-ceral adipose tissue (50). In accord with this proposal, we found raised leptin gene expression only in omental, but not perirenal-abdominal, adipose tissue with obesity, and this response was greater in females than males. However, in perirenal-abdominal, but not omental, adipose tissue, gene expression for bothMCP1 and TLR4were raised with obesity in males but not females. This is also indic-ative of an enhanced inflammatory related response (51), which may contribute to insulin resistance (52, 53).
Interestingly, although11BHSD2mRNA was undetect-able in omental fat, the increased perirenal-abdominal fat mass with age was negatively correlated with 11BHSD2 gene expression, and this could reflect an increase in the size of this depot during juvenile life (54). In the present study, we found higher gene expression in lean males than females with no effect of obesity. One explanation for the different re-sponsiveness between omental and perirenal-abdominal fat depots could reside in their divergent developmental origins, with the perirenal-abdominal depot being the largest in the fetal sheep (55) in which it is primarily characterized as being brown (56). Then during postnatal life, it transforms into a white or beige depot, whereas, in marked contrast, the omen-tal fat depot does not appear until after birth and is purely a white fat depot (57). The extent to which these divergent developmental profiles could contribute to gender-specific changes in glucocorticoid action remains to be established.
Intracellular glucocorticoid binding to theGRis a path-way involved in the inhibition of cytokine transcription and production (58), and the increase in both cortisol and GRwithin perirenal-abdominal adipose tissue could have acted together to prevent any change in the expression of inflammatory genes with obesity in females. In accord with this proposal, gene markers for both apoptosis and energy sensing were raised with obesity only in females within their perirenal-abdominal, but not omental, de-pots. For males, however, the opposite response was seen,
and this may, potentially, reflect differences in epigenetic regulation (41). The extent to which the changes we have observed for gene expression are translated directly into protein remains to be established, although it is well rec-ognized that undertaking this type of analysis on ovine tissues remains a challenge due to the scarcity of reliable and fully validated antibodies (56).
In conclusion, sex has a major influence on both the endocrine and adipocyte responses to juvenile-onset obe-sity. Consequently, males show a more pronounced re-sponse than females, resulting in amplified inflammatory gene expression, which is predicted to place them at greater risk of subsequent metabolic dysfunction. Fe-males appear to be protected from such a response as a consequence of raised cortisol and greater adipocyte sensitivity in a depot-specific manner. These findings further explain the dimorphic gender response to obe-sity and its comorbidities.
Acknowledgments
Address all correspondence and requests for reprints to: Professor Michael E. Symonds, Academic Division of Child Health School of Clinical Sciences, E Floor, East Block, Queen’s Medical Centre, University Hospital, The University of Notting-ham, Nottingham NG7 2UH, United Kingdom. E-mail: michael. symonds@nottingham.ac.uk.
This work was funded and supported by The British Journal of Anaesthesia, the Royal College of Anaesthetists; the European Union Sixth Framework Program for Research and Technical Development of the European Community, The Early Nutrition Programming Project (Grant FOOD-CT-2005-007036); and the Nutricia Research Foundation.
Present address for S.P.S.: Institute of Health Sciences, Uni-versity of Oulu, PO Box 8000, Oulu FI-91004, Finland.
Disclosure Summary: The authors have no conflicts of inter-est to disclose.
References
1. World Health Organization.Obesity and overweight.World Health Organisation.Fact Sheet number 311; 2011.
2. Martinez JA.Body-weight regulation: causes of obesity.Proc Nutr Soc. 2000;59(3):337–345.
3. National Health Service.Statistics on obesity, physical activity and diet: England, 2010.London: The Information Centre for Health and Social Care; 2010, London, UK.
4. Singh AS, Mulder C, Twisk JW, van Mechelen W, Chinapaw MJ. Tracking of childhood overweight into adulthood: a systematic re-view of the literature.Obes Rev. 2008;9(5):474 – 488.
6. Rappelli A.Hypertension and obesity after the menopause.J Hy-pertens Suppl. 2002;20(2):S26 –S28.
7. Ahima RS.Central actions of adipocyte hormones.Trends Endo-crinol Metab. 2005;16(7):307–313.
8. Wellen KE, Hotamisligil GS.Obesity-induced inflammatory changes in adipose tissue.J Clin Invest. 2003;112(12):1785–1788.
9. Trayhurn P, Wood IS.Signalling role of adipose tissue: adipokines and inflammation in obesity.Biochem Soc Trans. 2005;33(Pt 5): 1078 –1081.
10. Mathieu P, Poirier P, Pibarot P, Lemieux I, Despres JP.Visceral obesity: the link among inflammation, hypertension, and cardio-vascular disease.Hypertension. 2009;53(4):577–584.
11. Syed AA, Weaver JU.Glucocorticoid sensitivity: the hypothalamic-pituitary-adrenal-tissue axis.Obes Res. 2005;13(7):1131–1133. 12. Stewart PM, Boulton A, Kumar S, Clark PM, Shackleton CH.
Cor-tisol metabolism in human obesity: impaired cortisone-⬎cortisol conversion in subjects with central adiposity.J Clin Endocrinol Metab. 1999;84(3):1022–1027.
13. Dallman MF, Strack AM, Akana SF, et al.Feast and famine: critical role of glucocorticoids with insulin in daily energy flow.Front Neu-roendocrinol. 1993;14(4):303–347.
14. Bloor ID, Sebert SP, Mahajan RP, Symonds ME.The influence of sex on early stage markers of kidney dysfunction in response to juvenile obesity.Hypertension. 2012;60(4):991–997.
15. Sharkey D, Gardner DS, Symonds ME, Budge H.Maternal nutrient restriction during early fetal kidney development attenuates the re-nal innate inflammatory response in obese young adult offspring. Am J Physiol Renal Physiol. 2009;297(5):F1199 –F1207. 16. Agricultural and Food Research Council.Technical Committee on
Responses to Nutrients, Alderman G, Cottrill BR.Energy and Pro-tein Requirements of Ruminants.Wallingford, UK: CAB Interna-tional; 1993.
17. Sebert SP, Hyatt MA, Chan LL, et al.Maternal nutrient restriction between early and midgestation and its impact upon appetite reg-ulation after juvenile obesity.Endocrinology. 2009;150(2):634 – 641.
18. Chomczynski P, Sacchi N.Single-step method of RNA isolation by acid guanidinium thiocyanate-phenol-chloroform extraction.Anal Biochem. 1987;162(1):156 –159.
19. Dodic M, Abouantoun T, O’Connor A, Wintour EM, Moritz KM. Programming effects of short prenatal exposure to dexamethasone in sheep.Hypertension. 2002;40(5):729 –734.
20. Williams PJ, Kurlak LO, Perkins AC, et al.Hypertension and im-paired renal function accompany juvenile obesity: the effect of pre-natal diet.Kidney Int. 2007;72(3):279 –289.
21. Sharkey D, Gardner DS, Fainberg HP, et al.Maternal nutrient re-striction during pregnancy differentially alters the unfolded protein response in adipose and renal tissue of obese juvenile offspring. FASEB J. 2009;23(5):1314 –1324.
22. Sebert SP, Dellschaft NS, Chan LL, et al.Maternal nutrient restric-tion during late gestarestric-tion and early postnatal growth in sheep dif-ferentially reset the control of energy metabolism in the gastric mu-cosa.Endocrinology. 2011;152(7):2816 –2826.
23. Dunphy J, Horvath A, Barcham G, Balic A, Bischof R, Meeusen E.Isolation, characterisation and expression of mRNAs encoding the ovine CC chemokines, monocyte chemoattractant protein (MCP)-1␣and -2.Vet Immunol Immunopathol. 2001;82(3– 4): 153–164.
24. Garcia-Crespo D, Juste RA, Hurtado A.Differential gene expression in central nervous system tissues of sheep with natural scrapie.Brain Res.2006;1073–1074:88 –92.
25. Robinson TL, Sutherland IA, Sutherland J.Validation of candidate bovine reference genes for use with real-time PCR.Vet Immunol Immunopathol. 2007;115(1–2):160 –165.
26. Delavaud C, Bocquier F, Chilliard Y, Keisler DH, Gertler A, Kann G.Plasma leptin determination in ruminants: effect of nutritional
status and body fatness on plasma leptin concentration assessed by a specific RIA in sheep.J Endocrinol. 2000;165(2):519 –526. 27. Torres SJ, Nowson CA.Relationship between stress, eating
behav-ior, and obesity.Nutrition. 2007;23(11–12):887– 894.
28. Gardner DS, Van Bon BW, Dandrea J, et al.Effect of periconcep-tional undernutrition and gender on hypothalamic-pituitary-adre-nal axis function in young adult sheep.J Endocrinol. 2006;190(2): 203–212.
29. Frias JP, Macaraeg GB, Ofrecio J, Yu JG, Olefsky JM, Kruszynska YT.Decreased susceptibility to fatty acid-induced peripheral tissue insulin resistance in women.Diabetes. 2001;50(6):1344 –1350. 30. Turgeon JL, Carr MC, Maki PM, Mendelsohn ME, Wise
PM.Com-plex actions of sex steroids in adipose tissue, the cardiovascular system, and brain: Insights from basic science and clinical studies. Endocr Rev. 2006;27(6):575– 605.
31. Austin H, Austin JM Jr, Partridge EE, Hatch KD, Shingleton HM. Endometrial cancer, obesity, and body fat distribution.Cancer Res. 1991;51(2):568 –572.
32. Seale JV, Wood SA, Atkinson HC, Harbuz MS, Lightman SL. Go-nadal steroid replacement reverses gonadectomy-induced changes in the corticosterone pulse profile and stress-induced hypothalamic-pituitary-adrenal axis activity of male and female rats.J Neuroen-docrinol. 2004;16(12):989 –998.
33. Enzi G, Gasparo M, Biondetti PR, Fiore D, Semisa M, Zurlo F. Subcutaneous and visceral fat distribution according to sex, age, and overweight, evaluated by computed tomography.Am J Clin Nutr. 1986;44(6):739 –746.
34. Kopelman PG. Obesity as a medical problem. Nature. 2000; 404(6778):635– 643.
35. Marin P, Andersson B, Ottosson M, et al.The morphology and metabolism of intraabdominal adipose tissue in men.Metabolism. 1992;41(11):1242–1248.
36. Tchernof A, Belanger C, Morisset AS, et al.Regional differences in adipose tissue metabolism in women: minor effect of obesity and body fat distribution.Diabetes. 2006;55(5):1353–1360.
37. Salehi M, Ferenczi A, Zumoff B.Obesity and cortisol status.Horm Metab Res. 2005;37(4):193–197.
38. Bjorntorp P, Rosmond R.Obesity and cortisol.Nutrition. 2000; 16(10):924 –936.
39. Strain GW, Zumoff B, Kream J, Strain JJ, Levin J, Fukushima D.Sex difference in the influence of obesity on the 24 hr mean plasma concentration of cortisol.Metabolism. 1982;31(3):209 –212. 40. Veilleux A, Laberge PY, Morency J, Noel S, Luu-The V, Tchernof
A.Expression of genes related to glucocorticoid action in human subcutaneous and omental adipose tissue.J Steroid Biochem Mol Biol. 2010;122(1–3):28 –34.
41. Sebert S, Sharkey D, Budge H, Symonds ME.The early program-ming of metabolic health: is epigenetic setting the missing link?Am J Clin Nutr.2011;94(6 Suppl):1953S–1958S.
42. Wake DJ, Rask E, Livingstone DE, Soderberg S, Olsson T, Walker BR.Local and systemic impact of transcriptional up-regulation of 11-hydroxysteroid dehydrogenase type 1 in adipose tissue in hu-man obesity.J Clin Endocrinol Metab. 2003;88(8):3983–3988. 43. Bjorntorp P.Do stress reactions cause abdominal obesity and
co-morbidities?Obes Rev. 2001;2(2):73– 86.
44. Auphan N, DiDonato JA, Rosette C, Helmberg A, Karin M. Immu-nosuppression by glucocorticoids: inhibition of NF-B activity through induction of IB synthesis.Science. 1995;270(5234):286 – 290.
45. Fain JN, Madan AK, Hiler ML, Cheema P, Bahouth SW. Compar-ison of the release of adipokines by adipose tissue, adipose tissue matrix, and adipocytes from visceral and subcutaneous abdominal adipose tissues of obese humans. Endocrinology. 2004;145(5): 2273–2282.
47. Ren J.Leptin and hyperleptinemia—from friend to foe for cardio-vascular function.J Endocrinol. 2004;181(1):1–10.
48. Fruhbeck G, Jebb SA, Prentice AM.Leptin: physiology and patho-physiology.Clin Physiol. 1998;18(5):399 – 419.
49. Montague CT, Prins JB, Sanders L, Digby JE, O’Rahilly S. Depot-and sex-specific differences in human leptin mRNA expression: im-plications for the control of regional fat distribution.Diabetes. 1997;46(3):342–347.
50. Chilliard Y, Bonnet M, Delavaud C, et al.Leptin in ruminants. Gene expression in adipose tissue and mammary gland, and regulation of plasma concentration.Domest Anim Endocrinol. 2001;21(4):271– 295.
51. Sharkey D, Symonds ME, Budge H.Adipose tissue inflammation: developmental ontogeny and consequences of gestational nutrient restriction in offspring.Endocrinology. 2009;150(8):3913–3920. 52. Zhang HM, Chen LL, Wang L, et al.Macrophage infiltrates with
high levels of Toll-like receptor 4 expression in white adipose tissues
of male Chinese.Nutr Metab Cardiovasc Dis. 2009;19(10):736 – 743.
53. Kanda H, Tateya S, Tamori Y, et al.MCP-1 contributes to macro-phage infiltration into adipose tissue, insulin resistance, and hepatic steatosis in obesity.J Clin Invest. 2006;116(6):1494 –1505. 54. Gnanalingham MG, Mostyn A, Symonds ME, Stephenson T.
On-togeny and nutritional programming of adiposity in sheep: potential role of glucocorticoid action and uncoupling protein-2.Am J Physiol Regul Integr Comp Physiol. 2005;289(5):R1407–R1415. 55. Gemmel RT, Alexander G.Ultrastructural development of adipose
tissue in foetal sheep.Am J Anat. 1972;31:505–515.
56. Pope M, Budge H, Symonds ME.The developmental transition of ovine adipose tissue through early life [published online January 28, 2013].Acta Physiol (Oxf).doi:10.1111/apha.12053.
57. Symonds ME, Pope M, Sharkey D, Budge H.Adipose tissue and fetal programming.Diabetologia. 2012;55(6):1597–1606.
58. Labeur M, Holsboer F.Molecular mechanisms of glucocorticoid receptor signaling.Medicina (B Aires).70(5):457– 462.