Recent Developments in the Realistic Geometric Modelling of Textile
Structures using TexGen
Louise P. Brown*, Xuesen Zeng, Andrew C. Long, I. Arthur Jones
Faculty of Engineering – Division of Materials, Mechanics & Structures, University of Nottingham, University Park, Nottingham, NG7 2RD, U.K.
* Corresponding Author. Email: [email protected]
ABSTRACT
Realistic geometric representation of fabrics is essential for modelling of mechanical and physical properties of textiles and textile composites. It is also advantageous to be able to generate those models quickly and easily. Recent developments in TexGen which automate the creation of models for 3D orthogonal, angle interlock and layer-to-layer fabrics and sheared 2D fabrics are described. Micro-Computed Tomography data of 3D fabrics has been used to identify geometrical characteristics which have formed the basis for implementation of refinements to the idealised fabrics generated automatically in TexGen. In 3D orthogonal textiles local geometrical variations, particularly in yarn cross-section, surface crimp and binder yarn path are apparent at different levels of compaction. The “refine” option in TexGen‟s 3D wizard automatically adjusts these features to achieve compaction to a specified thickness, using yarn volume fraction as a constraint. For sheared textiles a generic 2D plain weave fabric was used to identify key geometric features. Yarn rotation has been identified as one of these and the geometric description of the sheared fabric considers yarn rotations in terms of two elliptical cylinders crossing each other at an oblique angle. The rotational angle is derived mathematically from the tangential contact between yarns. Variations in yarn height along the length of the yarn have also been identified and both of these features are incorporated into a refine function for sheared textiles. Compatible voxelised mesh and periodic boundary conditions for the sheared domain have also been implemented. The models have been used to generate manufacturing data: permeability data for the 3D fabric and coefficient of thermal expansion for the sheared 2D fabric.
Keywords: 3Dtextile, sheared fabric, geometric modelling, permeability, thermal expansion
1. Introduction
Modelling techniques for textiles have, in part, been driven by the need to address manufacturing problems in textile composites, making it essential to produce realistic models of the textile structures involved. In 3D woven reinforcements the microstructure determines the flow of the penetrating matrix resin during composite manufacture, which has a strong influence on the quality of the finished component, particularly with regard to defect formation. Inclusion of local variations observed in micro-Computed Tomography (µ-CT) images of textiles significantly improve predictions of permeability[1].
Anisotropic thermal expansion is a major source of shape distortion in the manufacturing of textile composites making it important to be able to accurately predict the coefficient of thermal expansion (CTE), particularly for sheared textiles (representing deformation during
Proceedings of the 1st International Conference on Digital Technologies for the Textile Industries
composite forming). Khoun et al. developed a finite element unit cell modelling method for predicting CTEs of 4-ply twill fabric laminate composites[2]. This gave a large difference (100% error) between the prediction and the experimental data, possibly arising from the accuracy of the geometric model. This paper describes how key features of sheared fabrics have been identified and used to generate more realistic models. For both 3D textiles and 2D sheared textiles these characteristics have been incorporated into TexGen[3], the open source textile geometry modelling software developed at the University of Nottingham, enabling realistic models to be generated quickly and easily.
2. 3D textile modelling
The work on modelling of 3D textiles within TexGen was undertaken in two stages. First a „3D Wizard‟ was created in the user interface which uses the underlying TexGen functionality to create generalised orthogonal, angle-interlock and layer-to-layer textiles and then a „refine‟ option was added to the orthogonal weave based on geometric characteristics extracted from µ-CT data of a fabric supplied by 3TEX, Inc.
2.1 Weave pattern generation using the TexGen 3D wizard
A series of dialog boxes allows the number of warp and weft yarns to be input, as well as the number of layers of each and the ratio of binder to warp yarns. The width, height, spacing and cross-sectional shape can be specified for each set of yarns. The yarn cross-sections are approximated by power ellipses (Eqs. 1 and 2), which are generalized ellipses where the y coordinate is assigned a power n to make the section resemble a rectangle with rounded edges when n < 1 or a shape similar to a lenticular cross-section when n > 1. They are special cases of the superellipse described by Gabriel Lamé [4].
1 0 ) 2 cos( 2 )
(v w v v
C x
(1) 1 5 . 0 )) 2 sin( ( 2 5 . 0 0 ) 2 ( sin 2 ) ( v if v h v if v h v C n n y (2)
where w is yarn width and h is yarn height.
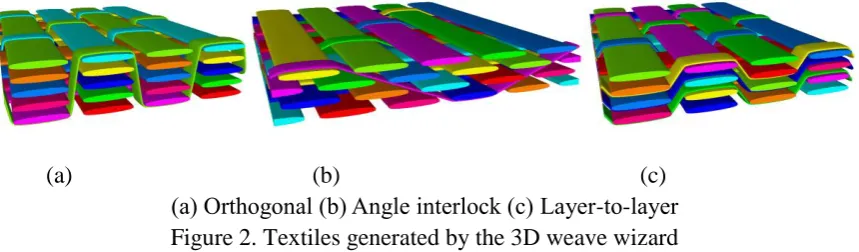
The subsequent weave pattern dialog allows for simple specification of the required weave pattern. In the case of the orthogonal weave, clicking on the binder/weft intersections toggles the binder between the top and bottom position on the textile as shown in Figure 1. The weave wizard then automatically generates the weave pattern, adding nodes on the yarn paths at each crossover point between warp/binder and weft yarns. Extra nodes are then positioned along the binder yarns to follow the contour of the outer weft yarns.
Figure 1. TexGen 3D Wizard: Orthogonal weave pattern dialog
[image:3.595.91.521.326.452.2](a) (b) (c) (a) Orthogonal (b) Angle interlock (c) Layer-to-layer Figure 2. Textiles generated by the 3D weave wizard
2.2 Orthogonal weave refinement
Without further modification, the idealised yarn paths and cross-sections may result in intersections between the warp and weft yarns and the through thickness binder yarns, particularly for tight orthogonal weaves. These intersections may cause problems during simulation; more realistic modelling of the textile will both reduce the intersections and improve simulation results. A carbon fibre orthogonal weave with the specifications listed in Table 1 was used as an example. The internal geometry of composites with this orthogonal weave as reinforcement was characterised thoroughly at different compaction levels by -CT analysis. The geometrical parameters extracted from the analysis are assumed to be applicable for generating predictive geometrical models of similar composites without the need for detailed measurement.
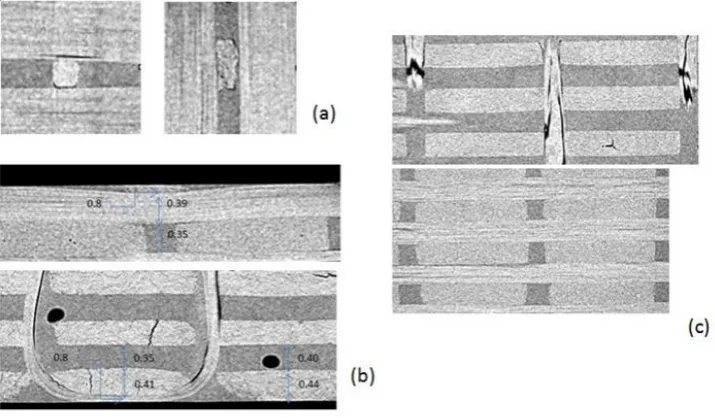
On examination of the µ-CT images it is apparent that, even in the uncompacted fabric shown in Figure 3, the cross-sections of the outer weft yarns differ from those in the middle of the fabric. A “refine” option has, therefore, been implemented for the case of orthogonal weaves in order to model the geometry more realistically both in their uncompacted and compacted states. Throughout the process the intra yarn volume fractions are monitored so that they are maintained within realistic limits. To facilitate this, yarn properties are required as input for the warp, weft and binder yarns.
Table 1. Specifications of 3D reinforcement supplied by 3TEX, Inc
Fabric style Orthogonal weave
Areal density (kg/m2) 4.775
Number of warp layers 6
Warp yarn 12K
Warp yarn linear density (g/km) 800
Number of weft layers 7
Weft yarn 6K × 2
Weft yarn linear density (g/km) 800
Binder yarn 1K
[image:4.595.201.406.286.424.2] [image:4.595.123.481.481.690.2]Binder yarn linear density (g/km) 67
Figure 3. µ-CT image of uncompacted 3TEX, Inc fabric
a) Binder cross-sections (b) surface yarn crimp (c)Upper:- warp cross-sections of rectangular shape, Lower: power elliptical weft cross-sections .
The refinement is carried out in a series of steps as follows:
1. Change the cross-sections of the through-thickness binder yarns, if necessary, to fit into the available through-thickness spaces between warp and weft yarns, corresponding to the changes observed in the central yarns in Figure 4(a).
2. Adapt heights of the warp and weft middle layers to model compaction on mould closure. An initial check of the space available will show whether it is possible to achieve a volume fraction for the yarn below the maximum specified. If not then TexGen will flag an error stating that the thickness requested cannot be achieved without exceeding that maximum. It has been observed that the height of these yarns reduces in proportion to the total initial thickness of warp and weft layers. The height of the yarns is reduced accordingly and then the width increased so as to maintain the original volume fraction. If this cannot be achieved then the power of the power ellipse section used is increased, thus increasing the area, potentially to a rectangular section filling the space available as seen in Figure 4(c).
3. Change cross-sections of the outer weft yarns to give a section which more accurately represents the real textile, at the same time reducing the height to reflect the requested compaction. Where necessary the height is reduced further to allow for the thickness of the binder yarn which is similarly reduced and incorporated into the height available for the weft yarn.
4. Change the outer binder yarn cross-sections to give a section which is flat on the outer surface. The widths of the binder yarns are increased as necessary to maintain the volume fraction. If the required height cannot be achieved then, if possible, the height of the weft yarn is reduced further. Failing this, crimp is introduced into the weft yarn to achieve the overall textile thickness and the cross-section of the warp yarn below is adjusted to remove resultant intersections in the yarns, thus implementing the features observed in Figure 4(b).
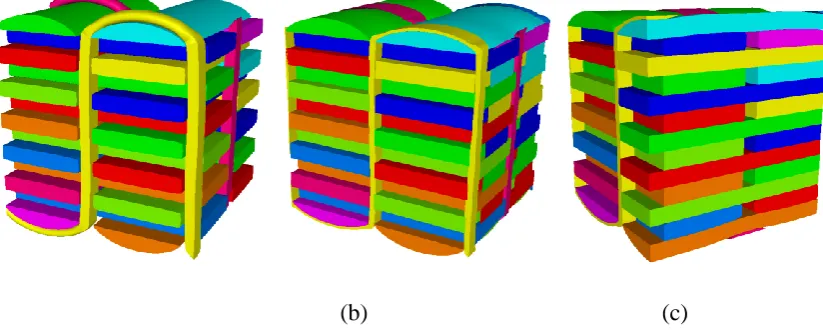
(a) (b) (c)
[image:5.595.98.510.479.644.2](a)original fabric thickness, 6.315mm (b)thickness 5.03mm (c)thickness 4.432mm. Figure 5. Orthogonal weave generated using 3DWizard refine option
degree of compaction. Comparison with the µ-CT images shows that, based on the assumptions mentioned above, TexGen is capable of modelling the geometry realistically down to a fabric thickness of 5.03 mm (Vf = 55 %). At a higher compaction level (thickness 4.432 mm),
deviations between the TexGen model and the real geometry occur, noticeably in surface yarn cross-sections. Manual modification is required in this case.
3. Sheared textile modelling
3.1 Geometric description of fabric shear
When fabric undergoes in-plane shear beyond the locking angle, where lateral contact between the yarns begins to occur, the non-linearity of deformation arises from axial tension and transverse compaction, which are governed by elastic properties and contacts of yarns. In this case a mechanical model is appropriate to determine the deformed geometry. Meanwhile, for shear well below the locking angle, the changes in a fabric are predominantly due to geometric constraints, causing (1) re-orientation of tow path; (2) rotation of tow cross-section; (3) slight change of cross-section shape. These changes can be approximated by a geometric approach, without resorting to an expensive finite element model. A simplistic approach is described here to represent fabric shear based on the following principles and assumptions (P&A):
(i) Total volume of yarns, as well as overall fibre volume fraction, is constant for fabric subjected to shear smaller than the locking angle;
(ii) Either warp or weft yarn path is re-oriented by a shear angle β;
(iii) Rotation of yarn cross-section is due to tangential contact of two yarns;
(iv) Change of yarn cross-section shape is to avoid yarn intersection and to conserve total volume.
(a) (b)
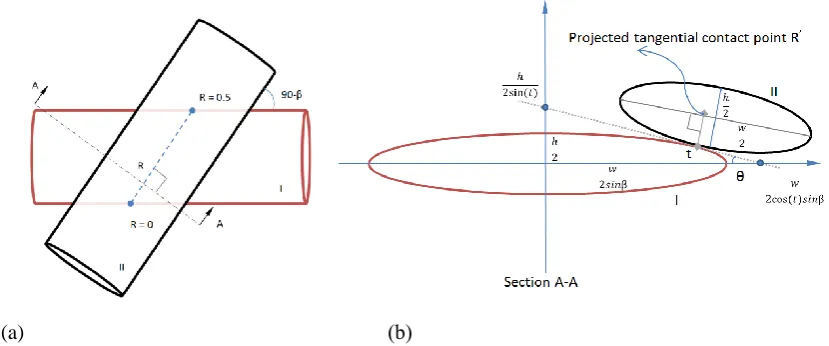
Figure 6. (a) Two identical elliptical cylinders I & II crossing over each other; (b)
Surface tangent between two ellipses at Sectional view A-A of (a)
.
Figure 6(a) idealises two initially perpendicular yarns subjected to a shear angle β. According to P&A (ii), Yarn II is re-orientated at an angle (90- β) to Yarn I.
[image:6.595.98.513.464.637.2]Yarn I and II (where R is a normalised length, 0 < R < 0.5, Figure 6(a)), a sectional view A-A in Figure 6(b) illustrates the tangential relationship of two elliptical cross-sections to determine the rotational angle θ. The parametric equations of Ellipse I are
𝑥 = 𝑤
2𝑠𝑖𝑛𝛽cos 𝑡
𝑦 =ℎ2sin 𝑡 (3)
The eccentricity parameter t in Eq(3) can be expressed in terms of the contact point at distance R along the axis of yarn II:
cos 𝑡 = 1 − 4𝑅 (4)
The tangential angle would be around 90 degrees at the contact regions near R = 0 and R = 0.5. Hence the projected tangential contact point 𝑅′ is taken in a distance from the contact point R. After testing on a range of textiles, the distance at 1/10th of the yarn width w from R was found to give good results across the range and this is the value which has been used in the implementation in TexGen.
This gives:
𝑅′ = 𝑅 + 𝑤 10 sin 𝛽
2𝑤 = 𝑅 + 1
20sin 𝛽 𝑤ℎ𝑒𝑛 0 ≤ 𝑅 ≤ 0.25
𝑅′ = 𝑅 − 𝑤 10 sin 𝛽
2𝑤 = 𝑅 − 1
20sin 𝛽 𝑤ℎ𝑒𝑛 0.25 ≤ 𝑅 ≤ 0.5 Substitute 𝑅′ in Eq (4),
cos 𝑡 = { 1 − 4𝑅 − 1
5sin 𝛽 𝑤ℎ𝑒𝑛 0 ≤ 𝑅 ≤ 0.25
1 − 4𝑅 +15sin 𝛽 𝑤ℎ𝑒𝑛 0.25 ≤ 𝑅 ≤ 0.5 (5)
The tangential angle θ is calculated based on the intersection point with axes X and Y, shown in Figure 6(b),
sin 𝜃 = tan 𝜃
√1+tan2𝜃= ±
1
√1+(ℎ𝑠𝑖𝑛𝛽𝑤 )2tan2𝑡= ±
1
√1+(ℎ𝑠𝑖𝑛𝛽𝑤 )2( 1
cos2 𝑡−1)
(6)
By substituting cos(t) from Eq (5) into Equation (6), the rotational angle can be determined at any contact point along the yarn path.
3.2 Automation of shear textile modelling in TexGen
In order to simplify and automate geometric modelling of sheared textiles, an extension to the automated “2D wizard” has been implemented in TexGen. Selection of the „Shear Textile‟ option allows a shear angle to be entered and also enables the option to create a sheared domain. The weave pattern is specified in a second wizard dialog, after which the textile is automatically generated. Nodes are generated on the yarn paths at each crossover point between warp and weft yarns; spacings are adjusted according to the shear angle. At this stage the geometry is idealised with all yarns having constant, elliptical cross-sections.
interpolation to allow multiple cross-sections along the yarn length, thereby allowing changes in cross-section along the yarn. The cross-section at each node along the yarn is initially set to the original elliptical cross-section.
Four extra cross-sections are inserted, giving five equispaced sections with values of R, as specified in section 3.1, from 0.005 to 0.495 (including the section at the node where R=0.25). The rotation at each of these sections is shown in Figure 7(a) and can be seen in Figure 7(b) where two of the yarns have been removed for clarity.
Figure 7. (a) Yarn rotations for different values of R; (b) Rotated yarns in plain weave textile
Based on P&A (iv) stated in section 3.1, changes are made to the yarn cross-section shape to minimise any remaining interference between yarns. This is realised using the CorrectInterference function within the 2D wizard. This function finds intersections between lines joining the centre and points around the edge of a section and surface meshes of adjacent yarns. The function returns a modifier which corresponds to the depth of the intersection. The correction is applied at each of the cross-sections along the yarn by adjusting each point around the circumference individually by its modifier. The new set of points is then used to form a polygonal section which replaces the original elliptical one.
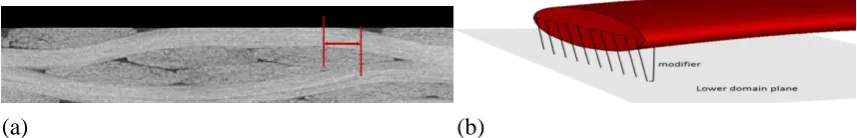
It has been observed that in real textiles the surface yarns tend to flatten and that there is an offset between the centre of one yarn and the point at which the surface yarn passing over it drops away, shown in Figure 8(a). In the automatically generated, unrefined, TexGen model the surface tow would drop away immediately from the node over the centre of the yarn, following the contour of the yarn it crosses. Also, where interference has been corrected there will have been loss of volume in the yarns which would result in decreased volume fraction of the textile.
(a) (b)
Figure 8. (a) Tow drop offset; (b) Intersection of section points with bottom domain plane
In order to address both of these issues an algorithm has been developed which allows the yarn to be expanded at each cross-section. It is assumed that each yarn is constrained to lie within the fabric thickness specified in the wizard. For each section a set of modifiers are calculated based on the intersection between a line perpendicular to the centreline of the polygon, passing through one of the points on the perimeter, and either the upper or lower plane parallel to the z axis and specified by the thickness. This is shown in Figure 8(b). A modifier of
[image:8.595.91.518.177.289.2] [image:8.595.89.518.572.641.2]less than unity indicates that the yarn exceeds the fabric thickness at this point. In this case the modifiers are applied at these points immediately, thus constraining the yarn to the specified fabric thickness. An iterative method is then used to expand the points on the polygon along the line of each modifier using the original area of the yarn as a constraint. The maximum extension for each line is given by its intersection with the horizontal plane and this is used as a second constraint. If the shape is extended to the maximum for all points and the area is less than the original area an error message is issued. An extension to this would be to use yarn parameters to check the volume fraction given by the smaller shape to see if this is within acceptable bounds.
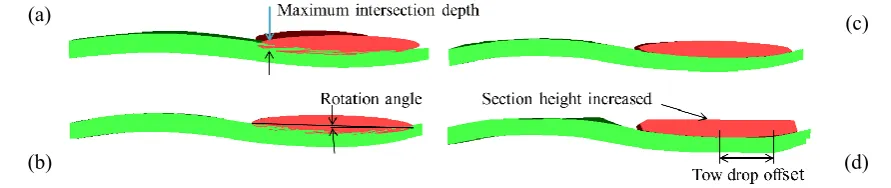
(a) Unrefined (b) Rotation only (c) Rotation and intersection correction (d) Rotation,
[image:9.595.81.527.215.309.2]intersection correction and adjusted section height
Figure 9. Refinement stages
Figure 9 shows a pair of crossing yarns at different stages of the build textile process. Figure 9(a) shows the yarns before refinement with a greater intersection depth towards the left of the upper yarn. After rotation, Figure 9(b), the size of the maximum intersection is reduced and the intersections are more evenly distributed. In this example the combined heights of the yarns are less than the fabric thickness resulting in the remaining intersections. Where this is not the case the remaining intersections will be significantly reduced at this stage. Intersection correction removes these intersections, Figure 9(c), but results in loss of volume from the yarn. The final stage of the refinement, Figure 9(d) increases the height of the upper yarn, in this case to the limit specified by the overall fabric thickness. The side view of the lower yarn shows the tow drop offset produced by the height adjustment at different sections along the yarn.
4. Case studies
4.1 Permeability prediction for 3D woven fabric
3D woven fabric as dry fibre reinforcement is infused with resin and cured into composites parts by liquid moulding processes. In order to design and optimise resin flow within complex parts, this manufacturing route requires permeability of fibre reinforcement as an essential material property. Numerical prediction of permeability has the advantage of being cost effective and reliable for composites processing design.
As described in the previous section, the TexGen 3D Wizard creates realistic geometric models of 3D woven fabric by taking into account compaction during the liquid moulding process. Two fabric models with thickness 5.03mm (Fibre volume fraction Vf=0.55) and 4.43mm (Vf = 0.67) are presented here to simulate different levels of compression. The models were uniformly discretised into brick-like hexahedral elements and exported for CFD analysis. To represent the liquid moulding conditions, Navier-Stoke laminar flow was simulated with small Reynolds number. Translational periodic boundary conditions were applied for cross-section planes in warp and weft directions; non-slip walls were applied on yarn interface
(b)
(a) (c)
and through-thickness surfaces. Simplification was also made to neglect flow into porous yarns. The simplifications were justified, by extensive numerical simulations to compare seemingly more realistic yet computationally intensive set-ups where yarns were modelled as a porous medium with a partial slip interface at the yarn surface. Mesh sensitivity was investigated by meshing the unit cell up to 27 million elements (300x300x300). A converged solution was found at around 8 million elements (200x200x200).
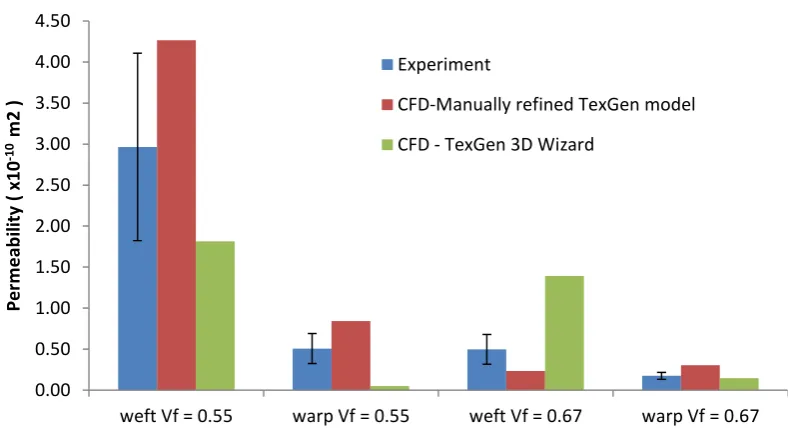
[image:10.595.108.507.301.516.2]As results from the CFD analysis, Figure 10, permeability predictions from the TexGen 3D Wizard models are plotted together with the experimental data. The CFD predictions are also presented for manually modified TexGen models. The two versions of TexGen models were defined from the same set of basic parameters, but with some differences in local refinement. The permeability predictions were considered to be a good approximation, given that the large variability of fibre architecture gives rise to a large standard deviation in measured permeability. The two versions of the deterministic geometric models yielded predictions close to the upper or lower bound of measured permeability. This suggests that the real permeability can be captured by a minimum set of unit cell models with well-defined local variability.
Figure 10. Numerical prediction of permeability based on TexGen geometric models for 3D
woven fabric under different level compaction.
4.2 Thermal expansion of sheared fabric laminate
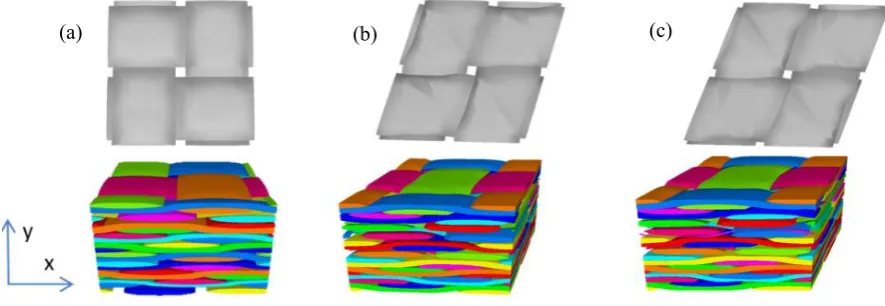
For three laminates with plies of non-sheared, 16° shear and 20° shear, unit cells were first generated by the TexGen 2D Wizard as single plies, shown in Figure 11 Upper. The importance of finite laminate thickness and random nesting was recognized in the test materials, hence ten plies of fabric were collated with randomness in both warp and weft directions, sampled by a Latin Hypercube method[5], shown in Figure 11 Lower. The periodicity was removed in the thickness direction for these unit cells, while maintaining the in-plane periodic boundaries. A sheared unit cell was automatically generated by TexGen, discretised into uniform parallelepiped shaped hexahedral elements. Periodic boundary conditions were formulated by applying translational symmetry derived from a generic form[6].
0.00 0.50 1.00 1.50 2.00 2.50 3.00 3.50 4.00 4.50
weft Vf = 0.55 warp Vf = 0.55 weft Vf = 0.67 warp Vf = 0.67
Per
m
e
ab
ili
ty
(
x10
-1
0
m
2 )
Experiment
CFD-Manually refined TexGen model
Figure 11. Unit cells representing single ply (upper) and 10-ply laminates (lower) with each ply of (a) non-shear, (b)16° shear and (c)20° shear.
[image:11.595.82.498.447.580.2]The finite element analysis was performed in ABAQUS with the converged mesh size (100x100x200 elements). The CTE predictions are listed together with the experimental data in Table 2. Both the experimental and numerical data of CTEs shows increasing anisotropy for increasing degrees of shear. A consistently good match within 5% error was found between the unit cell predictions and the experiments for the laminates with non-shear and 20° shear plies. In the case of the 16° shear laminate, the discrepancy is slightly higher at 12.9%. A plausible explanation of the difference could be due to error at the manufacturing stage. It was possible that 16° shear angle was not achieved due to fabric relaxation before consolidation. Consequently the measured CTE was lower than the expected value with a fixed shear angle of 16°.
Table 2. Comparison of predicted CTEs with the experimental data
CTE (x10-6 /K) Non-shear 16° shear 20°shear
α
xx 2.170 1.422 1.240
αyy 2.160 4.960 6.420
αxy 0.0071 12.40 14.240
Prediction 2.171 in x 2.97 in x 3.02 in x 8.20 in y
Experiment 2.12 2.63 2.99 8.46
Error (%) 2.4 12.9 1.0 -3.1
5. Conclusions
Key geometric features have been identified for both 3D orthogonal and sheared 2D weave reinforcements. For the example of a 3D orthogonal weave reinforcement, the geometry of the composites was characterised in detail by -CT image analysis and this information was used to apply refinements to an idealized model. Basic principles and assumptions were used to refine a 2D plain weave geometry to simulate shear deformation. In both cases these features were automated in TexGen to ensure consistency as well as ease of geometric modelling.
Based on these models, CFD simulations of impregnating flow and thermo-mechanical finite element analysis were carried out for the prediction of in-plane permeability of a 3D orthogonal fabric and the CTE prediction for a 2D sheared plain weave fabric respectively. Permeability results for the 3D orthogonal weave yielded predictions close to the upper or lower bound of measured permeability. At high levels of compaction the automatically
generated model may show deviations from the real geometry, particularly at the upper and lower surfaces, requiring some manual modification. A correlation was established and validated between the anisotropic CTE tensor and the measured CTE data from small laboratory coupons for a range of shear angles for 2D plain weave textiles.
ACKNOWLEDGEMENTS
This work was supported by the Engineering and Physical Sciences Research Council [grant number: EP/IO33513/1], through the EPSRC Centre for Innovative Manufacturing in Composites.
References
1. Xuesen Zeng, L.P.Brown, Andreas Endruweit, Andrew C. Long. Advanced Geometry Modelling for 3D Woven Fabrics and its Application in Permeability Prediction. in The 4th World Conference on 3D Fabrics and Their Applications. 2012. RWTH Aachen, Germany.
2. Khoun, L., K. Challagulla, and P. Hubert, Thermo-mechanical properties of 5-harness satin fabric composites. Journal of Composite Materials, 2012. 46(25): p. 3121-3136.
3. Long, A.C. and L.P. Brown, Modelling the geometry of textile reinforcements for composites: TexGen, in Composite reinforcements for optimum performance P. Boisse, Editor 2011, Woodhead Publishing Ltd.
4. Weisstein, E.W. and "Superellipse." From MathWorld--A Wolfram Web Resource. http://mathworld.wolfram.com/Superellipse.html
5. McKay, M.D., R.J. Beckman, and W.J. Conover, A Comparison of Three Methods for Selecting Values of Input Variables in the Analysis of Output from a Computer Code. Technometrics, 1979. 21(2): p. 239-245.
6. Li, S., C.V. Singh, and R. Talreja, A representative volume element based on translational