Fehmi Ben Abdesslem, Iain Parris, and Tristan Henderson
Large quantities of information are shared through online social networks, making them attractive sources of data for social network research. When studying the usage of online social networks, these data may not describe properly users’ behaviours. For instance, the data collected often include content shared by the users only, or content accessible to the researchers, hence obfuscating a large amount of data that would help understanding users’ behaviours and privacy concerns. Moreover, the data collection methods employed in experiments may also have an effect on data reliability when participants self-report inacurrate information or are observed while using a simulated application. Understanding the effects of these collection methods on data reliability is paramount for the study of social networks; for understanding user behaviour; for designing socially-aware applications and services; and for min-ing data collected from such social networks and applications.
This chapter reviews previous research which has looked at social network data collection and user behaviour in these networks. We highlight shortcomings in the methods used in these studies, and introduce our own methodology and user study based on the Experience Sampling Method; we claim our methodology leads to the collection of more reliable data by capturing both those data which are shared and not shared. We conclude with suggestions for collecting and mining data from online social networks.
1 Introduction
An increasing number of Online Social Network (OSN) services have arisen re-cently to allow Internet users to share their activities, photographs and other content with one another. This new form of social interaction has been the focus of much re-School of Computer Science, University of St Andrews
{fehmi,ip,tristan}@cs.st-andrews.ac.uk
The original publication is available at http://www.springerlink.com/
cent research aimed at understanding users’ behaviours. In order to do so, collecting data on users’ behaviour is a necessary first step. These data may be collected: (i) from OSNs, by retrieving data shared on social network websites; (ii) from surveys, by asking participants about their behaviour; (iii) through deployed applications, by directly monitoring users as they share content online.
The first source of data, OSNs, contains large quantities of personal information, shared everyday by their users. For instance, Facebook stores more than 30 billion pieces of new content each month (e.g., blog posts, notes, photo albums), shared by over 500 million users.1These data not only provide information on the users themselves, but also describe their social interactions in terms of how, when and to whom they share information. Nevertheless, while collecting the data available from OSNs can help in studying users’ social behaviour, the content made available may often be filtered beforehand by the users according to their particular preferences, resulting in important parts of data being inaccessible to researchers. When study-ing users’ behaviour, ignorstudy-ing privacy choices by discardstudy-ing these inaccessible data may lead to a biased analysis and a truncated representation of users’ behaviour. Including personal information that the users do not want to share may be vitally important, for instance, if privacy concerns are the focus of one’s research.
The second source of data for studying users’ behaviour consists of asking users how, when, and to whom they would share content using, for instance, question-naires. When using such survey instruments, however, participants might forget the particular context in which they share content in their everyday lives, and thus end up unconsciously providing less accurate data on their experiences. Conducting sur-veysin situallows researchers to overcome this issue: participants are asked to re-port their experiences in real-time whenever they interact with the observed system; in this case, when they use an OSN. But for ease of implementation or to allow con-trolled studies, in situ research surveys often involve simulated interactions with the participants’ social networks. If a participant knows that their content will never ac-tually be shared, or that their interactions are simulated, then the resulting data may also be biased, as the users’ behaviour might have been primed by the simulation.
Finally, deploying a custom application is the third source of data. This method usually consists in collecting data by deploying a custom application used by partic-ipants to share content on OSNs. This method provides more flexibility to monitor users’ behaviour in situ, and the content that participants do not share to their social network can still be collected by the researchers.
First, commonly used data collection methods are described in Section 2. Section 3 details our methodology for collecting more reliable data. Finally, we provide our guidelines to collect more reliable data by discussing methods and their implications in Section 4.
2 Existing data collection methods
Many researchers have collected data from OSNs and mined these data to better understand behaviour in such networks. There are many different types of data and collection methods that can help in studying OSN users’ behaviour. These data often describe different aspects of user behaviour and can be complementary. This section provides an overview of recent research in collecting data about online social net-works and their users.
2.1 Social network measurement
Most OSN providers are commercial entities and as such are loathe to provide re-searchers with direct access to data, owing to concerns about competitive access to data, and also their users’ privacy concerns.2Hence, researchers often collect their own data directly from OSNs, either by collecting data directly from the OSN, or by sniffing the network traffic and parsing the data to and from the OSN.
2.1.1 Collecting social network content
The most common way to collect content from OSNs is to use the API (Application Programming Interface) provided by the OSN provider. Relevant queries are sent to the OSN with the API to collect data. Where data available on the website are not available through the API, an alternative method is to crawl the OSN website with an automated script that explores the website and collects data using HTTP requests and responses. OSN research usually employs one of these two methods to collect data, but for very different purposes.
Content-sharing behaviour
Facebook profiles of 237 students to study the correlation between quantity of pro-file information and personality. Lewis et al. [28] collect Facebook public propro-file data from 1,710 undergraduate students from a single university and study their pri-vacy settings. Lindamood and Kantarcioglu [29] collect the Facebook profiles of 167,390 users within the same geographical network by crawling the website. Their goal is to evaluate algorithms to infer private information.
OSN usage
Data collection is also useful for studying aspects of OSN usage, such as session lengths or applications. Gjoka et al. [16] characterise the popularity and user reach of Facebook applications. They crawl approximately 300,000 users with publicly-available profiles. Nazir et al. [32] developed three Facebook applications and study their usage. Gyarmati and Trinh [18] crawl the websites of four OSNs, Bebo, MyS-pace, Netlog, and Tagged, retrieving publicly available status information, and study the characteristics of user sessions of 80,000 users for more than six weeks.
Comparison between OSN data and other sources
Data shared on OSNs are also collected to be compared to other sources of informa-tion. For instance, Qiu et al. [35] use the Twitter API to collect tweets that contain mobile performance related text, and compare them with support tickets obtained from a mobile service provider. Guy et al. [17] collect social network data from 343 OSN users of a company intranet, and compare their public social networks to their email inboxes.
Interaction between users
OSN characteristics
Many other researchers study the properties of OSNs, such as the number of active users, users’ geographical distribution, node degree, or influence and evolution. This research is not focused on the behaviours of users as individuals, but rather on the behaviour of the network as a whole. Cha et al. [7] collect 2 billion links among 54 million users to study people’s influence patterns on the OSN Twitter. They use both the API and website crawling to collect this data. Garg et al. [13] examine the evolution of the OSN FriendFeed by collecting data on more than 200,000 users with the FriendFeed API, along with close to four million directed edges among them. Rejaie et al. [36] estimate the size of active users on Twitter and MySpace by collecting data on a random sample of users through the API. Ye et al. [46] crawl Twitter user accounts to validate their method to estimate the number of users an OSN has. Java et al. [21] study the topological and geographical properties of the social network in Twitter, and examine users intentions when posting contents. They use the API to collect 1,348,543 posts from 76,177 distinct users over two months. Ghosh et al. [14] study the effects of restrictions on node degree on the topological properties of Twitter, by collecting data from one million Twitter users with the API, including their number of friends, number of followers, number of tweets posted and other information such as the date of creation of the account and their geographical location.
2.1.2 Measuring social network activity
2.2 Self-reported data
Where data cannot be collected or interpreted from the OSNs, another useful method is to directly ask the users about their experience, mainly through online question-naires, or in situ surveys.
Questionnaires and focus groups
There is a plethora of studies on OSN users’ behaviour involving online question-naires and focus groups. Besmer and Lipford [5] collect data from 14 people through focus groups to examine privacy concerns surrounding tagged images on Facebook. Brandtzæg and Heim [6] collect data about 5,233 people’s motivations for OSN us-age through an online survey in Norway. Ellison et al. [11] measure psychological well-being and social capital by collecting data through an online survey from 286 students about their Facebook usage and perception. They were paid 5 USD credit on their on-campus spending accounts. Krasnova et al. [24] collect data from two focus groups and 210 OSN users through online surveys to study privacy concerns. Kwon and Wen [25] use an online survey to study the usage of 229 Korean OSN users. Lampe et al. [26] study changes in use and perception of Facebook by col-lecting data on 288, 468 and 419 users respectively in 2006, 2007 and 2009 through online surveys. Peterson and Siek [34] collect data on 20 users of the OSN couch-surfing.com to analyse information disclosure. Roblyer et al. [37] survey 120 stu-dents and 62 faculty members about their use and perception of Facebook in class. Stutzman and Kramer-Duffield [40] collect data with an online survey on 494 un-dergraduate students and examine privacy-enhancing behaviour in Facebook. Young and Quan-Haase [47] collect data on 77 students with an online survey about their information revelation on Facebook.
In situ data collection
mobile phone by asking 6 participants to answer questions every time they perform an action on Facebook, such as adding a friend, or updating a status.
ESM has also been used by researchers to study other topics than social networks. Consolvo et al. [9] ask participants 10 times a day during one week about their in-formation needs and their available equipment (e.g., televisions, laptops, printers). Questions are asked through a provided PDA, and participants are required to an-swer through this same device. They receive an incentive of 50 USD for their partic-ipation, and 1 USD per question answered. Froehlich et al. [12] propose MyExperi-ence, a system for mobile phones to ask participants about their in situ experience. They deploy their system for three case studies. These deployments range from 4-16 participants and 1-4 weeks, and cover: battery life and charging behaviour, text-messaging usage and mobility, and a study on place visit pattern and personal preference.
2.3 Application deployment
Another method for collecting data is to deploy a custom application based on a so-cial network and monitor its usage. Iachello et al. [20] study the location-sharing be-haviour of eight users. Participants use a mobile phone for five days and share their location by text message upon request from the other participants. Kofod-Petersen et al. [23] deploy a location-sharing system over three weeks in a three-storey build-ing durbuild-ing a cultural festival. 1,661 participants use ultrasound tags to be located, and several terminals are also distributed throughout the building. Sadeh et al. [38] deploy an application that enables cell phone and laptop users to selectively share their locations with others, such as friends, family, and colleagues. They study the privacy settings of over 60 participants.
2.4 Challenges in data collection
Various methods have thus been employed for a broad range of studies. Neverthe-less, while they all present benefits and provide useful data, these various methods also raise challenges that need to be addressed.
2.4.1 Private information
Most of the time, researchers disregard inaccessible data or even users with pri-vate data. For instance, Garg et al. [13] examine the evolution of an online social aggregation network and dismiss 12% of the users, because they had private profiles. For these users, authors were not able to obtain the list of users they follow on Twit-ter, and any other information pertaining to their activities. Gjoka et al. [15] study sampling methods by collecting data on more than 6 million users by crawling the websites, but the authors had to exclude from their dataset users hiding their friend lists. Lewis et al. [28] study OSN users’ privacy by only collecting data on public profiles. Nevertheless, while collecting data on private contents is particularly im-portant when studying privacy, 33.2% of the set had private profiles that could not be included in the data.
Researchers have occasionally resorted to tricks to access data about users. For instance, a common way to access users’ Facebook profiles was to create accounts within the same regional network3than the target profiles. [45, 29, 43] Since mem-bership in regional networks was unauthenticated and open to all users, the majority of Facebook users belonged to at least one regional network. [45] And since most users do not modify their default privacy settings, a large portion of Facebook users’ profiles could be accessed by crawling regional networks. But this trick still did not allow to access all the profiles, as some privacy-sensitive users may have restricted access. Another trick is to log in to Facebook with an account belonging to the same university network as the studied sample. Lewis et al. [28] collect data on under-graduate students from Facebook by using an underunder-graduate Facebook account to access more data. Profiles can also be accessed by asking target users for friend-ship. Among 5,063 random target profiles, Nagle and Singh [31] were able to gain access to 19% of them after they accepted friend requests. They asked 3,549 of this set’s friends for friendship, and 55% of them accepted, providing them with access to even more profiles. But when studying privacy concerns, the set of profiles that have been accessed may be biased, as they belong to users who accept unknown friendship requests.
Even when the information is available to the researchers, knowing to whom information is accessible is essential to understand users sharing behaviours. For instance, Amichai-Hamburger and Vinitzky [1] collect data from Facebook profiles and correlate the amount of information shared to users personality, but they do not take into account privacy settings of profile information: they make no difference between information shared to everyone, and information shared to a restricted sub-set of people.
2.4.2 Inaccuracy of self-reported information
haviour. For instance, Young and Quan-Haase [47] conducted a survey about infor-mation revelation on Facebook. They also interviewed a subset of the participants, and asked them to log on Facebook. The profile analysis showed that the partici-pants are often unaware of, or have forgotten, what information they have disclosed and which privacy settings they have activated.
2.4.3 The effects of using simulated applications
Researching user behaviour in online social network systems becomes more chal-lenging if studying a system that does not yet exist, as it is not possible to mine data which have not yet been created. For instance, one might want to study behaviour in location- and sensor-aware social networks, which are only just becoming popular. One approach would be to build the real system, and then study how people use it. When such a system is difficult to build, an alternative is to simulate the system. This consists in creating a simulated prototype with limited (or no) true functional-ity, then examine user behaviour of this prototype.
One potential pitfall is realism of the simulated system. For example, Consolvo et al. [8] investigate privacy concerns in a simulated social location-tracking appli-cation, employing the Experience Sampling Method to query participants in situ. [9] They note this very problem with simulation, revealed through post-experiment in-terviews. Unrealistic, “out-of-character” simulated location requests were rejected by at least one participant.
A second possible pitfall, of particular relevance to studying social networks, is that the lack of real social consequences may affect behaviour. Tsai et al. [41] exam-ine the effect of feedback in a real (i.e., non-simulated) location-sharing application tied to Facebook. Feedback, in the form of a list of viewers of who had viewed each published location, was found to influence disclosure choices. Although they do not investigate a simulated application, the fact that real feedback has an effect may mean that simulated feedback (e.g., using a randomly-generated list of view-ers) could also affect behaviour in a different way.
To summarise, existing methods are all useful to can capture particular aspects of users’ experience, but may also lead to biased data collection. We believe that more reliable data can be obtain by using a new methodology based on the combination of existing methods: this way, the data collected come from different sources and describe better users’ behaviours.
3 Experience Sampling in Online Social Networks with
Smartphones
for collecting more reliable data on users’ behaviours and demonstrate how we col-lected more reliable data by implementing this methodology through a set of real-world experiments.
3.1 Methodology
Our methodology consists of observing how users share their location with an OSN using smartphones carried by users. In doing so, we are able to combine in situ data collection with OSN monitoring, thus collecting more reliable data on the sharing behaviour of OSN users.
3.1.1 Design
We combine existing methods as described in Section 2 to gather more complete and reliable data about users’ behaviour. More precisely, our methodology comprises the following features:
• Passive data collection.We collect data from a custom application, and do not rely only on self-reported information from the users (through questionnaires and interviews). The main reason is not only that collecting data in a passive way avoids disturbing the users, but also that data gathered from real applications of-ten describe objective and accurate information on users’ behaviours. Hence, our methodology includes passive data collection from a social network application. • Private content collection.While many previous methodologies only gather data about publicly-shared content on OSNs, we advocate collecting data about both shared and unshared content. To collect data on this private information, we first automatically collect some content (or suggest the user to share content) and then ask the user whether this content should be shared or not. The users’ responses are collected and provide information on what content are shared and what con-tent is not.
• In situ self-reported data collection. Data collected passively may be difficult to interpret. Asking questions directly to the users can provide more information and context about the data and helps understanding why and to whom the content has been shared (or not). Hence, our methodology also includes self-reported data collection. For these data to be more reliable, questions are asked of the users and replied in situ using the ESM.
By implementing these features, our methodology avoids the shortcomings of previous methodologies as described in the last section, allowing more reliable on-line social network data collection.
We have applied this methodology for studying people’s privacy concerns when sharing their location on the Facebook OSN. Participants were given a mobile phone and asked to carry it, using an application that enabled them to share their locations with their Facebook social network of friends. At the same time as they were do-ing so, they received ESM questions about their experiences, feeldo-ings and location-disclosure choices. Implementing this methodology required the construction of an appropriate testbed and the design of an ESM study. We describe these in turn.
3.1.2 Infrastructure
The infrastructure is composed of three main elements: the mobile phones, a server, and a Facebook application.
• Mobile phone. Every participant is given a smartphone. Each phone is running an application to detect and share locations, and to allow participants to answer ESM questions.
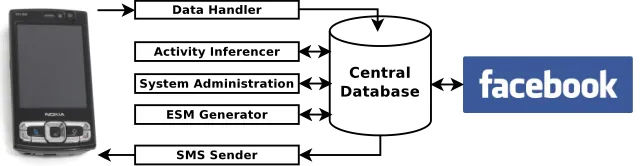
• Server. Located in our laboratory, the server is composed of different modules (as described in Figure 1) in charge of collecting data from the mobile phones, sending questions to the participants, and inferring their location or activity. • Facebook application. The Facebook application uses the Facebook API
(Ap-plication Programming Interface) to interact with the phones and the Facebook OSN. This application is also hosted on our server, which allows us to control the dissemination and storage of data, but uses Facebook to share locations with a participant’s social network of friends.
[image:11.612.149.469.456.539.2]Mobile phone
We use the Nokia N95 8GB, a smartphone featuring GPS, 802.11, UMTS, a camera, and an accelerometer. This phone runs the Symbian operating system, for which we developed a location-sharing application,LocShare, in Python. This is installed on the phones prior to distribution to participants, and designed to automatically run on startup and then remain running in the background.LocShareperforms the following tasks:
• Location detection. Where available, GPS is used to determine a participant’s location every 10 seconds. When GPS is not available (e.g., when a device is indoors), a scan for 802.11 access points is performed every minute.
• ESM questions.Questions are sent to the phone using the Short Message Service (SMS), and displayed and answered using the phone.
• Data upload.Every five minutes, all collected data, such as locations and ESM answers, are uploaded to a server using the 3G network.
To extend battery life, thus allowing longer use of the mobile phone, the location is only retrieved (using GPS or 802.11) when the phone’s accelerometer indicates that the device is in motion, as described in [3].
Server
As shown in Figure 1, the server’s role is to process data sent between the mobile phones and Facebook. This is performed using a number of separate software mod-ules.
The collected data (i.e., GPS coordinates, scanned 802.11 access points, ESM re-sponses and accelerometer data) are regularly sent by the phone through the cellular network and received by the Data Handler module, which is listening for incom-ing connections and pushincom-ing the received data directly into a central SQL database (hereafter referred to as the Central Database).
The Activity Inferencer module runs regularly on the location data in the database and detects when the user stops in a new location. The module then attempts to transform this new location into a place name or activity. This is done by sending requests to publicly-available online databases such as OpenStreetMap4to convert
GPS coordinates and recorded 802.11 beacons into places (e.g., “Library”, “High Street”, “The Central Pub”). We prepopulate the activity database with some well-known activities and locations related to the cities where the experiments takes place (e.g., supermarkets, lecture theatres, sports facilities), but by using public databases, we avoid having to manually map all possible location coordinates into places. The places or activity names can then be exploited by the Facebook application.
Sender module. The System Administration module allows remote management of the devices by sending special SMS messages handled byLocShare, for instance to reboot the mobile phone if error conditions are observed. More important, the ESM module is in charge of generating questions, according to the current location or activity of a participant, and these questions are also sent using SMS.
Facebook application
Fig. 2 The Facebook application used to share locations, collected via the mobile phones carried
by participants, with a participant’s social network of Facebook friends (a test account is displayed to respect participant anonymity). Locations and photos are visible to the participant and any other Facebook users (s)he has chosen.
The Facebook application is also hosted on our server but is used through Face-book to display locations and activities of participants to their friends, through their profile or notifications, depending on their disclosure choices (Figure 2).
3.1.3 Experience sampling
[image:13.612.139.467.218.452.2]Before the start of an experiment, participants are asked to categorise their Face-book friends into groups (or “lists” in FaceFace-book terminology), to which they would like to share similar amounts of information. Example groups might include “Fam-ily”, “Classmates”, “Friends in Edinburgh”. In addition to these custom lists, we add two generic lists: “everyone” and “all friends”, the former including all Facebook users, and the latter including only the participant’s friends. They were also asked to specify the periods of time in the week when they did not want to be disturbed by questions (e.g., at night, during lectures).
Participants are carrying the phone with them at all times. Six types of signal- or event-contingent ESM questions are then sent to the participants’ phones:
• Signal-contingent.Signal-contingent questions are sent on a predetermined
reg-ular basis: 10 such questions are sent each day, at random times of the day. 1. “We might publish your current location to Facebook just now. How do you
feel about this?”
We ask the participant about his/her actual feeling by reminding that his/her location can be published without any consent. The participant can answer this question on a Likert scale from 1 to 5: 1 meaning ‘Happy’, 3 meaning ‘Indifferent’ and 5 meaning ‘Unhappy’.
2. “Take a picture of your current location or activity!”
The participant can accept or decline to answer this question. If the participant answers positively, the phone’s camera is activated and the participant is asked to take a photograph. The photograph is then saved and uploaded later with the rest of the data. Note that the reasons for declining are difficult to determine and may not be related to privacy concerns (e.g., busy, missed notification, inappropriate location).
• Event-contingent.These questions are sent when particular events occur. Up to
10 questions per day are sent whenever the system detects that the participant has stopped at particular locations.
1. “Would you disclose your current location to:[friends list]?”
We ask the participant for the friends lists to whom he/she wants to share his/her location. We first ask if the location could be shared with ‘everyone’. If the participant answers ‘Yes’, then the question is over and the participant’s location is shared to everyone on Facebook. Otherwise, if the participant an-swers ‘No’, the phone asks if the participant’s location can be shared with ‘all friends’. If so then the question is over, and the location is shared with all of the participant’s Facebook friends. Otherwise we iterate through all of the friend lists that has been set up by the participant. Finally, sharing with ‘nobody’ implies answering ‘No’ to all the questions.
2. “You are around[location]. Would you disclose this to:[friends list]?”
This question mentions the detected place. This is to determine whether feed-back from the system makes a participant share more.
3. “Are you around[location]? Would you disclose this to:[friends list]?”
location. If the participant confirms the location, then we ask the second part of the question. Otherwise, we ask the participant to define his/her location by typing a short description before asking the second part of the question. This is to determine the accuracy of our location/place-detection.
4. “You are around[location]. We might publish this to Facebook just now. How do you feel about this?”
This question is intended to examine preferences towards automated location-sharing services, e.g., Google Latitude.5Locations are explicitly mentioned to determine whether the participants feel happier when the location being dis-closed is mentioned. Note that this question does not ask to whom the partici-pant wants the location to be shared: default settings given in the pre-briefing are used instead.
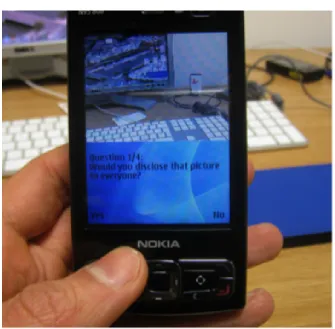
Hence, each participant is expected to answer 10-20 questions each day, depend-ing on the quantity of event-contdepend-ingent questions. In addition, the application allows participants to share photos and short sentences to describe and share their location whenever they like (Figure 3). We have designedLocShareto be fast and easy to use, so that questions can be answered by pressing only one key and avoid as much as possible disturbing the participant. Moreover, periods of time where each partic-ipant do not want to be disturbed by questions have also been taken into account (e.g., at night, during lectures).
3.2 Experiment
We ran a set of experiments in May and November 2010 using our methodology. Our focus was to better understand students’ behaviour and privacy concerns when sharing their location on Facebook.
3.2.1 Participant recruitment
We recruited participants in the United Kingdom studying in London and St An-drews to participate in an experiment. We advertised through posters, student mail-ing lists, and also through advertisements on the Facebook OSN itself. In addition, we set up a Facebook “group”, to which interested respondents were invited to join. This enabled some snowball recruitment, as the joining of a group was posted on a Facebook user’s “News Feed”, thus advising that user’s friends of the existence of the group. Such recruitment was appropriate since we were aiming to recruit heavy users of Facebook.
Fig. 3 TheLocShareapplication running on a Nokia N95 smartphone as used in our experimental testbed. The participant is asked whether he/she would share a photograph with his/her social network friends.
the main focus of the experiment, both in advertisements and information sessions. More generally, we presented the main goal of the study as being to “study location-sharing behaviour” and “improve online networking systems”.
From 866 candidates, we selected participants using the following criteria: • Undergraduate students.We only selected undergraduate students. The main
[image:16.612.134.469.86.415.2]• Facebook usage frequency.We only selected candidates claiming to use Face-book everyday. Since shared locations are disclosed on FaceFace-book, participants must actively use Facebook to see the locations shared by their friends and pos-sibly experience privacy concerns about sharing their own locations.
• Authors’ acquaintances.We only selected candidates who are not known by us, or studying in the Computer Science department. The main reason is to avoid recruiting participants who have heard about the purpose of the experiment and its privacy focus, as multiple talks have been given about the project in the Com-puter Science department, revealing the precise focus of the experiment. • Availability.We only selected candidates with the most flexible availabilities to
participate in the experiment.
From the remaining candidates, we selected randomly 81 participants, giving pri-ority to those with the most friends. These criteria were not disclosed to any of the candidates to avoid false answers. A reward of £50 was offered as compensation to the selected participants. We used this methodology to collect data about par-ticipants’ behaviour when sharing their location on Facebook with a mobile phone over seven days. 40 participants from the University of St Andrews used the system in May 2010, and 41 participants from University College London (UCL) used the system in November 2010. One of the participants in UCL did not carry the mobile phone every day, and we therefore discarded the data collected from this participant. Results presented were collected from the 80 remaining participants.
Overall, 7,706 ESM questions were sent to the phones. Not all of these ques-tions were answered, for various reasons. Participants were asked to answer as many questions as they can, but were not obliged to do so in order to avoid false answers. They were also asked to not switch the phone to silent mode or to switch it off. This instruction was not universally followed, however, and five phones were returned at the end of the study in silent mode. Also, if a question has been sent more than 30 minutes ago without being replied (e.g., when the phone is out of network cover-age), it is not displayed on the phone. Of the 7,706 questions, 4,232 were answered (54.8%). The participation rate depended on the participant, and ranged from 15.7% to 91.4%, with an average of 55.7% (standard deviation: 16.2%).
3.2.2 Results
Private information
We categorise location sharing into three types:
Private: location is shared with no-one.
Shared: location is shared with a restricted set of people.
Public: location is shared with all friends, or everyone.
Determining the category of a given piece of content cannot be done by merely collecting data directly on OSNs, as done by previous works. If a piece of content is accessible to the researchers, it may be either Shared or Public. On the other hand, if the content is not accessible, it may be Private or Shared (to a set of people excluding the researchers). Concretely, when collecting data from OSNs, content shared with a restricted set of people are often misclassified as Private because they are not acessible to the researchers. With our methodology, the category of each content can be determined. This leads to more reliable data collection, especially when studying privacy behaviours.
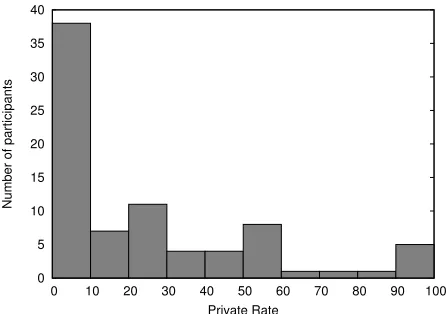
We define theprivate rateas the proportion of sharing activities that were pri-vate, and conversely thepublic rateis the proportion of sharing activities that were public. If data were to be collected from OSNs, only the public content could be collected, hence misclassifying the other contents as Private. Figure 4(a) shows the distribution of private rates amongst the 80 participants that we observe by collect-ing data from the participants’ Facebook pages. Most of the participants (31) have high private rates (above 90%), while only 8 participants have low private rates (under 10%). Data collected with this method would suggest that most of the partic-ipants have high private rates and are not happy to share their location. On the other hand, with our methodology, we are able to better classify the contents shared by the participants. What would have been classified as private by collecting data from only OSNs is often actually shared by the participants to a restricted set of friends. Figure 4(b) shows data collected with our methodology. Most of the participants (38) have low private rates and are actually happy to share their location, contra-dicting the data collected from the OSN. This demonstrates that our methodology allows a better understanding of participants’ actual sharing behaviours.
Additional data over questionnaires
Our methodology includes the collection of data from interviews and questionnaires to better understand participants’ privacy concerns. But using only questionnaires and interviews may be insufficient for a reliable picture of participants’ behaviours. Before providing the mobile phones to the participants, they were asked to complete a questionnaire discussing whether they have ever shared their location at least once (e.g., through their Facebook status, or with their mobile phone).
0 5 10 15 20 25 30 35 40
0 10 20 30 40 50 60 70 80 90 100
Number of participants
Private Rate
(a) Distribution of private rates amongst participants as obtained with data collected from Facebook participants’ pages only.
0 5 10 15 20 25 30 35 40
0 10 20 30 40 50 60 70 80 90 100
Number of participants
Private Rate
(b) Distribution of private rates amongst participants as obtained with our methodology.
Fig. 4 Comparison between private rates observed with data collected from Facebook and private
[image:19.612.191.416.99.256.2]rates observed with data collected with our methodology.
Table 1 Location-sharing choices of participants.
Group Number of
participants
Responses to location-sharing
requests
Locations that were shared
Never share location on Facebook
12 127 73.2%
Share location on Facebook
[image:19.612.191.414.289.446.2]imately the same proportion of locations than participants who reported to share their location on Facebook.
For the experiments in UCL, we also asked participants more general questions about their privacy through the commonly-used Westin-Harris methodology. Specif-ically, we used the same questions as [44], where Westin and Harris asked a series of four closed-ended questions of the US public:
• “Are you very concerned about threats to your personal privacy today?”
• “Do you agree strongly that business organisations seek excessively personal information from consumers?”
• “Do you agree strongly that the [Federal] government [since Watergate] is [still] invading the citizens privacy?”6
• “Do you agree that consumers have lost all control over circulation of their information?”
Using these questions, participants can be divided into three groups, representing their levels of privacy concern:
• Fundamentalist: Three or four positive answers • Pragmatic: Two positive answers
• Unconcerned: One or no positive answers
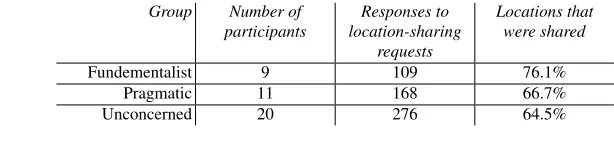
[image:20.612.133.440.497.574.2]Using only questionnaires, one might expect participants falling in the uncon-cerned category to have fewer privacy concerns and thus share more locations than the participants in the pragmatic category, who should in turn share more locations than the participants in the fundamentalist category. Table 2, however, shows that the 9 participants in the fundamentalist category actually shared 76.1% of their lo-cations, while participants in the pragmatic category shared only 66.7%. Moreover, the participants in the pragmatic category unexpectedly shared even more locations than the participants in the other categories, with a lower private rate of 64.5%. Once again, data collected with our methodology provide an insight of participants’ behaviours that cannot be predicted from questionnaires.
Table 2 Location-sharing choices of users, grouped by Westin-Harris privacy level.
Group Number of
participants
Responses to location-sharing
requests
Locations that were shared
Fundementalist 9 109 76.1%
Pragmatic 11 168 66.7%
Unconcerned 20 276 64.5%
Real versus simulated applications
Participants in each experiment run were randomly divided at the start into two groups. Thereal groupexperienced real publishing of their location information on Facebook to their chosen friend lists. In contrast, thesimulation groupexperienced simulated publishing, where information was never disclosed to any friends, regard-less of user preferences.7Participants were informed to which group they belonged at the start of the experiment. Participants in the simulation group were instructed to answer the questions exactly as if their information were really going to be pub-lished to Facebook. To control for differences between experiment runs,8half of the participants in each run were assigned to the simulation group and half to the real group. When reporting results, we combine responses from all runs.
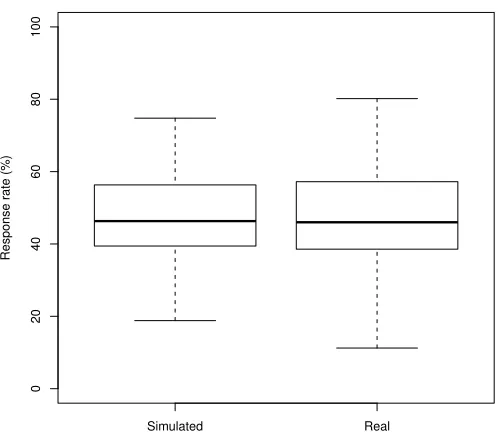
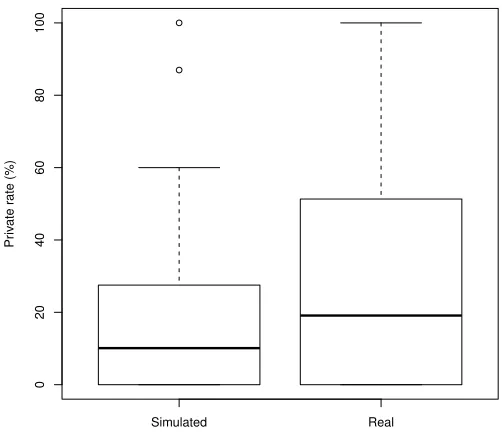
We investigate whether publishing the information “for real” (the real group) re-sults in a difference of behaviour compared to simulated publishing (the simulation group). Our results are shown in Figures 5–6. Figure 5 shows that the response rates for each of the two groups present a median of 46%. We thus observe no signifi-cant difference in response rate between the groups and believe participation level in each experiment seems to be neither diminished, nor encouraged, by simulation. While response rates are similar, Figure 6 suggests that there is a difference in disclosure choices between the real and simulated applications: the simulation group shares location information on Facebook more openly than the real group. The sim-ulation group less frequently makes their data completely private (available to no-one) than the real group, i.e., the simulation group has a lower private rate (median 10%) than the real group (median 19%). If this difference between behaviour in real and simulated systems holds in the general case, then there are implications for user studies and system design. For example, had our simulation group results been used to inform privacy defaults for a location-sharing system, then these defaults might have been overly permissive.
The reason behind the difference in behaviour cannot be determined solely from data analysis. While the participants in the simulation group were asked to answer questions as if they were in the real group, the participant interviews after the exper-iment offer some explanation. Members of the simulation group indicated that they were semi-consciously aware that no potential harm could come from their disclo-sure answers (since, after all, nobody would see the information in any case), and therefore tended to err on the side of more permissive information sharing. We high-light this as a potential problem with studies involving simulated social networks, and recommend that results from such studies be interpreted with caution.
7To realistically simulate publishing for the simulation group, the information was published using Facebook’s “only visible to me” privacy option. Therefore, each user was able to see exactly the information which would have been shared.
Simulated Real
0
20
40
60
80
100
Response r
ate (%)
Fig. 5 Question response rate. The response rates are similar for the simulated and the real groups.
(Median: 46% for each group.)
4 Discussion
Various methods have been used to collect data on online social networks, depend-ing on the focus of the study. In this section, we share our experience by suggestdepend-ing guidelines to follow when collecting more reliable data with these methods, and present some outstanding challenges that still need to be addressed.
4.1 Guidelines for more reliable data collection and analysis
[image:22.612.170.420.121.343.2]Simulated Real
0
20
40
60
80
100
Pr
iv
ate r
ate (%)
Fig. 6 The simulation group shares locations more openly than the real group: the simulation
group has a lower private rate than the real group (medians: 10% vs 19%).
Data collection
Data collection can be performed through different methods, as described in Sec-tion 2. Nevertheless, the amount and kinds of data generated by social network usage are too rich to be captured by only one of these methods. Hence, we believe that a single data collection method is insufficient to capture all aspects of users’ experience. Our experiments show that collecting data from different sources en-hances data analysis, and provides results than could not be obtained through only one method.
[image:23.612.168.419.123.343.2]ev-eryone (25.3%), as they are the only content available to researchers. Even if the researchers gain access to the participants’ accounts, 27.5% of the locations would still be unavailable, as they were not uploaded to the OSN at all.
Self-reported data should be complemented by measured data.Self-reported data may also be useful for interpreting and understanding users’ behaviour, but they do not always help in predicting users’ actual behaviour. In our experiments, we asked participants whether they had ever shared their location on Facebook before using the system, but the answers did not help to predict their actual sharing behaviours. The participants who had never before shared their locations nevertheless shared roughly the same proportion of locations during the study as the other participants. We also asked participants Westin-Harris questions to determine their personality regarding privacy, but, again, their answers did not help predicting their sharing behaviours. Hence, self-reported data must be coupled with measured data from a deployed application.
Interviews should rely on data collected in situ.Self-reported information may be inaccurate when the users forget their experience. After our study, participants were interviewed to talk about their experience. We had to rely on the data collected for them to comment on their sharing choices, as they did not remember when and where they shared locations. Hence, data collected in situ help to capture more data from interviews.
Applications should imply a real social interaction.Finally, to avoid participants’ behaviour to be biased by the experiment, their behaviour should be studied under real social interactions by actually sharing content on OSNs. Our experiment sug-gests that participants experiencing a simulated system may behave differently to those experiencing real social interactions — in this case, by sharing locations more openly in the simulation.
Data analysis
Collecting reliable data is an important first step for accurately describing users’ behaviours. But analysing these data correctly is also important.
Give priority to measured data over self-reported data.In our methodology, we gave priority to measured data over self-reported data. We believe that the observed behaviour better describes the users’ behaviour than their self-reported information. Questionnaires and interviews usually do not describe the context with accuracy, and the participants may not consider this context correctly. This leads to an inaccurate anwser that differs from the participants’ actual behaviour.
they lived. One participant did not share his home location because the system er-roneously reported this location as within a church next to his house, and he did not want his friends to think that he was going to the church everyday. These are examples of self-reported information that do not appear in measured data, and that help to understand and analyse them.
4.2 Outstanding challenges
Our methodology was applied to an experiment involving 80 participants. OSNs, however, are used by millions of people (Facebook counts more than 500 million active users). Applying our methodology to a larger number of participants is an out-standing challenge. Our software application could be downloaded and installed to the participants’ own smartphones to avoid the purchase and distribution of smart-phones to a large number of participants. Nevertheless, interviewing the participants cannot be done at a large scale and thus would be removed from the methodology. Interpretation and analysis of the measured data would then only rely on online questionnaires to be filled in by the participants before and after the study.
Studying social networks usage also raises ethical issues, as the data may contain sensitive information about the users. As the data collected become more reliable, they describe better users’ behaviours. Nevertheless, collected data may be delib-erately made unreliable by the users, in order to obfuscate information they do not want to share neither to their social network nor to the researchers. Using collected data from different methods may reveal unexpected information about users’ be-haviours that they did not intend to provide to the researchers, as it becomes more difficult for them to control the collected data and understand the implications of merging them. Using data from users without their consent is also controversial. Hoser and Nitschke [19] discuss the ethics of mining social networks, and suggest that researchers should not access personal data that users did not share for research purpose, even when they are publicly available.
In conclusion, we have shown through experiments that data can be more reli-ably collected from online social networks using an appropriate methodology. This involves mixing measured data from OSNs and deployed applications, and self-reported data from questionnaires, interviews, and in situ experience sampling. Nev-ertheless, applying this methodology to a larger scale and in an ethical fashion is still an outstanding challenge that needs to be addressed.
References
1. Y. Amichai-Hamburger and G. Vinitzky. Social network use and personality. Computers in
Human Behavior, 26(6):1289–1295, Nov. 2010. DOI 10.1016/j.chb.2010.03.018.
2. D. Anthony, T. Henderson, and D. Kotz. Privacy in Location-Aware Computing Environments.
3. F. Ben Abdesslem, A. Phillips, and T. Henderson. Less is more: energy-efficient mobile sens-ing with SenseLess. InACM MobiHeld’09, pages 61–62, Barcelona, Spain, Aug. 2009. DOI 10.1145/1592606.1592621.
4. F. Benevenuto, T. Rodrigues, M. Cha, and V. Almeida. Characterizing user behavior in online social networks. InIMC ’09: Proceedings of the 9th ACM Internet Measurement Conference, pages 49–62, Chicago, IL, USA, Nov. 2009. DOI 10.1145/1644893.1644900.
5. A. Besmer and H. R. Lipford. Moving beyond untagging: photo privacy in a tagged world.
InCHI ’10: Proceedings of the 28th international conference on Human factors in computing
systems, pages 1563–1572, Atlanta, GA, USA, Apr. 2010. DOI 10.1145/1753326.1753560.
6. P. B. Brandtzæg and J. Heim. Why People Use Social Networking Sites. In D. Hutchison, T. Kanade, J. Kittler, J. M. Kleinberg, F. Mattern, J. C. Mitchell, M. Naor, O. Nierstrasz, C. Pandu Rangan, B. Steffen, M. Sudan, D. Terzopoulos, D. Tygar, M. Y. Vardi, G. Weikum, A. A. Ozok, and P. Zaphiris, editors,Online Communities and Social Computing, volume 5621, chapter 16, pages 143–152. Springer Berlin Heidelberg, Berlin, Heidelberg, June 2009. DOI 10.1007/978-3-642-02774-1 16.
7. M. Cha, H. Haddadi, F. Benevenuto, and K. P. Gummadi. Measuring User Influence in Twitter: The Million Follower Fallacy. InProceedings of the 4th International AAAI Conference on
Weblogs and Social Media (ICWSM), Washington, DC, USA, May 2010. Online at http:
//aaai.org/ocs/index.php/ICWSM/ICWSM10/paper/view/1538/0.
8. S. Consolvo, I. E. Smith, T. Matthews, A. Lamarca, J. Tabert, and P. Powledge. Location dis-closure to social relations: why, when, & what people want to share. InCHI ’05: Proceedings
of the SIGCHI conference on Human factors in computing systems, pages 81–90, Portland,
OR, USA, Apr. 2005. DOI 10.1145/1054972.1054985.
9. S. Consolvo and M. Walker. Using the experience sampling method to evaluate ubi-comp applications. IEEE Pervasive Computing, 2(2):24–31, Apr.-June 2003. Online at http://ieeexplore.ieee.org/xpls/abs all.jsp?arnumber=1203750.
10. N. Eagle, A. S. Pentland, and D. Lazer. Inferring friendship network structure by using mobile phone data. Proceedings of the National Academy of Sciences, 106(36):15274–15278, Aug. 2009. DOI 10.1073/pnas.0900282106.
11. N. B. Ellison, C. Steinfield, and C. Lampe. The benefits of Facebook “friends:” social cap-ital and college students use of online social network sites. Journal of Computer-Mediated
Communication, 12(4):1143–1168, July 2007. DOI 10.1111/j.1083-6101.2007.00367.x.
12. J. Froehlich, M. Y. Chen, S. Consolvo, B. Harrison, and J. A. Landay. MyExperience: a system for in situ tracing and capturing of user feedback on mobile phones. InMobiSys ’07:
Proceedings of the 5th international conference on Mobile systems, applications and services,
pages 57–70, San Juan, Puerto Rico, June 2007. DOI 10.1145/1247660.1247670.
13. S. Garg, T. Gupta, N. Carlsson, and A. Mahanti. Evolution of an online social aggregation network: an empirical study. InIMC ’09: Proceedings of the 9th ACM Internet Measurement
Conference, pages 315–321, Chicago, IL, USA, Nov. 2009. DOI 10.1145/1644893.1644931.
14. S. Ghosh, G. Korlam, and N. Ganguly. The effects of restrictions on number of connections in OSNs: a case-study on Twitter. In Proceedings of the 3rd Workshop on Online Social
Networks (WOSN 2010), Boston, MA, USA, June 2010. Online at http://www.usenix.org/
events/wosn10/tech/full papers/Ghosh.pdf.
15. M. Gjoka, M. Kurant, C. T. Butts, and A. Markopoulou. Walking in Facebook: A case study of unbiased sampling of OSNs. InProceedings of IEEE INFOCOM 2010, pages 1–9, San Diego, CA, USA, Mar. 2010. DOI 10.1109/INFCOM.2010.5462078.
16. M. Gjoka, M. Sirivianos, A. Markopoulou, and X. Yang. Poking Facebook: characterization of OSN applications. InWOSN ’08: Proceedings of the first workshop on Online social networks, pages 31–36, Seattle, WA, USA, Aug. 2008. DOI 10.1145/1397735.1397743.
17. I. Guy, M. Jacovi, N. Meshulam, I. Ronen, and E. Shahar. Public vs. private: comparing public social network information with email. InCSCW ’08: Proceedings of the ACM 2008
conference on Computer supported cooperative work, pages 393–402, San Diego, CA, USA,
2008. DOI 10.1145/1460563.1460627.
19. B. Hoser and T. Nitschke. Questions on ethics for research in the virtually connected world.
Social Networks, 32(3):180–186, July 2010. DOI 10.1016/j.socnet.2009.11.003.
20. G. Iachello, I. Smith, S. Consolvo, M. Chen, and G. D. Abowd. Developing privacy guidelines for social location disclosure applications and services. InSOUPS ’05: Proceedings of the
2005 Symposium on Usable Privacy and Security, pages 65–76, Philadelphia, PA, USA, July
2005. DOI 10.1145/1073001.1073008.
21. A. Java, X. Song, T. Finin, and B. Tseng. Why we Twitter: An analysis of a microblog-ging community. In H. Zhang, M. Spiliopoulou, B. Mobasher, C. L. Giles, A. McCallum, O. Nasraoui, J. Srivastava, and J. Yen, editors,Advances in Web Mining and Web Usage Anal-ysis, volume 5439 ofLecture Notes in Computer Science, chapter 7, pages 118–138. Springer Berlin Heidelberg, Berlin, Heidelberg, Aug. 2007. DOI 10.1007/978-3-642-00528-2 7. 22. J. Jiang, C. Wilson, X. Wang, P. Huang, W. Sha, Y. Dai, and B. Y. Zhao. Understanding
latent interactions in online social networks. InIMC ’10: Proceedings of the 10th annual
conference on Internet measurement, pages 369–382, Melbourne, Australia, Nov. 2010. DOI
10.1145/1879141.1879190.
23. A. Kofod-Petersen, P. A. Gransaether, and J. Krogstie. An empirical investigation of attitude towards location-aware social network service. International Journal of Mobile
Communica-tions, 8(1):53–70, 2010. DOI 10.1504/IJMC.2010.030520.
24. H. Krasnova, O. G¨unther, S. Spiekermann, and K. Koroleva. Privacy concerns and identity in online social networks. Identity in the Information Society, 2(1):39–63, Dec. 2009. DOI 10.1007/s12394-009-0019-1.
25. O. Kwon and Y. Wen. An empirical study of the factors affecting social network service use.
Computers in Human Behavior, 26(2):254–263, Mar. 2010. DOI 10.1016/j.chb.2009.04.011.
26. C. Lampe, N. B. Ellison, and C. Steinfield. Changes in use and perception of Facebook. In
CSCW ’08: Proceedings of the ACM 2008 conference on Computer supported cooperative work, pages 721–730, San Diego, CA, USA, Nov. 2008. DOI 10.1145/1460563.1460675. 27. R. Larson and M. Csikszentmihalyi. The experience sampling method. New Directions for
Methodology of Social and Behavioral Science, 15:41–56, 1983.
28. K. Lewis, J. Kaufman, and N. Christakis. The Taste for Privacy: An Analysis of College Student Privacy Settings in an Online Social Network. Journal of Computer-Mediated
Com-munication, 14(1):79–100, Oct. 2008. DOI 10.1111/j.1083-6101.2008.01432.x.
29. J. Lindamood, R. Heatherly, M. Kantarcioglu, and B. Thuraisingham. Inferring private information using social network data. InWWW ’09: Proceedings of the 18th
Interna-tional World Wide Web Conference, pages 1145–1146, Madrid, Spain, Apr. 2009. DOI
10.1145/1526709.1526899.
30. C. Mancini, K. Thomas, Y. Rogers, B. A. Price, L. Jedrzejczyk, A. K. Bandara, A. N. Joinson, and B. Nuseibeh. From spaces to places: emerging contexts in mobile privacy. InUbicomp
’09: Proceedings of the 11th international conference on Ubiquitous computing, pages 1–10,
Orlando, FL, USA, Oct. 2009. DOI 10.1145/1620545.1620547.
31. F. Nagle and L. Singh. Can Friends Be Trusted? Exploring Privacy in Online Social Net-works. In2009 International Conference on Advances in Social Network Analysis and Mining
(ASONAM), pages 312–315, Athens, Greece, July 2009. DOI 10.1109/ASONAM.2009.61.
32. A. Nazir, S. Raza, and C. N. Chuah. Unveiling Facebook: a measurement study of so-cial network based applications. InIMC ’08: Proceedings of the 8th ACM SIGCOMM
conference on Internet measurement, pages 43–56, Vouliagmeni, Greece, Oct. 2008. DOI
10.1145/1452520.1452527.
33. T. A. Pempek, Y. A. Yermolayeva, and S. L. Calvert. College students’ social networking experiences on Facebook. Journal of Applied Developmental Psychology, 30(3):227–238, May 2009. DOI 10.1016/j.appdev.2008.12.010.
35. T. Qiu, J. Feng, Z. Ge, J. Wang, J. Xu, and J. Yates. Listen to me if you can: tracking user experience of mobile network on social media. InIMC ’10: Proceedings of the 10th annual
conference on Internet measurement, pages 288–293, Melbourne, Australia, Nov. 2010. DOI
10.1145/1879141.1879178.
36. R. Rejaie, M. Torkjazi, M. Valafar, and W. Willinger. Sizing up online social networks.IEEE
Network, 24(5):32–37, Sept. 2010. DOI 10.1109/MNET.2010.5578916.
37. M. Roblyer, M. McDaniel, M. Webb, J. Herman, and J. V. Witty. Findings on Facebook in higher education: A comparison of college faculty and student uses and perceptions of social networking sites. The Internet and Higher Education, 13(3):134–140, Mar. 2010. DOI 10.1016/j.iheduc.2010.03.002.
38. N. Sadeh, J. Hong, L. Cranor, I. Fette, P. Kelley, M. Prabaker, and J. Rao. Understand-ing and capturUnderstand-ing people’s privacy policies in a mobile social networkUnderstand-ing application.
Per-sonal and Ubiquitous Computing, 13:401–412, Aug. 2009. DOI http://dx.doi.org/10.1007/
s00779-008-0214-3.
39. F. Schneider, A. Feldmann, B. Krishnamurthy, and W. Willinger. Understanding online social network usage from a network perspective. In IMC ’09: Proceedings of the 9th
ACM Internet Measurement Conference, pages 35–48, Chicago, IL, USA, Nov. 2009. DOI
10.1145/1644893.1644899.
40. F. Stutzman and J. K. Duffield. Friends only: examining a privacy-enhancing behavior in facebook. InCHI ’10: Proceedings of the 28th international conference on Human factors in
computing systems, pages 1553–1562, Atlanta, GA, USA, Apr. 2010. DOI 10.1145/1753326.
1753559.
41. J. Y. Tsai, P. Kelley, P. Drielsma, L. F. Cranor, J. Hong, and N. Sadeh. Who’s viewed you?: The impact of feedback in a mobile location-sharing application. InCHI ’09: Proceedings of
the 27th international conference on Human factors in computing systems, pages 2003–2012,
Boston, MA, USA, Apr. 2009. DOI 10.1145/1518701.1519005.
42. M. Valafar, R. Rejaie, and W. Willinger. Beyond friendship graphs: a study of user interactions in Flickr. InWOSN ’09: Proceedings of the 2nd ACM workshop on Online social networks, pages 25–30, Barcelona, Spain, Aug. 2009. DOI 10.1145/1592665.1592672.
43. B. Viswanath, A. Mislove, M. Cha, and K. P. Gummadi. On the evolution of user interaction in Facebook. InWOSN ’09: Proceedings of the 2nd ACM workshop on Online social networks, pages 37–42, Barcelona, Spain, Aug. 2009. DOI 10.1145/1592665.1592675.
44. A. Westin and L. Harris & Associates.Equifax-Harris Consumer Privacy Survey. Conducted for Equifax Inc., 1991.
45. C. Wilson, B. Boe, A. Sala, K. P. Puttaswamy, and B. Y. Zhao. User interactions in social networks and their implications. InProceedings of the Fourth ACM European conference on
Computer Systems (EuroSys), pages 205–218, Nuremberg, Germany, Mar.-Apr. 2009. DOI
10.1145/1519065.1519089.
46. S. Ye and F. Wu. Estimating the Size of Online Social Networks. InProceedings of the
IEEE Second International Conference on Social Computing (SocialCom), pages 169–176,
Minneapolis, MN, USA, Aug. 2010. DOI 10.1109/SocialCom.2010.32.
47. A. L. Young and A. Quan-Haase. Information revelation and internet privacy concerns on social network sites: a case study of Facebook. InC&T ’09: Proceedings of the fourth
inter-national conference on Communities and technologies, pages 265–274, University Park, PA,