1
Drawing to
Learn in
Science
Shaaron Ainsworth1,*, Vaughan
Prain2 and Russell Tytler3 Should science learners be challenged to draw more? Certainly making visualizations is integral to scientific thinking. Scientists don’t just use words but rely on diagrams, graphs, videos, photographs and other imag-es to make discoveriimag-es, explain findings, and excite public interest. From the notebooks of Faraday and Maxwell (1) to current profes-sional practices of chemists (2), scientists imagine new relationships, test ideas, and elaborate knowledge through visual repre-sentations (3-5).
However in the science classroom, learn-ers mainly focus on interpreting othlearn-ers’ visu-alizations; when drawing does occur, it is ra-re that learners ara-re systematically encouraged to create their own visual forms to develop and show understanding (6). Drawing in-cludes constructing a line graph from a table of values, sketching cells observed through a microscope, or inventing a way to show a scientific phenomenon (e.g., evaporation). Becoming proficient in science requires learners to develop many representational skills. We suggest five reasons why student drawing should be explicitly recognized alongside writing, reading and talking as a key element in science education. We offer distinct rationales, although in practice any single drawing activity will likely rest upon multiple justifications. We conclude by high-lighting important questions yet to be an-swered and key future research to extend teachers’ and learners’ use of drawing.
Drawing to enhance engagement
Many students disengage from school sci-ence because rote learning and traditional topics reduce them to passive roles (7, 8). Reformers advocate more interactive, inquiry based, learning (9). Surveys of teachers and students indicate that when students drew to explore, coordinate, and justify understand-ings in science, they were more motivated to
learn compared to conventional teaching (10). Individual learner differences are ca-tered for if drawing is shaped by the learner’s current or emerging ideas and knowledge of visual conventions.
Drawing to learn to represent in science Students need to learn how scientists use multiple literacies of this subject to construct and record knowledge, where reading, writ-ing, and talk are integrated with visual modes (11-13). Generating their own representa-tions can deepen students’ understanding of the specific conventions of representations (e.g., “This is how a line graph works.”) and their purposes (e.g., “Line graphs are effec-tive for showing continuous quantitaeffec-tive in-formation.”), as well as how representations work more generally (e.g., “The representa-tion was better in this case as it was coherent, compact and parsimonious”) (3, 14, 15). Teachers can guide students to acquire the visual literacies of science at the point when they will see their relevance and appreciate their explanatory power (16).
Drawing to reason in science
To show conceptual understanding, students must learn how to reason with multiple, often visual modes (9). Understanding ‘sound waves’, for instance, can involve being able to coordinate a range of wave diagrams, time sequenced representations of air particle movement and pressure variation. Different representations have distinctive attributes that both guide and constrain what learners do and come to understand (17-19). As they se-lect specific features to focus on in their drawing, learners reason in various ways, aligning their drawing with observation, measurement, and/or emerging ideas (6, 20). Practice in flexible manipulation of represen-tations has been argued to be central for de-veloping expertise (21). Classroom research shows how students reason as they generate and refine models supported by expert teach-er guidance (22, 23). This creative reasoning is distinct from, but complementary to, rea-soning through argumentation (24).
Drawing as a learning strategy
Effective learning strategies help learners overcome limitations in presented material, organize their knowledge more effectively, integrate new and existing understanding, and ultimately can be transformative by gen-erating new inferences (25, 26). Drawing can be one such effective strategy (6, 27). For example, asking learners to read a text and draw what they have understood requires them to make explicit this understanding in
an inspectable form [(28) see Fig. S1 in sup-porting online material (SOM)]. Unlike other constructive strategies such as writing sum-maries or providing oral self explanations, visual representations have distinct attributes that match the visual-spatial demands of much science learning. Moreover, visual rep-resentation has been shown to encourage fur-ther constructive strategies (29). Inventing representations (including drawings) acts as preparation for future learning because it can help students discern key features and chal-lenges of new tasks (30).
Drawing to communicate
Scientists draw to clarify ideas for col-leagues, students, and the public (2, 5). In ex-ternalizing private knowledge more perma-nently, visual representation is one way to enable broader dissemination (4). Through drawing, students make their thinking explic-it and specific, leading to opportunexplic-ities to ex-change and clarify meanings between peers (31). Where learners generate and publicly share their representations, they learn by cri-tiquing the clarity and coherence of what they and their peers have drawn (32). These windows into student thinking can serve teachers in diagnostic, formative and sum-mative assessment (33, 34) (Fig. S2).
Current Programs and New Directions Various programs featuring drawing are now in progress (22, 23, 35). The Role of Repre-sentation in Learning Science (RiLS) project (36) is an exemplar showing how through hands-on activities and a variety of multi-modal representations, in which drawing was central, learners aged 10 to 13 were guided to generate, justify and refine representations in science (Fig. S3)(authors are affiliated with RiLS). In a unit on ‘water’, students pro-duced representations of particle ideas be-yond the teachers’ experience of previous performance.
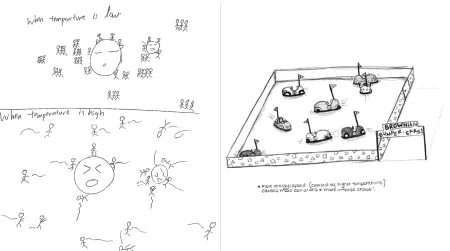
In one task, students placed their wet hands on paper and then were challenged to represent what happens as the handprint di-minishes. The drawings reflect learners ex-panding on previous work to reason about particle distribution and movement, energy exchange, and time-sequencing (Fig. 1). Stu-dents’ visual choices indicate thoughtful en-gagement with the task of creating a coherent account. Through appraisal and refinement of drawings, teachers and students estab-lished some representational conventions, such as the circles reflecting particles. Teachers used these diagrams to assess and then further refine students’ understandings 1School of Psychology, University of Nottingham,
University Park, Nottingham NG7 2RD UK. 2Faculty of Education, La Trobe University, Bendigo 3552 Australia. 3School of Education, Deakin University, Waurn Ponds 3217 Australia.
2 of particle behavior.
The RiLS approach supported students to deepen their understanding of the selective purpose of representational choices. For ex-ample, a student justified the selective nature of his animation of particles in evaporation thus: “I was just focusing on what they do, not representing other things like shape and size, they are very, very tiny”. RiLS teachers have noted that their students engaged more in class, discussed at a higher level, and per-formed better in their workbooks (36). Anal-ysis of test results showed stronger outcomes than in previous studies using comparable methods (37). Further research is now need-ed to establish explicit connections between drawing used in this way and learning.
Although there is growing evidence of the benefits of drawing to learn science, many unanswered questions remain. One active arena is exploration of how learning with new technologies can benefit from drawing. Learners can draw to help them understand what they are seeing in complex visualization environments (38). Drawing can be the way learners create models and interact with a system (39, 40) or their free-hand sketches can be automatically marked to provide time-ly feedback (41). Technology is also broad-ening our concept of drawing as learners cre-ate animations (42) or use cameras and clay models on drawn backdrops to generate one-second stop-frame movies of science pro-cesses (43).
We also need to research the fundamental mechanisms of drawing to learn. What skills do you first need to develop in order to best take advantage of learning by drawing? Per-haps some topics are sufficiently difficult to draw that attempting to do so is counter-productive. A further important research area concerns how teachers can best support their students to use drawing alongside writing and talking in the classroom. However, what is clear is the growing interest in drawing as it reflects new understandings of science as a multimodal discursive practice as well as mounting evidence for its value in supporting quality learning.
References and Notes
1. D. C. Gooding, Journal of Cognition and Culture, 4, 551-593 (2004).
2. R. Kozma, E. Chin, J. Russell, N. Marx, Journal of the Learning Sciences. 9, 105-143 (2000).
3. J. K. Gilbert, Visualization in science education. (Springer-Verlag New York Inc, 2005).
4. B. Latour, Pandora's hope: Essays on the reality of science studies. (Harvard Univ Pr, 1999).
5. N. Nersessian, in Teaching scientific inquiry: Rec-ommendations for research and implementation, R.
Duschl, R. Grandy, Eds. (Sense Publishers, Rotter-dam, 2008), pp. 57-79.
6. P. Van Meter, J. Garner, Educational Psychology Re-view. 17, 285-325 (2005).
7. T. Lyons, International Journal of Science Educa-tion. 28, 591-613 (2006).
8. J. Osborne, J. Dillon, Science education in Europe: Critical reflections. London: Nuffield Foundation.
(2008).
9. R. A. Duschl, R. E. Grandy, Teaching scientific in-quiry: Recommendations for research and implemen-tation. (Sense Publishing, Rotterdam, 2005). 10. M. Hackling, V. Prain, “Primary connections. Stage
2 trial.” Australian Academy of Science, (2005). 11. J. S. Krajcik, L. M. Sutherland, Science. 328,
456-459 (April 2010).
12. J. L. Lemke, in Crossing borders in literacy and sci-ence instruction: Perspectives on theory and practice, E. W. Saul, Ed. (Int. Reading Assoc., Newark, DE, 2004), pp. 33–47.
13. P. D. Pearson, E. Moje, C. Greenleaf, Science. 328, 459-463 (April 2010).
14. A. A. diSessa, Cognition and Instruction. 22, 293-331 (2004).
15. E. Stern, C. Aprea, H. G. Ebner, Learning and In-struction. 13, 191-203 (2003).
16. N. Enyedy, Cognition and Instruction. 23, 427-466 (2005).
17. S. E. Ainsworth, Learning and Instruction. 16, 183-198 (2006).
18. M. Scaife, Y. Rogers, International Journal of Hu-man-Computer Studies. 45, 185-213 (1996). 19. B. Tversky, Topics in Cognitive Science. 3, 499-535
(2011).
20. R. Cox, Learning and Instruction. 9, 343-363 (1999). 21. J. G. Greeno, R. P. Hall, Phi Delta Kappan. 78,
361-367 (1997).
22. J. Clement, M. A. Rea-Ramirez, Model based learn-ing and instruction in science. (Springer, Secaucus, NJ, 2008).
23. R. Lehrer, L. Schauble, in Thecambridge handbook of the learning sciences, K. Sawyer, Ed. (Cambridge Univ. Press, Cambridge, 2006), pp. 371-388. 24. J. Osborne, Science. 328, 463-466 (April 2010). 25. M. T. H. Chi, M. Bassok, M. W. Lewis, P. Reimann,
R. Glaser, Cognitive Science. 5, 145-182 (1989). 26. U. Kombartzky, R. Ploetzner, S. Schlag, B. Metz,
Learning and Instruction. 20, 424-433 (2010). 27. J. D. Gobert, J. J. Clement, Journal of Research in
Science Teaching. 36, 39-53 (1999).
28. S.E Ainsworth, M. J. Nathan, P. van Meter, Proceed-ings of the 9th international conference of the learn-ing sciences – Vol.2, (2010), pp 164-165.
29. S. E. Ainsworth, A. T. Loizou, Cognitive Science. 27, 669-681 (2003).
30. D. L. Schwartz, T. Martin, Cognition and Instruction. 22, 129-184 (2004).
31. D. L. Schwartz, The Journal of the Learning Scienc-es. 4, 321-354 (1995).
32. M. C. Linn, C. Lewis, I. Tsuchida, N. B. Songer, Ed-ucational Researcher. 29, 4-14 (2000).
33. J. E. Dove, L. A. Everett, P. F. W. Preece, Interna-tional Journal of Science Education. 21, 485-497 (1999).
34. K. Ehrlan, International Journal of Science Educa-tion. 31, 41-57 (2009).
35. http://www.picturingtolearn.org.
36. P. Hubber, R. Tytler, F. Haslam, Research in Science Education. 40, 5-28 (2010).
37. P. Hubber, in Physics community and cooperation, D. Raine, L. Rogers, C. Hurkett, Eds. (Univ. of Leicester, Leicester, 2010), pp. 45-64.
38. H. Z. Zhang, M. Linn, Proceedings of the 9th inter-national conference of the learning sciences – Vol.2., (2010), pp. 165-166.
39. http://crayonphysics.com/.
40. W. R. van Joolingen, L. Bollen, F. A. J. Leenaars, in
Advances in intelligent tutoring systems, R. Nkam-bou, J. Bourdeau, R. Mizoguchi, Eds. (Springer, New York, 2010), pp. 266-282.
41. K. Forbus, J. Usher, A. Lovett, K. Lockwood, J. Wetzel, Topics in Cognitive Science. DOI: 10.1111/j.1756-8765.2011.01149.x (in press). 42. H. Y. Chang, C. Quintana, J. S. Krajcik, Science
Ed-ucation. 94, 73-94.
43. Macdonald, G. Hoban, International Journal of Learning. 16, 319-330 (2009).
3
Figures
Fig.1 Drawings by two 11 year olds (A and B) of an evaporating handprint show representational choices that guide and communicate
4
Fig. 1S Two typical (left hand side, top and bottom) and one less typical (right hand side) drawings created by
univer-sity students given instructions to draw for their own understanding after reading the text “Valves prevent the blood
from moving backward or downward. These valves allow blood to flow in only one direction through the veins.” (Image courtesy of S Ainsworth)
Fig. 2S Drawings created by university students after the instructions “Draw, as if explaining to a high school student,
[image:4.612.53.503.421.672.2]5
[image:5.612.67.492.108.209.2]size and motion compared to the picture on the right hand side. (Image courtesy of Picturing to Learn, funded by NSF DUE-0925110)
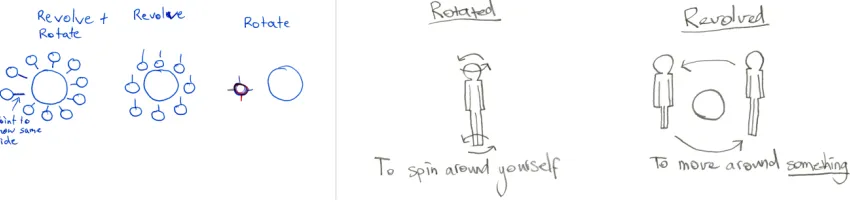
Fig. 3S Two examples of drawings by 12 year old students who were challenged to explain the meaning of the terms ‘re-‐