ISSN: 1816-949X
© Medwell Journals, 2019
Effect of Magnified and Equality of Irrigation Water in the Soil Saturated
Hydraulic Conductivity and the Soil Water Infiltration in Clay Loam Soil
During the Growth Stages of Barley Crop (Hordium Vulgare L.)
Kawther A. AL-Mosawi, Ali H. Mohammed and Sabah Sh. Al-Hadi
Department of Soil and Water Resources, College of Agriculture, University of Basra,
Basra, Iraq
Abstract: Field experiments were conducted at the research station, College of Agriculture, University of Basra
at Garmit Ali district. The experiments were carried out during the Winter season 2012-2013 in clay loam soil. The aims of the research are to study the effect of water magnetization and the quality of irrigation water in the saturated hydraulic conductivity of the soil and the water infiltration during the plant growth stages (beginning of the forest, beginning of flowering and after crop harvesting) of barley crop (Hordium vulgare L.) . The magnetization of irrigation water treatments included, non-magnetized water (M0) and Magnetized water (M1). The irrigation water quality treatments included five types of water namely, Tap Water (TW), River Water (RW), sewage Water (WW), treated sewage water passed through sandy filter (WWT) and Mixed Water (MW) (50% RW+50% WWT). The experiments were conducted using factorial Randomized Complete Block Design (RCBD). The irrigation water was added on the basis of the shortfall in the level of water of the evaporation basin installed in the field. The amount of water added was 100% of the amount vaporized water plus 20% for leaching requirements. The results showed that: magnetized water treatments surpassed the non-magnetized water treatments in increasing the soil saturated hydraulic conductivity for both depths 0-30 and 30-60 cm. TW treatment gave the highest value of the soil saturated hydraulic conductivity while RW treatment gave the lowest values for both depths. The WW, WWT and MW treatments gave intermediate values of soil saturated hydraulic conductivity. The order of the treatments effect on the soil saturated hydraulic conductivity is WWT>WW>MW for depth of 0-30 cm while the order is WW>WWT>MW for depth 30-60 cm.
Key words: Magnified water, sewage water, soil hydraulic conductivity, water infiltration, experiment, TW
INTRODUCTION
The irrigation water is regarded the main factor in determining the crops production in arid and semi-arid regions. The agriculture in Iraq suffers for shortage of irrigation water and deterioration of its equality. The magnetization method is used to improve water quantity. This method also can improve the soil physical properties. Water magnetization is carried out by passing the water through magnetic field with predetermining water discharge. The magnetic field breaksdown the hydrogen bonds and unregulated bonds of the water molecular. This operation resulted in that the water molecular bonded in a chain. The water molecular chain enables the water solving the nutrition elements and the salts in the soil and that increases the nutrient elements for the plants growth. Using the sewage water for irrigation can provided great amount of water after treatment and that can compensate the shortages in irrigation water. The treated sewage water can reduce the water and soil contaminations as well as supplied the ground water with extra amount to compensate its shortages. The treated sewage water also
provided the soil with organic matter which improves the soil physical properties and provided it with nutrition elements which can increases crops production (Pescod,1992). Using the sewage water in agriculture reduces its problems which causes to the environment and can improve crops production. The sewage water amount is increasing by time because the world population increasing yearly, so that, using it in agriculture to compensate the irrigation water shortages is regarded the best method to reduce the soil contaminations and revers water (Ghanbari et al., 2007).
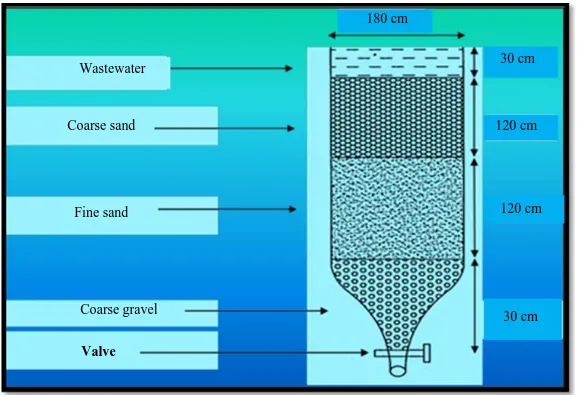
To reduce unwanted material in the sewage water, it should be passed through filters. The experiments showed that the best filter is the column of sand. The treated water should be passed through the sand column slowly. The sand column divided into many layers. The coarse sand should be at the top, fine sand at the middle and fin sand at the bottom. This method of sewage water treatment is old but it is the best so far and the cheapest cheap.
The aims of this research is to study the effect of magnetized water and the treated sewage water on the soil saturated hydraulic conductivity and water infiltration during the plant growth stages.
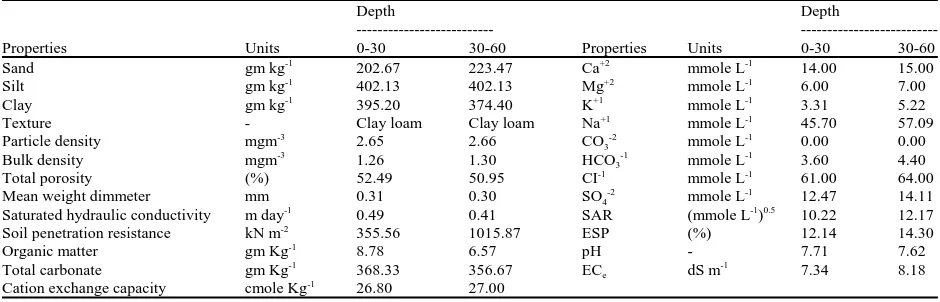
Table 1: Physical and chemical properties of the soil fordepths of (0-30), (30-60) cm
Depth Depth
---
---Properties Units 0-30 30-60 Properties Units 0-30 30-60
Sand gm kg-1 202.67 223.47 Ca+2 mmole L-1 14.00 15.00
Silt gm kg-1
402.13 402.13 Mg+2
mmole L-1
6.00 7.00
Clay gm kg-1 395.20 374.40 K+1 mmole L-1 3.31 5.22
Texture - Clay loam Clay loam Na+1 mmole L-1 45.70 57.09
Particle density mgm-3 2.65 2.66 CO
3
-2 mmole L-1 0.00 0.00
Bulk density mgm-3
1.26 1.30 HCO3
-1
mmole L-1
3.60 4.40
Total porosity (%) 52.49 50.95 CI-1
mmole L-1
61.00 64.00
Mean weight dimmeter mm 0.31 0.30 SO4
-2 mmole L-1 12.47 14.11
Saturated hydraulic conductivity m day-1 0.49 0.41 SAR (mmole L-1)0.5 10.22 12.17
Soil penetration resistance kN m-2
355.56 1015.87 ESP (%) 12.14 14.30
Organic matter gm Kg-1
8.78 6.57 pH - 7.71 7.62
Total carbonate gm Kg-1 368.33 356.67 EC
e dS m
-1 7.34 8.18
[image:2.612.71.541.105.256.2]Cation exchange capacity cmole Kg-1 26.80 27.00
Table 2: Physical and chemical properties ofmagnified and unmagnified irrigation water The irrigation water quality
---Non-magnetized water Water magnetized
---
---Properties Units TW RW WW WWT MW TW RW WW WWT MW
EC dS m-1 3.570 6.960 6.600 5.970 6.580 3.740 7.030 6.700 6.040 6.730
pH - 7.832 7.864 7.556 7.791 7.821 7.826 7.858 7.562 7.782 7.822
Ca+2
mmole L-1
6.000 9.000 8.000 7.000 7.250 6.250 9.000 8.250 7.000 7.500
Mg+2
mmole L-1
2.000 5.000 4.000 5.000 4.750 1.750 5.000 3.750 5.000 4.500
K+1 mmole L-1 2.357 5.605 8.853 8.853 8.853 2.357 5.605 8.853 8.853 8.853
Na+1 mmole L-1 19.110 43.799 38.102 36.203 40.001 19.110 45.698 38.102 36.203 40.001
CO3
-2 mmole L-1 0.000 0.000 0.000 0.000 0.000 0.000 0.000 0.000 0.000 0.000
HCO3 -1
mmole L-1
1.000 2.800 4.200 4.000 3.200 1.000 2.800 4.200 4.000 3.400
SO4 -2
mmole L-1
3.710 6.460 7.988 7.476 6.782 3.883 6.524 8.081 7.589 6.935
CI-1 mmole L-1 28.00 56.000 49.000 41.000 51.000 29.000 56.000 50.000 42.000 52.000
SAR (mmol L-1)0.56.757 11.706 10.999 10.451 11.547 6.757 12.213 10.999 10.451 11.547
MATERIALS AND METHODS
A field experiments were conducted at the research station, College of Agriculture, University of Basrah at Garmit Ali district during the Winter season 2012-2013 in clay loam soil. The soil samples were collected for depths 0-30 and 30-60 cm to measure the soil chemical and physical properties. The results are shown in Table 1. The soil texture, bulk density and real density were measured by pipette, core sample and pycnometer method, respectively. The soil porositywas calculated from the relationship between the real and bulk densities. The Mean Weight Diameter (MWD) was measurement by wet sieving method. The soil saturated hydraulic conductivity was measured using undisturbed soil sample which collected by core sample from depths of 0-30 and 30-60 cm. The sample was saturated by vocabulary. Then sample was supplied with water from the top to the bottom. The soil saturated hydraulic conductivity was calculated by the following Darcy equation (Page et al., 1982):
s
Q L
K *
At h
Where:
Ks : The soil saturated hydraulic conductivity m day -1 Q : The volume of water passed through the soil
column (cm3)
L : The Length of the soil column (cm)
A : The Area of the section width for the soil column (cm2)
t : The time (day)
h : The L+height of the water above the soil surface in the column (cm)
The soil penetration resistance was measured by cone penetrometer (Gill and Vandenberg, 1968). Soil pH wasmeasured using suspension 1:1 (soil: water) using pH meter. Organic matter was measured using Walkely Black method. The soil total carbonate, Calcium (Ca+2), Magnesium (Mg+2) and Chloride (Cl-1) ions were measured using substrate from the saturated soil sample (Jackson, 1958). The measurements were conducted according to Page et al. (1982). The potassium (K+1) and sodium (Na+1) ions were measured by flame-photometer while sulphate (SO4
-2) was measured by spectro photometer. The Cat Ions Exchange Capacity (CEC) was measured according to Papanicolaou while ECe was measured by EC- meter. The soil Carbonate (CO3
-2) and Bicarbonate (HCO3-1) measured by using sulpharic acid of 0.01 N as it was mentioned by Richards (1954). SAR and ESP were measured according to method mentioned by Richards (1954). The results are shown in Table 1.
Fig. 1: The apparatuses used for water magnetization
Fig. 2: Sand filter used in the experiments
chemical properties were measured according to standard method APHA (2005) and the results are shown in Table 2.
The magnetized treatments which were used are unmagnified water (M0) and magnetized water by 3000 cos (M1) by passing the water through the system which is shown in Fig. 1.
The irrigation water used are Tap Water (TW), River Water (RW), sewage Water (WW), treated sewage water using sand filter (WWT) and Mixed Water (MW) (50% WWT+50% RW) (Fig. 2).
The field experiments: The field experiments were
carried out using Randomize Complete Block Design (RCBD). The field area was divided into three blocks of equal areas. Each block was divided into ten units. The treatments were randomly distributed on the units of each block. The barley crop seeds were planted in rows in each unit on 26/11/2012. The amount of seeds used was 120 kg ha-1. The urea fertilizer of 46% N was added at level of 80 kg ha-1. The urea fertilizer was added in two periods, the first after one week of planting and the second after one month of the first period. The phosphorus fertilizer was added as P2O5 (54%) at
level of 60 kg ha-1 during the planting operation. The fertilizers were implicated by broadcasting method (AL-Younis et al., 1987). The irrigation water was added according to the reduction in the water level in the evaporation basin which exists in the field. The amount of water added was 100% of the evaporated amount with 20% addition amount for leaching requirement.
Undisturbed soil samples were collected from the treatment units of depths of 0-30 and 30-60 cm to evaluate the effect of the treatments on the soil saturated hydraulic conductivity. The samples were collected at the three barley crop growth stages.
The results were analyzed using the statistical program SPSS to determine the variations, differences and the interaction between the treatments. F test was also used at probability level of 0.05. The Lowest Significant Difference (RLSD) was used to compare the average of the treatments (Al-Rawi and Khalaf-Allah, 1980). The water infiltration was measured at the end of the experiments using double rings apparatus for 240 min. Philip (1957) was used to descript the water infiltration.
Wastewater
Coarse sand
Fine sand
Coarse gravel
Valve
180 cm
30 cm
120 cm
120 cm
[image:3.612.159.448.225.423.2]0.4
0.3
0.2
0.1
0.0
K m
d
a
y
s
-1
d1 d2 Magnetization of irrigation water M M0 1
0.40 0.35 0.30 0.25 0.20 0.15 0.10 0.05 0.00
TW RW WW WWT MW RLSD 0.05
K m
d
ay
s
-1
Quality of irrigation water d1 d2
Table 3: The statistical analysis for F-test of the soil saturated conductivity for depths of (0-30) and (30-60 cm)
Sources df (0-30) (30-60)
A 1 5.350* 4.260*
B 4 5.410** 6.730**
C 2 49.840**
75.550**
A*B 4 0.010 ns 0.050 ns
A*C 2 0.000 ns 0.010 ns
B*C 8 0.060 ns 0.110 ns
A*B*C 8 0.010 ns 0.050 ns
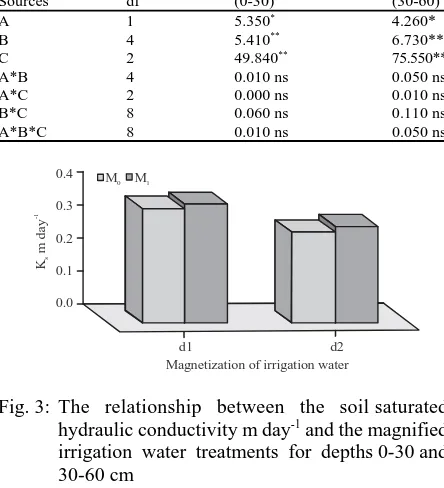
Fig. 3: The relationship between the soil saturated hydraulic conductivity m day-1 and the magnified irrigation water treatments for depths 0-30 and 30-60 cm
Fig. 4: The relationship between the soil saturated hydraulic conductivity m day-1 and the water quality treatments for depths 0-30 and 30-60 cm
RESULTS AND DISCUSSION
Saturated hydraulic conductivity: Saturated
hydraulic conductivity (Ks) was significantly affected by magnetized water (Table 3). It increased by 4.35 and 5.80% for depths 0-30 and 30-60 cm, respectively as it can be seen in Fig. 3. This improvement in Ks can be related to the soil ESP and to the improvement in the soil physical properties such as the reduction in the bulk density and the increasing in the total soil porosity. The soil aggregates stability was also increased which improved water movement in the soil compared with unmagnified water treatments. The same results were found by Abdulmunem (2008) and Al-Mosawi (2011).
The statistical analysis (Table 3) showed that there was high significant difference between Ks values of irrigation water treatments. Figure 4 showed that TW gave the highest Ks values for both depths 0-30 and 30-60
cm. The values of Ks are 0.379 and 0.307 m day -1, respectively with high significant difference compared with other water treatments values except that with WWT for depth of 0-30 cm and WW for depth of 30-60 cm where there was no significant difference between the values of Ks.
The supervision of TW treatment in giving higher value of Ks can probability be related to lower value of SAR which improved soil aggregate stability, hence, improved the soil total porosity which resulted in greater soil water movement in and that improved Ks.
The other water treatments MW, WW and WWT recorded lower valves of Ks compared with water treatment TW. However, there was no significant difference between the values of the four treatments. For depth of 0-30 cm the values of Ks for MW, WW and WWT are 0.364, 0.354 and 0.340 m day-1, respectively. While for depth of 30-60 cm the values are 0.284, 0.294 and 0.274 m/day, respectively. This reduction in Ks values could be related to the suspended hard materials in the water of MW, WW and WWT which a great part of them participated in the soil pores and closed them in addition to that the high value of EC of the water dissipated the soil particles and hence, reduced the soil total porosity and that resulted in lower water downward movement which reduced Ks. The results found by Karimzadeh et al. (2013) supported these results.
The water types WW, WWT and MW carried soluble and organic materials. The organic materials increased the soil organic matter and nutrition elements which improved soil fertility and encouraged organism activity as well as crop growth. These factors decreased soil EC values through increasing soil aggregate stability, decreasing soil bulk density and increasing soil total porosity. The improvement in the soil physical properties resulted in higher Ks. The water treatment RW recorded the lowest values for Ks which they are 0.323 and 0.261 mday-1 for depths 0-30 and 30-60 cm, respectively. These two values differed significantly from the values of the remaining water treatments except the value of MW treatment.
The lower values of Ks for RW was due to the high values of EC and SAR which weakened the soil aggregate stability and increased soil particles downward movement which filled the soil porous at depth and therefore, the water movement (Vinten et al., 1983).The reduction in Ks increased the soil ESP. Al-Hadi (2003) and Al-Mosawi (2007) mentioned that Ks values decreased as the water salinity increased.
[image:4.612.73.295.119.363.2]0.45 0.40 0.35 0.30 0.25 0.20 0.15 0.10 0.05 0.00
K m
d
ay
s
-1
T1 T2 T3 RLSD 05 Growth stages
d1 d2
d1 d2 Soil depth cm 0.40
0.35
0.30
0.25
0.20
0.15
0.10
0.05
0.00
K m
d
ay
s
-1
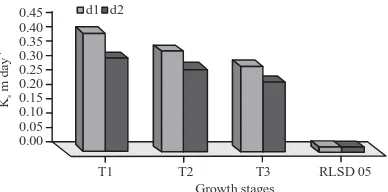
Fig. 5: The relationship between the soil saturated hydraulic conductivity m day-1 and the crop growth stages treatments for depths 0-30 and 30-60 cm
Fig. 6: The relationship between the soil saturated hydraulic conductivity m day-1 and the soil depths d1 (0-30) and d2 (30-60 cm)
This can be related to the increase in the soil bulk density which resulted in low soil porosity with development in the crop growth stages. The increase in bulk density was due to the movement of the soil particles downward with irrigation water which filled the soil pores. The same results were found by Al-Shamy (2013).
[image:5.612.89.283.95.191.2]The statistical analysis showed that the double and triple interaction between the magnetized water treatments, water type’s treatments and the crop growth stages had no significant effect on the soil Ks for depths 0-30 and 30-60 cm (Table 3). Figure 6 and t-test (Table 4) showed that there is significant difference between the values of Ks for the two depths. The value of Ks for depth of 0-30 cm is higher than that for depth of 30-60 cm. This can be related to the high soil porosity of the top soil layers and that was because the crop roots disturbed the soil and the higher organic materials improved the soil aggregate stability compared with lower soil layers. These two factors increased the soil porosity while the lower layers suffered from higher bulk density and lower porosity due to the movement of the soil particles from the top layers to the lower layers and the top layers compact the lower layers. The lower porosity reduced the water movement and therefore reduced Ks.
Table 4: The statistical analysis for t-test of the soil saturated conductivity for depths of 0-30 and 30-60 cm
Properties df t-test
Ks 89 37.870**
[image:5.612.77.290.158.378.2]** = Significant difference at level 0.01
Table 5:The constants of Philip (1957) for magnified treatments and irrigation water qualities after crop harvesting
A (cm min-1
) S (cm min-0.5
) Magnetization treatment/ --- ---the irrigation water quality M0 M1 M0 M1
TW 0.0154 0.0180 1.2876 1.3414
RW 0.0143 0.0143 0.8385 0.8624
WW 0.0146 0.0151 1.0197 1.0645
WWT 0.0150 0.0155 1.1432 1.1880
MW 0.0145 0.0147 0.9251 0.9510
These results confirmed by Al-Atab (2001) who mentioned that the plant roots improved the soil aggregates and hence, soil Ks.
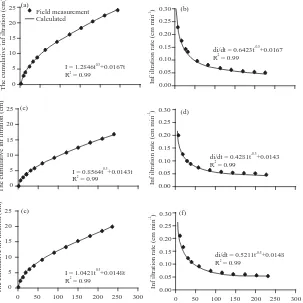
Soil water infiltration: Philip (1957) was used to
describe the relationship between the accumulation Infiltration (I) and Time (T) (I = ST0.5+AT). S is the soil absorption. The soil absorption depends on soil structure effort and its value increases as the soil moisture content decreases. It also increases as the soil bulk density decreases and the soil porosity increases. The constant A in equation represents change ability which depends on soil Ks which on other hand depends up on the soil physical properties. The soil physical properties are the bulk density and total porosity. Increasing the bulk density leads to reduction in the soil porosity which reduces the water flow in the soil section and therefore A.
The increase in the soil bulk density resulted in more soil particles contact and that resulted in longer and twist soil pores which lead to lower value of A. Table 5 shows the constants of Philip (1957) for different soil treatments. The values of S and A increased for magnetized treatments compared with unmagnified treatments and that was because them agnetized treatments improved soil properties. For water quality treatments took the following quinces (TW>WWT> WW>MW>RW). The values of equation increased with improvement of the soil aggregates stability, reduction in the soil bulk density and increasing in the soil porosity.
[image:5.612.314.544.171.250.2]0.30 0.25 0.20 0.15 0.10 0.05 0.00
di/dt = 0.522t +0.0147-0.5 R = 0.992
25 20 15 10 5 0
I = 1.0404t +0.0147t0.5 R = 0.992
Th e c u mu la ti v e in f ilt ra tio n (
cm) Field measurement
Calculated Time (min) In f il tr atio n r a te ( cm m in ) -1
0 50 100 150 200 250 300 Time (min)
di/dt = 0.5371t +0.0155-0.5 R = 0.992
0.30 0.25 0.20 0.15 0.10 0.05 0.00 In f iltratio n r a te (cm min ) -1
0 50 100 150 200 250 300 25 20 15 10 5 0
I = 1.0743t +0.0155t0.5 R = 0.992
T h e cu mu la tiv e in f i ltratio n ( c m) (c) (b) (d) (a) 0.30 0.25 0.20 0.15 0.10 0.05 0.00 In f i lt ra ti o n ra te (c m m in ) -1
di/dt = 0.6423t +0.0167-0.5 R = 0.992
(b) T h e cu mu la tive inf ilt ra ti o n ( cm) 25 20 15 10 5 0 Field measurement Calculated
I = 1.2846t +0.0167t0.5 R = 0.992
(a) Th e cu mulati v e i n f il tr at io n (cm ) 25 20 15 10 5 0
I = 0.8564t +0.0143t0.5 R = 0.992
0.30 0.25 0.20 0.15 0.10 0.05 0.00 In f iltr atio n r a te ( cm min ) -1
di/dt = 0.4281t +0.0143-0.5 R = 0.992
(c) (d) T h e c u mu lat iv e in f iltration ( cm) 25 20 15 10 5 0
I = 1.0421t +0.0148t0.5 R = 0.992
0.30 0.25 0.20 0.15 0.10 0.05 0.00 In f iltr at io n r ate ( cm m in ) -1
di/dt = 0.5211t +0.0148-0.5 R = 0.992
(e) (f)
[image:6.612.159.455.98.301.2]0 50 100 150 200 250 300 0 50 100 150 200 250 300
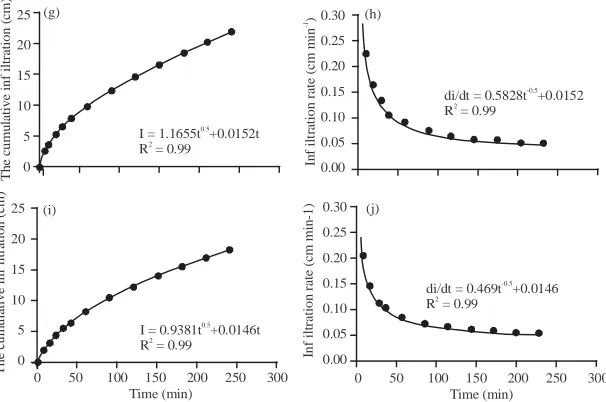
Fig. 7: The relationship between Accumulative Infiltration (AI) and Infiltration Rate (IR) with time for magnified water treatments which were calculated according to Philip (1957) at the end of crop growth season, (a) M0 (Bule line), (b) M0 (Red line), (c) M1 (Bule line) and (d) M1 (Red line)
Fig. 8: Contine
0.053 cm minG1 after 240 min (Fig. 7). This can be related to the effect of the magnetized water which improved soil particles stability and prevented soil crust which improved soil Ks, AI and IR. The soil particles
[image:6.612.168.471.358.661.2]I = 1.1655t +0.0152t0.5 R = 0.992
Th
e cu
mu
la
tive
in
f iltration
(
cm) 25
20
15
10
5
0
0.30
0.25
0.20
0.15
0.10
0.05
0.00
In
f il
tr
atio
n r
ate (cm
m
in
)
-1
di/dt = 0.5828t +0.0152-0.5 R = 0.992
(g) (h)
0 50 100 150 200 250 300 Time (min)
I = 0.9381t +0.0146t0.5 R = 0.992
The c
u
m
u
la
tive inf
il
tr
atio
n (
cm) 25
20
15
10
5
0
0.30
0.25
0.20
0.15
0.10
0.05
0.00
In
f i
lt
ra
ti
on
ra
te
(c
m
m
in
-1
)
0 50 100 150 200 250 300 Time (min)
di/dt = 0.469t +0.0146-0.5 R = 0.992
(i) (j)
[image:7.612.171.474.99.300.2]
Fig. 8: The relationship between Accumulative Infiltration (AI) and Infiltration Rate (IR) with time for water quality treatments which were calculated according to Philip (1957) at the end of crop growth season, (a) TW (Bule line) (b) TW (Red line, (c) RW (Bule line); d) RW (Red line); e) WW (Bule line); f) WW (Red line, (g) WWT (Bule line), (h) WWT (Red line), (I) MW (Bule line) and (j) MW (Red line)
Irrigation water types clearly affected AI and IR values (Fig. 8). TW gave the highest values for AI and IR compared with other irrigation water treatments. The values of AI and IR are 24.000 and 0.062 cm/min after 240 min. These high values resulted from the improvement in the soil physical properties due to the lower value of SAR of TW. The lowest value for AI and IR were recorded for RW and that was because RW had high value of SAR which deteriorated the soil physical properties, reduced soil porosity. The values of AI and IR are 16.900 and 0.047 cm minG1 after 240 min. The high Na+ ions of RW increased the soil bulk density and reduced soil total porosity which resulted in lower water movement through the soil section. These results are confirmed by the results found by Shainberg and Singer (1990) who mentioned that the high salinity reduced IR of the soil.
Water treatments WWT, WW and MW gave medium values of AI and IR between the values of TW and RW. The organic materials in these types of water improved soil AI and IR. The values of AI are 21.90, 19.90 and 18.02 cm for WWT, WW and MW, respectively. For IR, the values are 0.085, 0.053 and 0.050 cm/min, respectively. The supervision of WWT treatment is related to the organic materials which improved the soil physical properties while WW carried great amount of hard materials which closed some the soil pores and that reduced water infiltration. These results are supported by the results found by Magesan et al., 2000; Williamson et al., 1999).
CONCLUSION
The soil saturated hydraulic conductivity decreased with growth season progress for both depths. Depth of 30-60 cm gave lower soil saturated hydraulic conductivity compared with depth of 0-30 cm. The cumulative infiltration and infiltration rate increased in the soil irrigated by magnetized water compared with the soil irrigatedby non-magnetized water at the end of the growth season. The effect of the water quality treatments on both parameters is in order TW>WWT>WW> MW>RW.
REFERENCES
AL-Mosawi, K.A., 2007. [Effect of irrigation water quality frequency and soil moisture contents on soil physical and chemical properties of Al-hammar marsh soil and consumptive water use of sorghum crop]. Ph.D Thesis, Department of Soil and Water Science Collage, University of Basrah, Basrah, Iraq. (In Arabic)
APHA., 2005. Standard Methods for the Examination of Water and Wastewater. 21st Edn., American Public Health Association, Washington, DC, USA., ISBN:9780875530475,.
Al-Atab, S.M., 2001. [Effects of soil aggregate size on physical properties, water movement in the soil and growth of Maize plant (Zea mays L.)]. MSc Thesis, University of Basrah, Basrah, Iraq. (In Arabic)
Al-Hadi, S.S., 2003. Effect of irrigation water salinity on soil physical properties and corn growth. Basrah J. Agric. Sci., 16: 37-52.
Al-Mosawi, K.A., 2011. Treatment of saline water by care-free water conditioners equipment and its effect on some of the soil physical properties and sodium adsorption ratio in the silty clay soil. Basrah J. Agric. Sci., 24: 114-131.
Al-Rawi, K.M. and A.M. Khalaf-Allah, 1980. Design and analysis of agricultural experiments. El Mousel Univ. Iraq, 19: 487-487.
Al-Shamy, Y.A., 2013. [Effects of soil conditioners addition on physical and chemical properties, the efficiency of drip irrigation and surface irrigation in clay soil and growth of Maize plant (Zea mays L.)]. MSc Thesis, Universityof Basrah, Basrah, Iraq. (In Arabic)
Al-Younis, A.A., M.A. Mohammed and Z.A. Alias, 1987. Grain crops. Master Thesis, Ministry of Higher Education and Scientific Research, University of Mosul, Mosul, Iraq.
Ghanbari, A., J. Abedikoupai and J. Taie Semiromi, 2007. Effect of municipal wastewater irrigation on yield and quality of wheat and some soil properties in sistan zone. J. Sci. Technol. Agric. Nat. Resour., 10: 59-74.
Gill, W.R. and G.E. Vandenberg, 1968. Soil Dynamics in Tillage and Traction. Agricultural Research Service, United States Department of Agriculture, Washington, DC., USA.,.
Jackson, M.L., 1958. Soil Chemical Analysis. Printice-Hall Inc., Engle Wood Cliffs, New Jersy, USA., Pages: 498.
Karimzadeh, M., A. Alizadeh and A.M. Mohammady, 2013. Effect of irrigation with waste water on soil saturated hydraulic conductivity. J. Water Soil, 26: 1547-1553.
Magesan, G.N., J.C. Williamson, G.W. Yeates and A.R. Lloyd-Jones, 2000. Wastewater C:N ratio effects on soil hydraulic conductivity and potential mechanisms for recovery. Bioresour. Technol., 71: 21-27.
Page, A.L., D.R. Keeney and R.H. Miller, 1982. Methods of Soil Analysis: Part 2 Chemical and Microbiological Properties. 2nd Edn., American Society of Agronomy, Inc., Madison, Wisconsin, USA.,.
Pescod, M.B., 1992. Wastewater Treatment and use in Agriculture. Food and Agriculture Organization, Rome, Italy, ISBN: 9789251031353, Pages: 125. Philip, J.R., 1957. The theory of infiltration, I. The
infiltration equation and its solution. Soil Sci., 83: 345-358.
Richards, L.A., 1954. Diagnosis and Improvement of Saline and Alkali Soils. United States Department of Agriculture, Washington, DC. USA., Pages: 166. Shainberg, I. and M.J. Singer, 1990. Soil Response to
Saline and Sodic Conditions. In: Agricultural Salinity Assessment and Management, Tanji, K.K. (Ed.). Am. Soc. Civil Eng., USA., pp: 91-112.
Vinten, A.J.A., U. Mingelgrin and B. Yaron, 1983. The effect of suspended solids in wastewater on soil hydraulic conductivity: II. Vertical distribution of suspended solids1. Soil Sci. Soc. Am. J., 47: 408-412.
Williamson, J.C., G.P. Sparling, G.N. Magesan, L.A. Schipper and A.R. Lloyd-Jones, 1999. Hydraulic conductivity in soils irrigated with wastewaters of differing strengths: Field and laboratory studies. Aust. J. Soil Res., 37: 391-402. Yasser, A.K., 2010. [The use of magnetized water