How many defects?!
Nynke Meijer
This report is intended for the St. Antonius-Hospital Gronau GmbH and for my supervisor from the University of Twente. This version is the public report in which some parts are left out and marked as (Restricted).
University of Twente St. Antonius-Hospital Gronau GmbH Industrial Engineering and Management
Postbus 217 7500 AE Enschede Tel. (053)4 89 91 11
Möllenweg 22 D-48599 Gronau Tel. +49 2562 9150
Student
N.J. Meijer – s1830260
Industrial Engineering and Management University of Twente
Supervisors
University of Twente St. Antonius-Hospital Gronau GmbH Dr. E. Topan
Industrial Engineering and Business Information Systems (IEBIS)
Dr. med. C. Wagner, FEBU
Head of Robotic Urology
Dr. I. Seyran Topan
Industrial Engineering and Business Information Systems (IEBIS)
Prof. Dr. med. Dr. phil. M. Oelke, FEBU
Head of the study and science center of Prostatazentrum Nordwest
E. Grävemäter
Marketing and business manager
J. Breer
Commercial manager
Publication information Publication date: 4 July 2019
Number of pages including appendices: 58 Number of pages excluding appendices: 30 Number of appendices: 5
Before you lies my bachelor thesis ‘How many defects?!’, which is about the study that I performed at the St. Antonius-Hospital Gronau GmbH. With this study, I finish my Bachelor’s programme in Industrial Engineering and Management at the University of Twente. It was nice to apply the knowledge that I gained in the last three years to this project. I learned a lot about robotic surgery and it was a privilege that I got the opportunity to attend and observe several surgeries.
I would like to thank Prof. Matthias Oelke for supervising my project. Thank you for giving feedback on the parts of the report which I sent you over the course of the weeks. I would also like to thank Dr. Christian Wagner. Thank you for sharing your knowledge about the Da Vinci® robotic system and for being interested in the progress and results of my study. I also want to thank you for reading my final report and for the useful feedback that you gave. Additionally, I would like to thank Esther Grävemäter and Jens Breer. Thank you for welcoming me in the hospital and for always making sure that I was doing fine and that I had everything I needed.
Furthermore, I would like to thank my supervisor from the University of Twente, Engin Topan. Thank you the feedback you gave me and for your quick responses when I mailed you.
Finally, I want to thank my housemates, friends and family. Thank you for your interest and support. Nynke Meijer
Problem definition
The St. Antonius-Hospital Gronau GmbH uses the Da Vinci® robotic system of the company Intuitive Surgical to perform Minimally Invasive Surgery. This robotic system contains a robot to which multiple surgery instruments are connected. These instruments have a lifespan of ten uses. However, sometimes they break down earlier. The supplier does not always refund the remaining, unused lives. Each time an instrument is defect, the instrument is returned to the supplier and the failure description and the amount credited are stored in a database. However, the hospital does not use this information. As a result, the hospital does not know how to decrease the number of defects or how to defend itself at the supplier to get a refund. So, the core problem is the following:
The hospital does not have a supporting system to analyse the failures of the Da Vinci® instruments to evaluate which defect types occur most frequently or cause the greatest financial loss.
Method
To solve this problem, we used the database to investigate which instruments caused the biggest financial loss during 2015 to 2018. This turned out to be the Curved Bipolar Dissector and the Hot ShearsTM (Monopolar Curved Scissors). Therefore, we focussed on these instruments. Additionally, we investigated the instruments with similar functions because they might have similar failure types. These instruments are the instruments that can be categorised as EndoWristTM Bipolar Cauterisation Instruments or as EndoWristTM Monopolar Cauterisation Instruments.
We developed a data analysis tool in Excel to analyse the failure data and to categorise the defects per failure type. We used Failure Mode Effect and Criticality Analysis to perform this categorisation. Additionally, we searched for possible failure causes. We did this by carrying out a systematic literature review and by observing staff and by having conversations with them.
Results
This resulted in a data analysis tool which the hospital can use to analyse future failure data. We already used the tool to analyse the data from 2015 to 2018. It turned out that the average financial loss per year is €27,669. There is no clear increase or decrease of the loss per surgery. The failure types that happened most often were bent tips, bent shaft extensions and scratched blades.
Conclusion and discussion
For these failure types, possible causes are found. (Restricted) The lack of haptic feedback might cause surgeons to apply too much force on the instruments.
Glossary ... 6
1. The context ... 7
1.1. Da Vinci® robot ... 7
1.2. Defect handling process of instruments ... 9
2. The problem ... 10
2.1. Problem identification ... 10
2.2. Intended deliverables ... 11
2.3. Scope ... 11
2.4. Research questions... 11
3. Research design ... 12
3.1. Research type ... 12
3.2. Research subjects ... 12
3.3. Key variables ... 12
3.4. Theoretical perspective ... 12
3.5. Framework ... 13
4. Instruments causing greatest loss ... 14
4.1. Comparison of defect instruments ... 14
4.2. Conclusion ... 15
5. Defect causes ... 17
5.1. According to the data of the hospital ... 17
5.2. According to the literature ... 19
5.3. According to observations in the hospital ... 21
6. Information in the tool ... 23
6.1. FMECA ... 23
6.2. Reliability measures ... 24
6.3. Dashboard ... 24
7. Results from the tool ... 26
Conclusion ... 27
Conclusion ... 27
Discussion ... 27
Recommendations ... 28
Bibliography ... 29
A. User manual ... 31
A.1. Using the tool ... 31
A.2. Maintenance on the tool ... 34
B. FMECA ... 36
C. Data modifications ... 42
D. Systematic literature review protocol ... 43
D.1. Key concepts ... 43
D.2. Inclusion and exclusion criteria ... 43
D.3. Databases ... 43
D.4. Search terms and strategy ... 44
D.5. Results ... 48
Criticality Average financial loss per year per failure type FMECA Failure Mode Effect and Criticality Analysis
Hospital’s report The report which the hospital makes and sends to the supplier when an instrument malfunctions
MIS Minimally Invasive Surgery
OR Operation room
In this chapter, we are introducing the context of this study. ®
This study is about the Da Vinci® robotic system of the company Intuitive Surgical. This is a surgery robot which can be steered by the surgeon to perform Minimally Invasive Surgery (MIS), which is surgery via a few little holes in the body. The St. Antonius-Hospital Gronau, Germany, which we will call ‘the hospital’ from now on, uses five of these robotic systems (including one for training). It uses them primarily for urologic surgeries (e.g., robot-assisted radical prostatectomy, partial nephrectomy or cystectomy).
The system consists of three components: the surgeon console, the patient cart, and the vision cart
(Intuitive Surgical, 2019). These are shown from left to right in Figure 1. During the surgery, the surgeon sits at the surgeon console. He watches a screen with a 3D image of the abdomen and uses his hands and feet to control the robotic arms. The system enlarges the image up to ten times; therefore, the surgeon is able to visualise the operative field enlarged and in greater detail compared to conventional MIS. The patient cart is the component of the system which consists of four robotic arms to which the instruments the surgeon uses during the operation are attached. Finally, the vision cart contains several screens that show the video to the other staff in the operation room (OR), especially to the assistants who sit next to the patient to operate extra instruments. In addition, the vision cart connects the instruments to the power source and hosts the insufflator, which supplies CO2 gas to maintain pressure in the patient’s abdominal cavity.
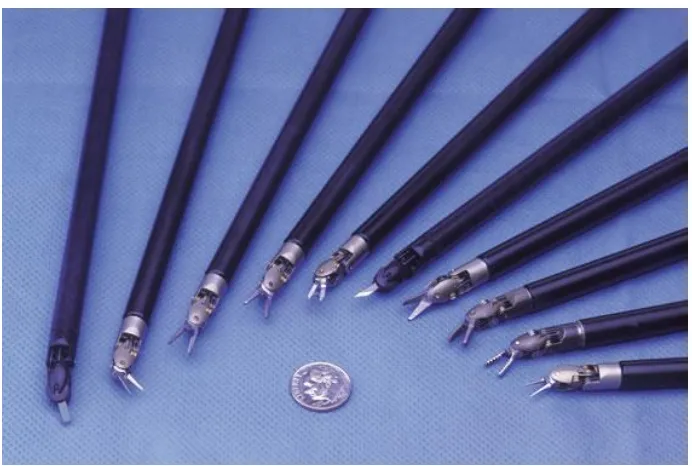
[image:7.595.76.515.459.671.2]After the patient is anesthetised and operation site is disinfected, the OR assistants insert small metal tubes in the abdominal wall to get access to the patient’s belly. An assistant then moves the patient cart to the patient and attaches the instruments to the four robotic arms. One of these instruments is the endoscope (i.e., the internal camera). The other three instruments are for example scissors, graspers and needle drivers. Some of these instruments can use an electrical current to cauterise tissues and vessels to prevent them from bleeding.
Figure 2: Variety of Da Vinci® EndoWrist™ Instruments (e.g., different scissors, graspers and needle drivers) (Reprinted from Maxon motor website, by Intuitive Surgical Inc., 2010, retrieved from
https://www.maxonmotorusa.com/maxon/view/application/Surgical-Robots-for-Minimally-Invasive-Procedures)
Figure 3: Front part of the Hot ShearsTM (Monopolar Curved Scissors) (Reprinted from Instrument & Accessory Catalog, by Intuitive Surgical Inc., 2015, retrieved from https://www.intuitivesurgical.com/images/on-site-banners/1008471rB-EU_Xi_IA_Catalog.pdf)
Tip cover which covers the shaft extension and several wires. Blades (or tips)
[image:8.595.125.471.172.405.2]Amongst others, some of the advantages of the robotic system are minimising trembling of the surgeon’s hands, and holding the endoscope in a stable position during the operation. Moreover, the robotic instruments have more degrees of freedom than conventional instruments (five degrees in conventional laparoscopic vs seven degrees in robot-assisted surgery) thanks to the EndoWristTM technology in the shaft extension (i.e., the component between the tip and the shaft). Hence, the Da Vinci® robot can replicate all hand movements of the surgeon even beyond the natural limits. The instruments can be used for a defined number of operations, for most of the instruments ten times. Between the uses, the instruments are cleaned and sterilised in the hospital. The re-use cycles are programmed in the instrument (i.e., when the maximum life cycle is reached, the robot will no longer accept the use of the instrument). Therefore, the hospital cannot use the instruments more often than the pre-defined number of lives.
When one of the instruments of the robot breaks before the end of the life cycle, the OR staff marks the instruments and claims and describes the defects. The purchasing department of the hospital then returns the instrument to the supplier. The supplier then investigates which component of the instrument caused the defect and sends the results of the investigation back to the hospital. If the defect is caused by a product-related error (e.g., a material or production error) and is still under warranty, the supplier will refund the instrument. The amount of the refund is then based on the remaining lives of the instrument. However, if the defect is caused by a mistake of the hospital (e.g., wrong usage etc.), the supplier will not refund the instrument, so the hospital must pay for a new instrument.
In this chapter, we are describing the research aim and methodology.
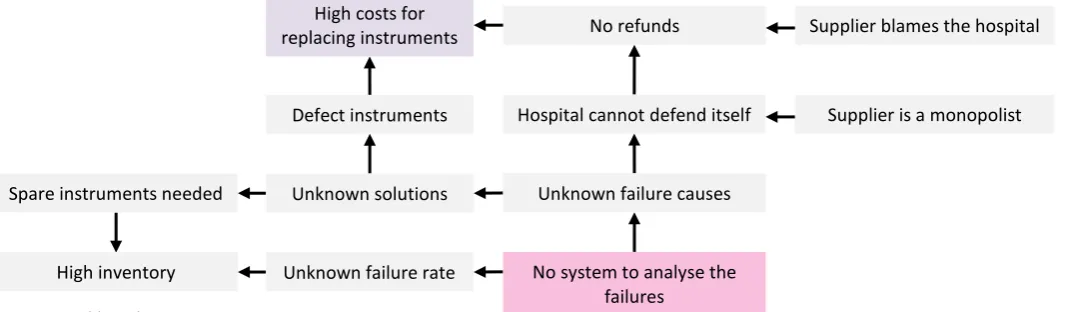
The problem the hospital faces is that instruments of the robot occasionally break and the supplier does not always refund the costs or provide new instruments. If we go back in the causal chain, we find that one of the reasons for this is that the supplier generally attributes the defect to a failure in the hospital rather than to a product-related error. This can be seen in Figure 4. Therefore, the hospital must frequently pay for new instruments. Although the supplier provides the hospital with short descriptions of the failures, the hospital has not investigated these data so far. Therefore, the hospital is unaware of how many instruments break down exactly or how much instrument failure costs. Consequently, the hospital does not know how to lower the costs for replacing instruments. This is a cause that we can influence. Therefore, the core problem is:
The hospital does not have a supporting system to analyse the failures of the Da Vinci®
instruments to evaluate which defect types occur most frequently or cause the greatest financial loss.
The hospital is not able to investigate the cause(s) of these defects. The purpose of this study is to develop a data analysis tool for the hospital to categorise the defects per component and per failure type (e.g., bent tip or broken wire) in order to show which instruments and defect types cause high costs and what possible causes of these defects can be. By using this procedure, the hospital will know which defects it needs to identify and correct. This can be achieved by either preventing the cause of the failure (e.g., wrong usage) in the hospital or by approaching the supplier to get a refund.
[image:10.595.35.570.450.606.2]Once the problem has been identified, we can define the norm and reality. We will measure the norm and reality in two ways. Firstly, by the percentage of defects that are categorised and secondly, by the percentage of the defects of which the cause is suggested correctly. The reality is that currently no defects are categorised. The norm for the first measure is that hundred percent of the defects are classified as a specific failure type. The norm for the second measure is that hundred percent of these classifications is correct. We will not be able to measure the latter, because that will need to be assessed after using the tool for a while. However, we will implement the measure in the system so that the hospital can measure it later.
Figure 4: Problem cluster Spare instruments needed
High inventory
Supplier is a monopolist Supplier blames the hospital
Unknown failure causes
No system to analyse the failures
Hospital cannot defend itself No refunds
Unknown solutions
Unknown failure rate Defect instruments
The goal of this study is to deliver a spreadsheet tool that structurally analyses failure data by categorising defects. Hereby, it should show which instruments and which failure types cause the biggest financial loss. In addition, on the dashboard, possible failure causes should be suggested. These causes are suggestions and no proofs, so they should always be checked by the staff. Another feature of the tool is that it should learn from user feedback to provide better suggestions. This tool can be used by the purchasing department to reduce the financial loss that the defects cause. This can be done by improving the acts of the staff or by talking to the supplier about the failures.
In this study, we focus on two versions of the Da Vinci® system, namely the Da Vinci® Xi and the Da Vinci® X. These are the two models which the hospital currently uses. We will look at the instrument failure data of these models of the years 2015 to 2018. The reason for this time frame is that the first Xi system was put into use at the end of 2014. So, 2015 was the first year in which the instruments were used from the start of the year. Most failures from then on are about the X and Xi instruments. So, they are relevant for this study.
To solve the problem, several things needed to be done. Therefore, we defined research questions:
1. Which instruments caused the biggest financial loss from 2015 to 2018?
First, we investigated which instruments caused the biggest financial loss from 2015 to 2018. These instruments are the instruments which we would investigate.
2. What causes the defects of these instruments?
For the instruments that caused the biggest financial loss, we investigated which components caused the defects and what could be potential causes for the breakdowns of these components. We did this by examining the failure descriptions which the supplier provides. Additionally, we looked for other possible causes in the literature. Further, we made a process map of the flow of the instruments through the hospital, from being delivered to being sterilised and being used. This way, we could point out in which stage mistakes are most likely to be made. Also, we investigated if the staff correctly handles the instruments and we asked them what they thought could cause the defects.
3. Which information should be in the dashboard?
Using this information, we were able to develop the dashboard. This dashboard should be useful for the hospital, so we first investigated which information was important to show on the dashboard. When this was implemented, the commercial manager, who will be the user, tested the tool, to see if it was user friendly and if all necessary information was included.
4. How can the hospital use the dashboard to prevent high replacement costs in the future?
Now that the problem and research questions are described, we will explain more about the design of the research.
This study is a case study in which we designed a tool for the St. Antonius-Hospital Gronau to analyse data and to indicate which failure types need attention and what possible causes are. We gathered the needed data mainly through asking for the data that the hospital received from the supplier and by observing how the staff handles the instruments. The purpose of this research is mainly descriptive and slightly reporting, because we wanted to show how big the financial loss is that is caused by the defects, and which instruments contribute the most to this. In addition, the study is causal-explanatory, because the tool which we design suggests possible causes.
In this study, there are several research subjects. The main research subjects are the defect instruments, because that is what this study is about. Other research subjects are the employees of the hospital, because they use the instruments. We observed them while doing that to find possible failure causes. Further, the user of the tool is a research subject, because the tool should be user friendly.
The variables that we used in this research and in the tool that we developed are the following: • Size of the problem, which is measured by the cost of the defects since 2015 and within the
last six months.
• Most urgent failure type, which is measured by the cost per failure type since 2015 and within the last six months.
• Categorisation completeness of the dashboard, which is measured by the percentage of the defects that the tool could categorise by using the results of the supplier’s investigation. • Categorisation consistency of Intuitive Surgical, which is measured by the percentage of the
defects for which the results of the supplier’s investigation are consistent with the results of similar defects in the past.
• Cause suggestion reliability of the dashboard, which is measured by the percentage of the failure causes which the tool suggested right according to the hospital’s staff.
The reason that the time frame for the first two variables is the last six months is that that is enough to see if the failure is just an accident or if it becomes a trend, while you are still in time to intervene. Additionally, from the data we observed that of quite some instruments defects are occurring during more than half a year.
shows the name and function of the component, the failure mode and the frequency, effects, symptoms, severity and criticality of the failure mode (Topan, 2019). More information about the FMECA can be found in paragraph 6.1, where we will explain how we derived the needed information from the database.
The reason that we used this analysis method is that is a structured approach. This makes it harder to forget a failure. In addition, the fact that the FMECA form is a standardised way of displaying the results makes it more suitable for implementation in a spreadsheet tool. Namely, a spreadsheet tool cannot easily analyse graphical data, but it can analyse textual data, in particular when it is in a standardised form. Therefore, the FMECA is useful to categorise the failures of the hospital automatically.
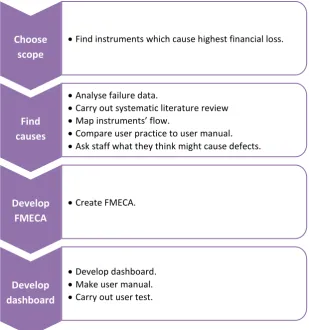
The framework that we used for this study is shown in Figure 5. In this framework the research questions and theoretical perspective are combined.
•Find instruments which cause highest financial loss.
•Analyse failure data.
•Carry out systematic literature review •Map instruments’ flow.
•Compare user practice to user manual. •Ask staff what they think might cause defects.
•Create FMECA.
•Develop dashboard. •Make user manual. •Carry out user test.
Choose scope
Find causes
Develop FMECA
[image:13.595.70.380.303.634.2]Develop dashboard
In this chapter, we are showing which instruments caused the greatest financial loss from 1 January 2015 until 31 December 2018. The purpose of this is to decide on the scope of this study.
The instruments can be divided into several categories (e.g., EndoWrist cauterisation instruments, graspers and needle drivers). In Figure 6, the categories in which defects have happened during the last four years are illustrated. It can be concluded that the instruments which caused the greatest financial loss are both the bipolar and monopolar EndoWrist cauterisation instruments. The two instruments which caused the greatest part of the loss are the Curved Bipolar Dissector (purple) and the Hot ShearsTM (Monopolar Curved Scissors; green).
In Figure 7, it can be seen that the Curved Bipolar Dissector and the Hot ShearsTM (Monopolar Curved
Scissors) already cause the highest loss for a long time. So, this is a long-lasting problem. € -€ 10,000.00 € 20,000.00 € 30,000.00 € 40,000.00 € 50,000.00 € 60,000.00 € 70,000.00 EndoWrist Bipolar Cauterisation Instruments EndoWrist Monopolar Cauterisation Instruments
EndoWrist Graspers EndoWrist Needle Drivers
Total financial loss per instrument category
ProGrasp™ Forceps
Maryland Bipolar Forceps
Long Bipolar Grasper
Large Needle Driver
Hot Shears™ (Monopolar Curved Scissors)
Fenestrated Bipolar Forceps
[image:14.595.25.553.264.467.2]Curved Bipolar Dissector
Figure 6: Total financial loss per instrument category from 2015 to 2018
€ -€ 2,000.00 € 4,000.00 € 6,000.00 € 8,000.00 € 10,000.00 € 12,000.00 € 14,000.00
Q1 Q2 Q3 Q4 Q1 Q2 Q3 Q4 Q1 Q2 Q3 Q4 Q1 Q2 Q3 Q4
2015 2016 2017 2018
Long term financial loss per instrument
Curved Bipolar Dissector
Fenestrated Bipolar Forceps
Hot Shears™ (Monopolar Curved Scissors)
Large Needle Driver
Long Bipolar Grasper
Maryland Bipolar Forceps
ProGrasp™ Forceps
[image:14.595.27.546.540.755.2]Some instruments are used more often and for longer times than others. So, it is logical if these instruments break more often. To take this into account, we look at the number of defects in comparison to the number of purchases and at the financial loss in comparison to the purchase price. We did this by using percentages. For the instruments that broke, these percentages are shown in Figure 8. Additionally, the number of purchases is shown. The reason why we compared the number of defects to the number of purchases instead of to the number of instruments that last their entire life cycle is that there is no data about the latter.
From the figure, it can be seen that the Small GraptorTM (Grasping Retractor), Hot ShearsTM (Monopolar
Curved Scissors), Long Bipolar Grasper and the Curved Bipolar Dissector had the highest defect rate in comparison to their number of purchases. However, the Small GraptorTM (Grasping Retractor) did not cause a financial loss, because the single time that it broke, it was refunded. So, we can conclude that the fact that the Curved Bipolar Dissector and Hot ShearsTM (Monopolar Curved Scissors) caused the highest loss for a long time is not solely caused by the fact that they are used frequently. The number of defects as a percentage of the number of purchases is also relatively high. Additionally, the Long Bipolar Grasper had a high percentage of defects and should therefore also be investigated.
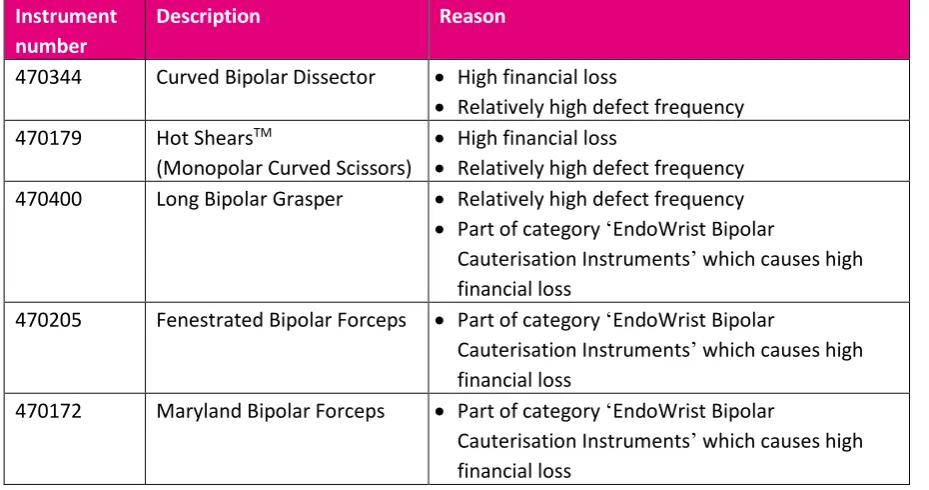
The instruments on which we will focus in this study will be the instruments that have caused the greatest financial loss and the instruments which broke relatively frequently in comparison to their number of purchases. In addition, we will include instruments which broke less frequently but are part of an instrument category that caused a big financial loss, namely the Long Bipolar Grasper,
Fenestrated Bipolar Forceps and the Maryland Bipolar Forceps, because the causes of the defects of these instruments might also have caused defects of other instruments in the same category. The instruments on which we will focus are shown in Table 1.
0% 10% 20% 30% 40% 50% 60% 70% 80% 90% 100% ProGrasp™ Forceps Maryland Bipolar Forceps Long Bipolar Grasper Large Needle Driver Hot Shears™ (Monopolar Curved Scissors) Curved Bipolar Dissector Small Graptor™ (Grasping Retractor) Vessel Sealer Extend Tip Cover Accessory
Instruments with relatively high defect rate
Number of defects in comparison to number of purchases
[image:15.595.25.575.333.601.2]Loss in comparison to purchase price
Figure 8: Instruments with relatively high defect rate
180 39 13 182 229 151 1 30 2100 Number of
Table 1: Instruments on which this study will focus
Instrument number
Description Reason
470344 Curved Bipolar Dissector • High financial loss
• Relatively high defect frequency 470179 Hot ShearsTM
(Monopolar Curved Scissors)
• High financial loss
• Relatively high defect frequency 470400 Long Bipolar Grasper • Relatively high defect frequency
• Part of category ‘EndoWrist Bipolar
Cauterisation Instruments’ which causes high financial loss
470205 Fenestrated Bipolar Forceps • Part of category ‘EndoWrist Bipolar
Cauterisation Instruments’ which causes high financial loss
470172 Maryland Bipolar Forceps • Part of category ‘EndoWrist Bipolar
In this chapter, we are showing which defect types happen most often and which causes are known of these defects. We found these causes by investigating the data of the hospital, by carrying out a systematic literature review (of which the protocol can be found in appendix D) and by observing the flow of the instruments through the hospital. We included these causes in the data analysis tool to combine them with the FMECA, which can be found in appendix B.
Using the database with all failure data of the Da Vinci® X and Xi robotic systems of the hospital, we investigated which components of the instruments got damaged and which type of damage it was.
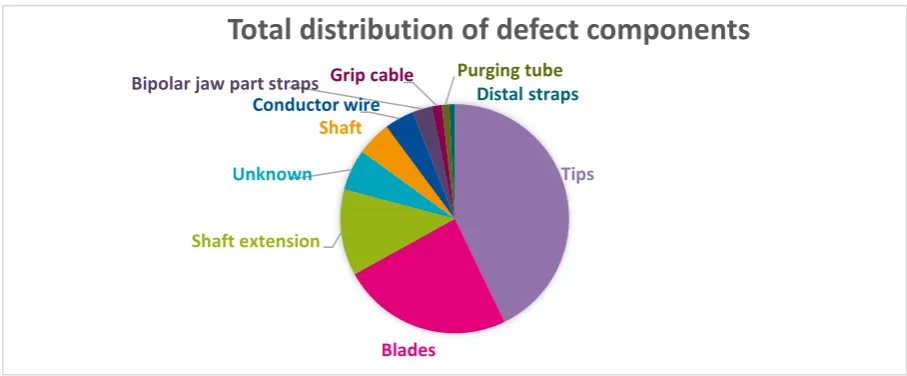
In Figure 9, the components that broke most frequently are shown. We can conclude that the instrument tips broke most often. In addition, the blades and the shaft extensions broke often.
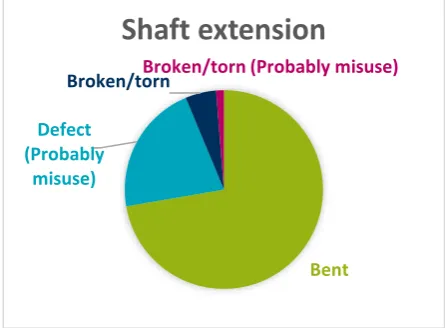
In Figure 10 and Figure 11, the failing components of the two instruments that caused the greatest loss are shown. These figures show that in case of the Curved Bipolar Dissector mainly the tips fail and that with the Monopolar Curved Scissors, the blades and the shaft extension fail most often.
[image:17.595.70.524.299.487.2]Figure 10: Distribution of the defect components of the Curved Bipolar Dissector
Figure 11: Distribution of the defect components of the Monopolar Curved Scissors
Tips
Unknown
Shaft
Conductor wire
Bipolar jaw part straps
Grip cablePurging tube Distal straps
Curved Bipolar Dissector
Blades
Shaft extension
Unknown
Conductor wire Grip cable
Hot Shears
™ (Monopolar
Curved Scissors)
Tips
Blades
Shaft extension
Unknown
Shaft
Conductor wire
Bipolar jaw part straps Grip cable Purging tubeDistal straps
Total distribution of defect components
[image:17.595.70.520.572.745.2]From the data, we can conclude, that the problem with the tips most of the time is the fact that they are bent (Figure 13). The problem that Intuitive Surgical reports about the shaft extensions is ‘miscellaneous’. However, from the hospital’s reports we can conclude that it has the same symptoms as the failure type of the tips, which was ‘bent’. So, the shaft extensions are also bent (Figure 12). Further, the blades always have mechanical notches or scratch marks (Figure 14). According to the reports of Intuitive Surgical, most of the failures of the tips and blades might be caused by misuse.
[image:18.595.185.408.190.354.2]In Table 2, the most frequently failing components are shown, as well as the corresponding failure types and the possible causes according to the supplier’s reports.
Table 2: Frequent defects and possible defect causes according to the supplier's reports.
Component Failure type Cause
Tips Bent Misuse
Shaft extension Bent
Blades Mechanical notches or scratch marks Misuse
Figure 13: Distribution of the failure types of the tips. Figure 14: Distribution of the failure types of the blades.
Bent (Probably
misuse)
Mechanical notch/burr (Probably misuse)
Bent Unknown
Tips
Mechanical notch/burr (Probably misuse)
Scratch marks/graze (Probably misuse)
Blades
Bent
Defect (Probably
misuse)
Broken/tornBroken/torn (Probably misuse)
Shaft extension
[image:18.595.73.522.381.549.2] [image:18.595.72.531.658.723.2]Using systematic literature review, we investigated which failure causes are known by the literature. The systematic literature review protocol can be found in appendix D. Sometimes these causes resulted in failures that could be solved during the surgery, for example by restarting the system. Other causes resulted in permanent defects. In the latter case, the defect components needed to be replaced. We focussed on the last type of defects, because that is about instrument failure. However, we also included failure causes of non-permanent failures of the robotic arms, because these could influence instrument failure.
Components that fail relatively frequently, without causing permanent defects, are the robotic arms. The arms can collide if they are mispositioned (Buchs, Pugin, Volonté, & Morel, 2014) or make large movements (Corcione et al., 2005). To solve this problem, 8 mm instruments can be used instead of 5 mm instruments: Although some studies suggest that 8 mm instruments are less effective (Corcione et al., 2005), Ballouhey et al. showed that 8 mm instruments cause less instrument collisions and less damage to the patient (Ballouhey et al., 2018). The St. Antonius-Hospital Gronau mainly uses 8 mm instruments. In 2018, the hospital bought 30 times as many 8 mm instruments as 5 mm instruments. None of the 5 mm instruments broke, but they are also barely used, so it cannot be concluded that the 5 mm instruments are of better quality than the 8 mm instruments. However, from the failure data of the hospital it can neither be concluded that the 8 mm instruments are qualitatively better.
Although failure of the robotic arms does not automatically result in defects, failure of the instruments does. So, it is important to know the causes for these failures. Friedman, Lendvay and Hannaford (2013) divide instrument failures in five categories, which are, in order of reported frequency: wrist or tool-tip, cautery, shaft, cable and control housing. They do not mention many failure causes, but for shaft defects they mention that shafts can be scratched by scraping against the cannula through which the instrument enters the body or by instrument collision or misusage. According to Nayyar and Gupta (2010), defects which involve broken wires, can be caused by user-related mistakes (e.g., moving the instruments beyond their range).
Instruments that fail often are the scissors. These failures are primarily broken tool tips/blades (Buchs et al., 2014; Friedman et al., 2013). Additionally, the tool tip covers are fragile and hard to install (Friedman et al., 2013). So, the fact that a great force is needed to install the tool tips could probably be a cause of the frequent defects of the scissors.
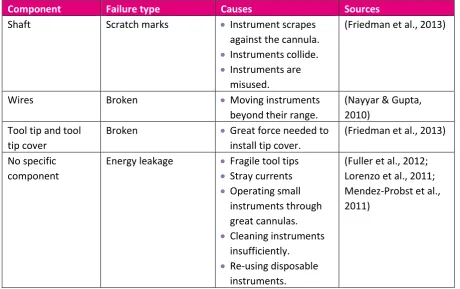
From this literature review, we extracted several possible failure causes (Table 3). However, many articles solely describe the failures and the failure frequencies. Not much research has been done on failure causes.
Table 3: Defect causes according to literature
Component Failure type Causes Sources
Shaft Scratch marks • Instrument scrapes
against the cannula. • Instruments collide. • Instruments are
misused.
(Friedman et al., 2013)
Wires Broken • Moving instruments
beyond their range.
(Nayyar & Gupta, 2010)
Tool tip and tool tip cover
Broken • Great force needed to
install tip cover.
(Friedman et al., 2013) No specific
component
Energy leakage • Fragile tool tips • Stray currents • Operating small
instruments through great cannulas. • Cleaning instruments
insufficiently. • Re-using disposable
instruments.
After having investigated what could cause the defects according to the literature, we observed the usage of the instruments in the hospital. We observed this both during surgeries and during the cleaning and sterilisation processes. In this paragraph, we will show the flow of the instruments and indicate in which phase the cause of the defects could probably be found.
We are using a flow chart to show the flow of the instruments through the hospital. This flow chart is shown in Figure 15.
[image:21.595.49.573.215.559.2]If mistakes were made in the cleaning and packing rooms, problems would occur with multiple instruments, because in these rooms, all instruments are treated in the same way. Therefore, it is most likely that defects are caused by a product-related error (e.g., a material or production error) or during a process in the operation room. During surgery some instruments are used more frequently than others and the different instruments are used for different purposes and in different ways. So, if a specific instrument breaks relatively often it may be caused by a product-related error at the supplier or by wrong usage during the surgery.
During the surgery, we noticed a few possible causes of defects. (Restricted)
Another flaw during the surgery was that second and third arm interfered close to collision. These were the arms to which the endoscope and the Curved Bipolar Dissector were attached. From the literature, no cases appeared in which interference of arms caused damage to the instruments. However, this interference can be solved by moving the back end one of the arms towards the other arm. Hereby, the front ends can work in parallel (Intuitive Surgical Inc., 2018a).
In a conversation with the surgeon, two other possible failure causes came forward. Firstly, the lack of haptic feedback can cause surgeons to use too much pressure, which can bend the instrument tip. (Restricted)
Additionally, we observed that much pressure was needed to install the tip cover, as the literature stated. The reason for this is that the tooltip must be tight.
(Restricted)
[image:22.595.70.526.414.687.2]In summary, by observing the flow of the instruments and by having conversations with staff members, we found several possible failure causes. These are shown in Table 4.
Table 4: Possible defect causes according to our observations and conversations.
Instrument Component Failure type Cause
Instruments which break relatively frequently
- - • Product-related
error at the supplier • Wrong usage during
the surgery (Restricted) (Restricted) (Restricted) (Restricted)
- Blades • Bent • Tip covers are hard
to install. (Restricted) (Restricted) (Restricted) (Restricted)
- Tips, blades or shaft
extension
• Mechanical notches • Bent
Now that we defined the scope and found causes for the defects of the instruments which are part of this scope, we could build a data analysis tool. This tool should support the hospital in analysing the failure data of the Da Vinci® instruments and it should show which instruments, components and failure types cause the highest financial loss and what could possibly cause these defects. To make this tool, we included several types of data. Firstly, we included the FMECA to analyse which failure types need attention. Secondly, we included the failure causes which are shown in the previous chapter. Thirdly, we added three reliability measures to show the reliability of the tool and the consistency of the supplier’s investigations. Finally, we made two dashboards that give an overview of this data. In this chapter, we are explaining more about these data and dashboards of the data analysis tool. The user manual of the tool can be found in appendix A.
The tool is built on the Failure Mode Effect and Criticality Analysis (FMECA). This analysis results in a table which contains several aspects. These aspects will be explained now.
The failure types (also called ‘failure modes’) of the defects are determined by splitting the results of the supplier into smaller parts containing the failing component and the failure type (e.g., bent or scratch marks). In some cases, we needed to modify the components or failure types. We will now explain why we did that.
In some cases, the results were not clear enough to categorise the defects. In these cases, we marked the components or failure types concerned as ‘Unknown’. In appendix C, we show which components and failure types this includes.
The failure type ‘Defect’ also sounds too general to show what type of failure occurred. However, this type of failure often happens to wires. It turns out that this means that the wires are broken (defect). So the failure type ‘Defect’ is clear enough and did not need to be marked as ‘Unknown’.
For components that were bent, there were two failure types: ‘Bent’ and ‘Strongly bent’. However, these failure types had equal effects and also in the hospital’s reports there were no differences. Therefore, these failure types were combined in the failure type ‘Bent’.
In the FMECA, the functions of the components and the effects of the failure types are included. The reason for this is that the function of the component indicates why it is a problem if the component malfunctions. The effect of the failure type is based on the lack of this function and on additional effects that appeared from the hospital’s report. The effect can show how harmful the failure is.
the symptom is ‘dull scissors’, but the supplier indicates that the problem is a broken cable instead of bent tips, the categorisation consistency of the supplier becomes less. This consistency measure is shown in the data analysis tool.
The failure mode frequency shows which percentage of the failures of a specific component are caused by a given failure type. For example, if the failure mode ‘Worn distally’ of the component ‘Grip cable’ has a failure mode frequency of 32%, it means that in 32 out of 100 grip cable defects the grip cable wore distally.
The failure rate shows per component or per instrument how often a failure happens on average per year.
We calculated the severity and criticality using the failure mode frequency, failure rate and the financial loss. The financial loss is calculated using the following formula: purchasing price / total lives * remaining lives – amount credited. So, the financial loss is the part of the costs of the unused lives which is not refunded. The severity is the average financial loss per defect per failure type and the criticality is the average financial loss per year per failure type.
On the homepage, three reliability measures are shown. These measures give an indication of the reliability of the conclusions and advices which the dashboard shows. The measures are based on the variables which I introduced in paragraph 3.3.
The categorisation completeness of the dashboard shows the percentage of the defects which are categorised by using the results of the supplier’s investigation. These categorised defects are all the defects of which the failure type is not ‘Unknown’.
The categorisation consistency of Intuitive Surgical shows the consistency of the results of the supplier’s investigation (i.e., the component and failure type according to the supplier) when compared to the symptoms. More information about this measure can be found in paragraph 6.1.3. The cause suggestion reliability of the dashboard shows the percentage of the failure types for which the cause is suggested right. There is not yet data for this measure. But when the data analysis tool is being used, the users can indicate if a suggestion is right. Based on that feedback, the measure will be updated.
In this chapter, we are showing the results that are obtained from the tool, based on the data from 2015 to 2018.
The loss that the defects cause is on average €27,669 per year. To compare this to the total amount of money spend on Da Vinci® instruments: In 2018, the loss caused by the defects was €27,552. This is about 1.2% of the €2.3 million that was spent on purchasing Da Vinci® instruments in that year. When looking at the number of defect instruments, instead of at the loss that is caused by the defects, a higher percentage is found: Of the instruments that were purchased in 2018, 11.9% broke.
The losses per surgery case in 2015 to 2018 are respectively €24, €19, €21 and €16. So, there is no clear increase or decrease of the loss per surgery. The same conclusion holds for the number of defects per surgery, which are respectively 0.05, 0.06, 0.07 and 0.06.
Looking at the defects from the last six months of 2018, we see that the defects that happen most frequently are bent shaft extensions and scratched blades. We also see this when we look at the long-term data from 2015 to 2018. In the long-long-term data we also see another frequent defect, namely bent tips. This will probably be related to the bent shaft extension, because these are connected. The instrument that breaks most often in both the long-term and the short-term is the Hot-ShearsTM (Monopolar Curved Scissors).
In this conclusion, we will first show the conclusions of the study. Thereafter, we will show the limitations of this study and give recommendations for further research.
Conclusion
The core problem which this study is about, is: ‘The hospital does not have a supporting system to analyse the failures of the Da Vinci® instruments to evaluate which defect types occur most frequently or cause the greatest financial loss.’
Data analysis tool for the future
To support the hospital, we developed a data analysis tool. The hospital can use the tool to analyse the new failure data. Our advice is to use the tool every three to six months, because per six months on average seventeen defects that cause loss occur. So, if the time frame is shorter than a quarter, too few new defects will have occurred to see new trends. A time frame of six months gives the opportunity to notice common causes, while still being in time to solve the problems at an early stage.
Advice based on the data from 2015 to 2018
Based on the data from 2015 to 2018 we have investigated which failure types caused the highest financial loss. These were bent tips of the Curved Bipolar Dissector and bent shaft extensions and scratched blades of the Hot ShearsTM. (Restricted) A possible cause is the lack of haptic feedback. Because of this lack, the surgeons might apply too much force, causing bent tips or bent shaft extensions. (Restricted)
To prevent these common defects from happening, the hospital should investigate if the financial loss decreases when (Restricted). If this does not lower the defects, the hospital should talk with the supplier to find a cause of the high loss which the Hot-ShearsTM caused or to find a solution for the lack of haptic feedback.
Discussion
We will now show the limitations of this study and the assumptions that we made.
Firstly, the FMECA is based on the data from 2015 to 2018. It is possible that new failure types will occur in the future. These are not yet included in the FMECA. However, the hospital can do this later. Secondly, we solely investigated the data, literature and instruments’ flows. We have not
investigated the instruments at a more mechanical level, because that is outside of our discipline. Therefore, we were not able to find all the functions of components and effects of defects. Additionally, more causes could be found when inspecting the instruments at a more mechanical level.
Thirdly, we did not have our study checked by the supplier, because we should first determine which defects happened frequently and look for causes in the hospital itself. So, the hospital should
In this study, we made two assumptions about the failure modes. Firstly, when a defect consisted of multiple failure modes, we assumed that the failure modes were equally responsible for the financial loss. In reality, this might not be the case. For instance, scratched distal straps almost always occur together with other, bigger issues concerning the tips. So, probably the scratch marks are just a side issue.
The second assumption is that, when a defect consisted of multiple failure modes, the failure modes are independent of each other. In reality, this might not be the case. For example, damaged bipolar jaw part straps almost always occur together with a defect conductor wire. So, there might be a correlation between these defects.
Recommendations
To improve the reliability of the data analysis tool and to find more failure causes, further research can be done. We would like to suggest a few topics to investigate.
Firstly, the two assumptions that we made concerning defects with multiple failure modes can be checked. This can for instance be done by further investigating the hospital’s reports to see how big the effect of a specific failure mode is. The correlation of the defects can probably be investigated by talking to the supplier Intuitive Surgical, because more technical information might be needed for that. Secondly, we only observed urological surgeries. This department is the main user of the Da Vinci® system in Gronau. However, also the other specialties (e.g., gynaecology) could be investigated into to find out if there are more, less or different defects and what could be learned from that.
Thirdly, the hospital could look at the data analysis tool to investigate which failure types are not categorised consistently and what could cause this inconsistency.
Additionally, from the literature, energy leakage (for example because of damaged insulation) seemed to be a common problem. However, damaged insulation rarely appeared in the database of the hospital and it was never the reason for returning the instrument to the supplier. Therefore, we have not investigated it further. However, when it turns out to be a problem later, the literature can be used to find possible causes and solutions.
Furthermore, in some cases the hospital’s failure report contains the number of remaining lives. However, this does not always correspond to the number of remaining lives in the separate column of the database which always shows the number of remaining lives. It might be interesting to investigate what causes this discrepancy and if it is a problem.
Akbulut, Z., Canda, A. E., Atmaca, A. F., Asil, E., Isgoren, E., & Balbay, M. D. (2011). What if the hand piece spring disassembles during robotic radical prostatectomy? Journal of the Society of
Laparoendoscopic Surgeons, 15(2), 275–278.
https://doi.org/10.4293/108680811X13071180406916
Ballouhey, Q., Clermidi, P., Cros, J., Grosos, C., Rosa-Arsène, C., Bahans, C., … Fourcade, L. (2018). Comparison of 8 and 5 mm robotic instruments in small cavities. Surgical Endoscopy, 32(2), 1027– 1034. https://doi.org/10.1007/s00464-017-5781-9
Bodner, J., Augustin, F., Wykypiel, H., Fish, J., Muehlmann, G., Wetscher, G., & Schmid, T. (2005). The da Vinci robotic system for general surgical applications: a critical interim appraisal. Swiss Medical Weekly, 135(45–46), 674–678. https://doi.org/2005/45/smw-11022
Boggi, U., Moretto, C., Vistoli, F., D’Imporzano, S., & Mosca, F. (2009). Robotic suture of a large caval injury caused by endo-GIA stapler malfunction during laparoscopic wedge resection of liver segments VII and VIII en-bloc with the right hepatic vein. Minimally Invasive Therapy & Allied Technologies, 18(5), 306–310. https://doi.org/10.1080/13645700903201001
Buchs, N. C., Pugin, F., Volonté, F., & Morel, P. (2014). Reliability of robotic system during general surgical procedures in a university hospital. American Journal of Surgery, 207(1), 84–88. https://doi.org/10.1016/j.amjsurg.2013.06.007
Corcione, F., Esposito, C., Cuccurullo, D., Settembre, A., Miranda, N., Amato, F., … Caiazzo, P. (2005). Advantages and limits of robot-assisted laparoscopic surgery: preliminary experience. Surgical Endoscopy, 19(1), 117–119. https://doi.org/10.1007/s00464-004-9004-9
Flushing Hospital. (2015). The da Vinci surgical system [Image]. Retrieved April 16, 2019, from https://qns.com/story/2015/03/27/flushing-hospital-marks-milestone-use-of-surgical-robot/ Friedman, D. C. W., Lendvay, T. S., & Hannaford, B. (2013). Instrument Failures for the da Vinci Surgical
System: a Food and Drug Administration MAUDE Database Study. Surgical Endoscopy, 27(5), 1503–1508. https://doi.org/10.1007/s00464-012-2659-8
Fuller, A., Vilos, G. A., & Pautler, S. E. (2012). Electrosurgical injuries during robot assisted surgery: insights from the FDA MAUDE database. In Proceedings of SPIE (Vol. 8207). San Francisco, CA. https://doi.org/10.1117/12.909456
Gupta, P., Schomburg, J., Krishna, S., Adejoro, O., Wang, Q., Marsh, B., … Konety, B. R. (2017). Development of a Classification Scheme for Examining Adverse Events Associated with Medical Devices, Specifically the DaVinci Surgical System as Reported in the FDA MAUDE Database.
Journal of Endourology, 31(1), 27–31. https://doi.org/10.1089/end.2016.0396
Intuitive Surgical. (2019). Da Vinci Surgical Systems. Retrieved March 21, 2019, from https://www.intuitive.com/en-us/products-and-services/da-vinci/systems
Intuitive Surgical Inc. (2010). Masters(below) and EndoWrist(TM) - Instruments (above). Retrieved April 16, 2019, from https://www.maxonmotorusa.com/maxon/view/application/Surgical-Robots-for-Minimally-Invasive-Procedures
Intuitive Surgical Inc. (2015). Hot Shears (Monopolar Curved Scissors). Retrieved from https://www.intuitivesurgical.com/images/on-site-banners/1008471rB-EU_Xi_IA_Catalog.pdf Intuitive Surgical Inc. (2018a). Da Vinci Xi User Manual Manual.
Intuitive Surgical Inc. (2018b). Instruments and Accessories User Manual for da Vinci Xi and da Vinci X Systems. https://doi.org/10.1177/000313130405400328
Joseph, R. A., Goh, A. C., Cuevas, S. P., Donovan, M. A., Kauffman, M. G., Salas, N. A., … Dunkin, B. J. (2010). “Chopstick” surgery: a novel technique improves surgeon performance and eliminates arm collision in robotic single-incision laparoscopic surgery. Surgical Endoscopy, 24(6), 1331– 1335. https://doi.org/10.1007/s00464-009-0769-8
Journal, 52(2), 365–368. https://doi.org/10.3349/ymj.2011.52.2.365
Mendez-Probst, C. E., Vilos, G., Fuller, A., Fernandez, A., Borg, P., Galloway, D., & Pautler, S. E. (2011). Stray Electrical Currents in Laparoscopic Instruments Used in da Vinci® Robot-Assisted Surgery: An In Vitro Study. Journal of Endourology, 25(9), 1513–1517. https://doi.org/10.1089/end.2010.0706
Nayyar, R., & Gupta, N. P. (2010). Critical appraisal of technical problems with robotic urological surgery. BJU International, 105(12), 1710–1713. https://doi.org/10.1111/j.1464-410X.2009.09039.x
Rajih, E., Tholomier, C., Cormier, B., Samouëlian, V., Warkus, T., Liberman, M., … Zorn, K. C. (2017). Error reporting from the da Vinci surgical system in robotic surgery: A Canadian multispecialty experience at a single academic centre. Canadian Urological Association Journal, 11(5), E197-202. https://doi.org/10.5489/cuaj.4116
Tinga, T. (2012). Mechanism Based Failure Analysis. Den Helder: Nederlandse Defensie Academie. Topan, E. (2019). 191852630 Lec 3 SystemReliability Importance Measure FTA_FMECA. Enschede:
University of Twente.
Tse, K. Y., Ngan, H. Y. S., & Lim, P. C. (2017). Robot-assisted gynaecological cancer surgery-complications and prevention. Best Practice & Research. Clinical Obstetrics & Gynaecology, 45, 94–106. https://doi.org/10.1016/j.bpobgyn.2017.04.005
This is the user manual for the Excel tool ‘Data analysis tool for failing Da Vinci instruments’. It consists of a manual for using the tool and of a manual for periodic maintenance. The name of the file should not be changed and macros should be enabled.
The tool consists of several pages. First, it will be explained what the pages show. After that, a flow chart will be given for using the pages. The advice is to use the tool every three to six months.
Current day: This is used to determine which defects occurred most recently. You can change it to a date in the past. To reset it to the current date, press the ‘Today’ button.
Categorisation completeness: The percentage of the defects which the tool could categorise by using the results of the supplier’s investigation.
Categorisation consistency: The percentage of the defects for which the results of the supplier’s
investigation are consistent with the results of similar defects in the past.
Cause suggestion reliability: The percentage of the failure causes
Buttons: Use these buttons to go to other pages.
More details: This brings you to the page with the FMECA, which shows the different failure types per instrument as well as their
There are two dashboards: one about the last six months and one about the defects from 2015 until today. Both dashboards look the same.
Total historical financial loss: This is the total loss that is caused by failing instruments, taking into account the remaining lives.
Instruments causing highest financial loss: These are the instruments which caused the highest loss in the past. These losses are also shown.
Pareto graph: This chart shows the loss per component and the cumulative percentage. Often 20% of the components cause 80% of the failures. Therefore, you should focus on the small
Component, failure type, instrument and average loss: The failure types and corresponding components that caused the highest average loss are shown. Additionally, the instruments to which these failure types happened are shown, including the percentage that these instruments contributed to the loss caused by this failure type.
Financial loss over the years: This chart shows which instruments caused loss in the past and how these losses developed.
In this appendix, we are showing which components and failure types we marked as ‘Unknown’.
• ‘No failure found’
• ‘Failure could not be reproduced’ • ‘Could not be reproduced’
• ‘Does not correspond to reported failure’ • ‘Expected condition’
• ‘External event not confirmed’ • ‘No problem reported’
In this appendix, we are describing the systematic literature review protocol that we used to answer the question what can cause the instrument defects according to the literature.
The question that we wanted to answer using systematic literature research was: ‘What can cause the defects of the Da Vinci® instruments according to the literature?’ This translates in the following key concepts:
• Cause • Defect • Da Vinci® • Instrument
To make sure finding the most relevant sources, we defined inclusion and exclusion criteria.
• English, Dutch and German sources
These are the languages which we are able to understand.
• Sources which are not about Da Vinci®
surgical systems
The focus of this study is on the Da Vinci® X and Xi systems. Nevertheless, we did not exclude sources about their predecessors (e.g., Da Vinci® S and Si systems), because their failure causes can be similar. However, we excluded other robotic systems, because they would differ too much.
• Sources that do not mention technical defects in the summary
If no information regarding technical defects was mentioned in the summary, too little attention will be paid to that in the rest of the article.
• Paid sources
We only included sources that we could get for free, either because they are open source or because we can access them via the University of Twente. It turned out that we could get almost any source for free.
• Sources originated before 1995
In 1995 Intuitive Surgical was founded and there had not been any major robotic surgical systems before that time.
44 To find relevant sources, we needed to define search terms. We will now explain which terms we used.
In Table 6, a search matrix is shown in which the strategy and constructs that we used are shown. The strategy is used is PICo, for that is useful for qualitative, exploratory studies. Based on the search matrix, we defined the following search strings:
• (defect* OR fail* OR damaged OR malfunction*) AND cause* AND “Da Vinci$” AND robot* AND instrument*
• (defect* OR fail* OR damaged OR malfunction* OR error) AND (cause* OR effect* OR contribute* OR “due to” OR “because of”) AND “Da Vinci$” AND robot AND instrument*
• (defect* OR fail* OR damaged OR malfunction* OR error) AND (cause* OR effect* OR contribute* OR “due to” OR “because of”) AND “Da Vinci$” AND ("Bipolar Dissector" OR "Hot Shears" OR "Curved Scissors" OR "Bipolar Forceps" OR "Bipolar Grasper")
[image:44.842.58.797.312.465.2]The reason that we did not include the related terms “broken” and “break*” is that these words have many different meanings. Further, the reason that we used “damaged” instead of “damage*”, is that “damage” is often used to describe an illness-related issue rather than a mechanical failure.
Table 6: Search matrix
PICo Constructs Related terms Broader terms Narrower terms
Population Defect* Break*
Fail* Broken Damage* Malfunction*
Error Weak*
Interest Cause* Effect*
45
Context “Da Vinci$” AND
“instrument*”
“Intuitive Surgical” “Surgery robot*” “Robot-assisted”
“Robot-assisted surgery” “Robot* instrument” “Minimally invasive surgery” MIS
“Curved Bipolar Dissector” “Hot Shears”
“Monopolar Curved Scissors”
“Bipolar Forceps” “Bipolar Grasper”
[image:45.842.75.778.249.512.2]In Table 7, the results of our search for literature are shown. After reading the entire articles, we removed four articles. In Table 8 the motivation for these removals is shown.
Table 7: Search report
Search string Scope Date of search Date range Number of entries
Search protocol for PubMed (defect* OR fail* OR
damaged OR malfunction*) AND cause* AND “Da Vinci$” AND robot* AND
instrument*
Text word 16 April 2019 1995-present 8
(defect* OR fail* OR damaged OR malfunction* OR error) AND (cause* OR effect* OR contribute* OR “due to” OR “because of”) AND “Da Vinci$” AND robot AND instrument*
Text word 16 April 2019 1995-present 24
(defect* OR fail* OR damaged OR malfunction* OR error) AND (cause* OR
46 effect* OR contribute* OR
“due to” OR “because of”) AND “Da Vinci$” AND ("Bipolar Dissector" OR "Hot Shears" OR "Curved Scissors" OR "Bipolar Forceps" OR "Bipolar Grasper")
Search protocol for Scopus (defect* OR fail* OR damaged OR malfunction*) AND cause* AND “Da Vinci$” AND robot* AND
instrument*
Article title, abstract, key words
16 April 2019 1995-present 9
(defect* OR fail* OR damaged OR malfunction* OR error) AND (cause* OR effect* OR contribute* OR “due to” OR “because of”) AND “Da Vinci$” AND robot AND instrument*
Article title, abstract, key words
16 April 2019 1995-present 48
(defect* OR fail* OR damaged OR malfunction* OR error) AND (cause* OR effect* OR contribute* OR “due to” OR “because of”) AND “Da Vinci$” AND ("Bipolar Dissector" OR "Hot Shears" OR "Curved Scissors" OR "Bipolar Forceps" OR "Bipolar Grasper")
Article title, abstract, key words
47 Search protocol for Web of Science
(defect* OR fail* OR damaged OR malfunction*) AND cause* AND “Da Vinci$” AND robot* AND
instrument*
Topic 16 April 2019 1995-2019 7
(defect* OR fail* OR damaged OR malfunction* OR error) AND (cause* OR effect* OR contribute* OR “due to” OR “because of”) AND “Da Vinci$” AND robot AND instrument*
Topic 16 April 2019 1995-2019 28
(defect* OR fail* OR damaged OR malfunction* OR error) AND (cause* OR effect* OR contribute* OR “due to” OR “because of”) AND “Da Vinci$” AND ("Bipolar Dissector" OR "Hot Shears" OR "Curved Scissors" OR "Bipolar Forceps" OR "Bipolar Grasper")
Topic 27 May 2019 1995-2019 1
Total 126
Removing duplicates -59
Removing sources that do not mention defects in the summary -49
Removing paid sources -2
Removed after complete reading -4
48 Table 8: Removed articles after complete reading
Journal Authors (Year) Reason for exclusion
Swiss Medical Weekly (Bodner et al., 2005) The article mentions some failures, but it focusses on investigating the feasibility and safety of robot-assisted surgery rather than on investigating failure causes.
Journal of Endourology
(Gupta et al., 2017) The article does not mention failure causes, for its purpose is to show a system to classify the severity of the effects of defects.
Best practice & research. Clinical obstetrics & gynaecology
(Tse, Ngan, & Lim, 2017)
The article investigates health-related complications instead of technical failure.
Spine (Yang et al., 2011) The main purpose of the article is describing a test of robot-assisted surgery. It does not focus on defect causes.
Once we found the right sources, we read them, and categorised and synthesised the information in a concept matrix (Table 9).
Table 9: Concept matrix
Journal Authors (Year) Object Key findings regarding causes of defects
Journal of the Society of
Laparoendoscopic Surgeons
(Akbulut et al., 2011) Da Vinci® S: Hand piece spring
A spring in the hand piece of the surgeon console disassembled, but since its only function was to push the fingers apart, the surgeon could continue the surgery by moving his fingers apart himself. Another failure of which the cause was not known was solved by restarting the system.
Surgical Endoscopy (Ballouhey et al., 2018)
Da Vinci® Si: 5 mm and 8 mm
instruments
8 mm instruments cause less instrument collisions and less parietal damage. So, also in pediatric surgery 8 mm instruments are preferred over 5 mm instruments. Minimally Invasive
Therapy & Allied Technologies
(Boggi, Moretto, Vistoli, D’Imporzano, & Mosca, 2009)
Da Vinci®: Endo-GIA stapler
[image:48.842.75.737.342.516.2]49 American journal of
surgery
(Buchs et al., 2014) Da Vinci® S and Si: Harmonic scalpel, robotic arms, optical system
• The instrument that failed multiple times was the harmonic scalpel. This failure was caused by the tip of the instrument and the instrument needed to be replaced.
• The arms of the robot malfunctioned multiple times, because the arms were not positioned well.
• The optical system failed once due to a light source failure. • When the system stopped working, it could be restarted. Surgical Endoscopy (Corcione et al.,
2005)
Da Vinci® The arms of the robot can collide because of their large movements and their arm elevations when the patient is in an extreme position. Additionally, the article states that the large diameter (8 mm) of the instruments and the fact that the robot has only three arms can cause problems. However, it does not proof this. Surgical Endoscopy (Friedman et al.,
2013)
Da Vinci®: Instruments
• This study categorises failures in five categories, which are, in order of frequency of reporting: wrist or tool-tip, cautery, shaft, cable and control housing. The failures types of the wrists, tool-tips and cables were primarily broken parts. The cautery failures included arcing and damaged conductor wires. The shafts broke or were scratched by scraping against the cannula or by instrument collision or misusage. The housing failures varied a lot.
• Moreover, the instruments that break down most frequently are the Monopolar Curved Scissors.
• Additionally, the disposable tool tip covers are fragile and require a great force to be installed.
Proceedings of SPIE (Fuller et al., 2012) Da Vinci®: Electrosurgical instruments
Many of the defects of electrosurgical instruments were caused by installing the tool tip cover incorrectly to the monopolar instruments. Additionally, insulation defects occurred, which can be caused by stray currents that burn away the insulation. Other causes can be using 5 mm instruments through 10 mm cannulas, re-using disposable instruments and cleaning the instruments insufficiently. Surgical Endoscopy (Joseph et al., 2010) Da Vinci® S: Robotic
arms
50 Yonsei Medical
Journal
(Lorenzo et al., 2011) Da Vinci® S: Hot ShearsTM
The tip cover of the Hot ShearsTM showed two holes, which caused a current leakage.
Journal of Endourology
(Mendez-Probst et al., 2011)
Da Vinci®: Instruments
In this study, all instruments, which were at the end of their life cycle, showed energy leakage. The causes are unknown, but causes can be using 5 mm instruments through 10 mm cannulas and re-using disposable instruments. BJU International (Nayyar & Gupta,
2010)
Da Vinci® S According to this study, breakage or disconnection of wires can be caused by user-related mistakes (e.g., moving the instruments beyond their range).
Canadian Urological Association Journal