University of Warwick institutional repository: http://go.warwick.ac.uk/wrap
A Thesis Submitted for the Degree of PhD at the University of Warwick
http://go.warwick.ac.uk/wrap/66919
This thesis is made available online and is protected by original copyright. Please scroll down to view the document itself.
Regulation of mitochondrial
dynamics in adipose tissue
by
Ciara McCarthy
A thesis submitted in fulfilment of the requirements
for the degree of
Doctor of Philosophy
Molecular Organisation and Assembly of Cells
Doctoral Training Centre, University of Warwick.
Table of contents
List of figures viii-‐xii Acknowledgements xiii Declara:on xiv Summary xv Abbrevia:ons xvi-‐xvii
Chapter 1: Introduc6on………..1-‐28
1.1 Obesity, Diabetes and T2DM
1.1.1 Defini:on of Obesity, Diabetes and T2DM………...2 1.1.2 Prevalence and financial impact of obesity and adiposity………..3-‐4 1.1.3 Adipose :ssue; Central vs peripheral obesity………...4 1.1.4 Adipose :ssue remodelling in adiposity………...4-‐7 1.1.5 Metabolic flexibility is compromised in obesity……… ..7-‐8 1.2 Energy homeostasis in adipose :ssue
1.2.1 Regula:on of energy metabolism in adipose :ssue………...….…...8-‐9 1.2.2 Role of adipokines in energy homeostasis……….10-‐12 1.2.2.1 TNFα
1.2.2.2 Lep:n 1.2.2.3 Adiponec:n
1.2.3 Energy homeostasis dysregula:on in obesity and T2DM…………...………..12 1.3 Mitochondrial health and func:on
1.3.1 Mitochondrial biogenesis………...13-‐14 1.3.2 Mitochondrial dysfunc:on………...14-‐16 1.3.3 Causes of mitochondrial dysfunc:on………...16 1.3.4 Mitochondrial dysfunc:on in adipose :ssue………...…...16-‐17 1.4 Mitochondrial dynamics
1.5 Mitochondrial bioenerge:cs
1.5.1 Quan:ta:ve measurement of OXPHOS can be performed in situ………...23-‐26
1.6 Summary………..………...27 1.7 Aims and Objec:ves………....………... 28 Chapter 2: The role of adiposity in mitochondrial dynamics…...………….29-‐56 2.1 Introduc:on………..………..30-‐32 2.2 Research design and methods………..……….32-‐42 2.2.1 Selec:on and descrip:on of par:cipants………...32 2.2.2 Analyses of blood samples………...….32-‐33 2.2.3 Isola:on of mRNA and qPCR………..………..33-‐36 2.2.4 Protein determina:on and western blot analysis………....37 2.2.5 Mitochondrial DNA content and differen:a:on………..………..38-‐40 2.2.6 Sta:s:cal analyses………....40
2.3. Results………...40-‐56 2.3.Effect of adiposity on clinical parameters of the human abdominal
subcutaneous adipose :ssue cohort……….…………...40-‐41 2.3.2 Effect of adiposity on markers of mitochondrial fission………...……42-‐43 2.3.3 Effect of adiposity on markers of mitochondrial fusion………..…………44-‐47 2.3.4 Balance of markers of mitochondrial dynamics in adiposity……….………..48-‐49 2.3.5 Mitochondrial DNA content in abdominal subcutaneous adipose
:ssue of lean, overweight and obese………...……...50-‐51 2.3.6. Correla:on analyses between mitochondrial DNA content
and markers of mitochondrial dynamics genes………..………...52-‐53 2.4 Discussion………..………...54-‐56 Chapter 3: Bariatric surgery : effect on markers of mitochondrial fission and fusion
3.2.4 Analyses of blood samples and adipose :ssue………...63-‐64 3.2.5 Isola:on of mRNA and qRT-‐PCR expression………....64 3.2.6 Protein isola:on and western blot analysis………....64 3.2.7 Mitochondrial DNA content before and a_er bariatric surgery determina:on… 64 3.2.8 Sta:s:cal analyses……….64-‐65 3.3 Results………...65-‐88 3.3.1 Clinical parameters following bariatric surgery………..65-‐67
3.3.2. Influence of the different surgical procedures on clinical parameters
following bariatric surgery………....68 3.3.3 mRNA expression of the mitochondrial fission markers, Fis1 and
Drp1 before and a_er bariatric surgery………...………...……..69-‐71 3.3.4 mRNA expression of the mitochondrial fusion markers, Mfn2,Opa1
and FOXC2 before and a_er bariatric surgery………...………...72-‐77 3.3.5. Effect of bariatric surgery on mitochondrial DNA content
and expression of markers of mitochondrial dynamics genes……….78-‐80 3.3.7. Correla:on analyses between mitochondrial DNA content and markers of mitochondrial dynamics genes………....…...…………...81-‐83 3.3.8.Glucose correlates with markers of mitochondrial dynamics……...84-‐86 3.3.9. Macrophage markers and bariatric surgery……….………87-‐88 3.4 Discussion………..………..89-‐94 Chapter 4: The role of p38 in mitochondrial dynamics.………...………..95-‐150 4.1 Introduc:on………..………..96-‐99 4.2 Methods……….……….100-‐115 4.2.1. Cell culture of 3T3-‐L1 preadipocytes...………..……....…100 4.2.1.1 Preadipocyte culture for markers of mitochondrial dynamics
expression analyses...100 4.2.1.2 Op:misa:on of seeding density and culture condi:ons
for mitochondrial bioenerge:cs assay..………...…100-‐103 4.2.1.3. Op:misa:on of treatment condi:ons of 3T3-‐L1 preadipocytes
4.2.2. Cytotoxicity of SB203580
4.2.2.1 Principles of the MTT assay……….107-‐108 4.2.2.2 Assay protocol………...108-‐109 4.2.2.3 Calcula:on of cytotoxicity……….109 4.2.3. Gene expression analyses of differen:a:on………….…………..………109 4.2.4. Manipula:on of p38 expression and mitochondrial bioenerge:cs…..…….109-‐110 4.2.5. Mitochondrial DNA content determina:on……….………110 4.2.6. Transfec:on of 3T3-‐L1……….………...………111 4.2.7.Mitochondrial morphology: Effects of p38 inhibi:on by SB203580……..….111-‐112 4.2.7.1 Image analysis of mitochondrial morphology
in 3T3-‐L1 preadipocytes by :me-‐lapse confocal microscopy……...112-‐115
4.3 Results………..116-‐144 4.3.1 p38 expression and differen:a:on
4.3.1.1 Triglyceride accumulates through adipocyte differen:a:on….116-‐117 4.3.1.2 Effect of p38 inhibi:on during 3T3-‐L1 differen:a:on………..….118-‐119 4.3.1.3 Markers of mitochondrial dynamics throughout
adipocyte differen:a:on………...…..120-‐121 4.3.2 Effect of p38 inhibi:on on markers of mitochondrial dynamics and abundance
4.3.2.1 Timecourse for p38 inhibi:on………..……….122-‐123 4.3.2.2 Cytotoxicity assessment of the p38 inhibitor, SB203580……….124-‐125 4.3.2.3 Effect of p38 inhibi:on on markers of mitochondrial fission....126-‐127 4.3.2.4 Effect of p38 inhibi:on on markers of mitochondrial fusion….128-‐129 4.3.2.5 Effect of p38 inhibi:on on mitochondrial DNA content.…...…..130-‐131 4.3.3 Effect of p38 inhibi:on on mitochondrial bioenerge:cs
4.3.3.1 Op:misa:on of seahorse mitochondrial bioenerge:cs assay; cell density, culturing condi:ons, concentra:on of stress test
reagents...132-‐133 4.3.3.2 p38 inhibi:on and mitochondrial bioenerge:cs………..134-‐135 4.3.3.3 Op:misa:on of MKK6(Glu) transfec:on in 3T3-‐L1
preadipocytes...136-‐137 4.3.3.4 Effect of MKK6 (Glu) on markers of mitochondrial fission
4.3.3.6 Effect of p38 inhibi:on on mitochondrial morphology………….142-‐144 4.4 Discussion………...145-‐150
Chapter 5: Modelling of p38 receptor and new poten6al drug targets……….…..154-‐198 5.1 Introduc:on………155-‐178 5.1.1 MAPK family………...155 5.1.2 Role of p38 MAPK pathway………..155-‐156 5.1.3 p38 isoforms and abundance………..156-‐157 5.1.4 Structural features and ac:va:on of MAPKs………...158-‐159 5.1.5 Regula:on of p38 ac:va:on………160-‐162 5.1.5.1 Dissec:ng the role of key amino acids in p38………....160-‐161 cataly:c ac:vity and substrate binding
5.1.5.2 Binding mode within p38α MAPK………...161-‐162 5.1.6 DFG in vs. out inhibitors
5.1.6.1 Design of p38 inhibitors: DFG-‐in versus DFG-‐out inhibitors…..163-‐164 5.1.6.2 Solu:on state NMR...164-‐166 5.1.6.3 Substrate binding to the p38α receptor……….…………..167-‐168 5.1.6.4 BIRB-‐796: DFG-‐out p38 inhibitor………..168-‐170 5.2. Drug design
5.2.1 Lipinski’s rule of 5 ………...……….170-‐171 5.2.2 Toxicology and bioavailability considera:ons in drug design………...172 5.2.3 Selec:on of compounds with puta:ve p38 kinase inhibitory ac:vity
5.2.3.1 Descriptor selec:on………173-‐174 5.2.3.2 Structural similarity……….174-‐175 5.3 Compound clustering
ac:ves compound database (Wards clustering)
5.4.3 Selec:on of compounds from the AZ database:………180-‐181 Co-‐clustering of p38 inhibitor ac:vity and chemical similarity
5.4.4. Selec:on of puta:ve p38 isoform selec:ve inhibitors………181 5.4.5. Docking interac:ons of p38 and puta:ve p38 inhibitors...181 5.4.6 MTT Cytotoxicity assay………182-‐183 5.4.7 Serial dilu:on of AZ_p38 compounds………...183 5.4.8. Mitochondrial bioenerge:cs assay………..183-‐184 5.4.9. Mitochondrial copy number determina:on (mtDNA/nDNA ra:o)……....184-‐185 5.5. Results……… 186-‐195
5.5.1 Hierarchical clustering analyses ………186-‐187 of known p38 ac:ve’s within the AZ compound collec:on
5.5.2 Clustering based on p38 kinase ac:vity……….188-‐189 from known database including p38 kinase inhibitor ac:ves
5.5.3 Isoform selec:vity of AZ p38 inhibitors……… 190-‐191 5.5.4 Effect of AZ-‐0002 on mitochondrial copy number….….……….192-‐193 5.5.5. Spare respiratory capacity of 3T3-‐L1 preadipocytes is reduced
following acute treatment with puta:ve inhibitor of p38β, AZ-‐0002…………...194-‐195
List of figures and tables
Chapter 1. Introduction
Figure 1.1. Central vs peripheral fat depots... 2
Figure 1.2. Hypertrophy vs Hyperplasia...5
Figure 1.3. Healthy versus unhealthy adipose :ssue expansion...6
Figure 1.4. Energy homeostasis...10
Figure 1.5. Origins of mitochondrial dysfunc:on...15
Figure 1.6. Mitochondrial dynamics...19
Figure 1.7. Quality control of mitochondria...24
Figure 1.8. Oxida:ve phosphoryla:on cycle...26
Chapter 2. Adiposity and mitochondrial dynamics Figure 2.1. RNA extrac:on: RNeasy lipid protocol...34
Figure 2.2. DNase treatment of RNA to remove DNA contamina:on...35
Figure 2.3. DNA extrac:on:DNeasy blood and :ssue protocol...39
Table 1. Clinical parameters of the human AbSc AT cohort...42
Figure 2.4. Markers of mitochondrial fission increase with adiposity...44
Figure 2.5. Markers of mitochondrial fusion, Opa1 and Mfn2 increase with adiposity, whilst the transcrip:onal regulator FOXC2 ...46-‐48 decreases with adiposity Figure 2.6. Balance of markers of mitochondrial dynamics in adiposity...50
Figure 2.7. Mitochondrial DNA content did not alter...52
Chapter 3: Bariatric surgery: effects on markers of mitochondrial fusion and
fission expression
Figure 3.1. Types of bariatric surgery...64 Table 2. Clinical parameters improve following bariatric surgery...69 Figure 3.2. Markers of mitochondrial fission, Drp1 and Fis1...72 decreased significantly a_er bariatric surgery.
Figure 3.3. mRNA expression of the markers of mitochondrial...73 fission , Drp1 and Fis1 by surgical procedure
Figure 3.4. Individual pa:ent Drp1 and Fis1 mRNA expressions...74 pre and post bariatric surgery..
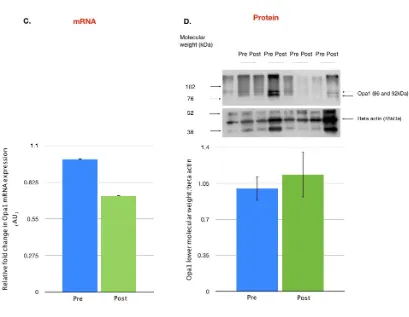
Figure 3.5. Markers of mitochondrial fusion, Mfn2, Opa1...76-‐77 decreased following bariatric surgery
Figure 3.6. mRNA expression of markers of mitochondrial ...78 fusion, Opa1 and Mfn2 by surgical procedure
Figure 3.7. Individual pa:ent Mfn2 and Opa1 mRNA expressions...79 pre and post bariatric surgery
Figure 3.8. Mitochondrial DNA content before and following...81 bariatric surgery
Chapter 4: The role of p38 in mitochondrial dynamics
Figure 4.1. Cell seeding of 3T3-‐L1 preadipocytes...102 Figure 4.2. Flow chart of mitochondrial bioenerge:cs assay protocol...105 Figure 4.3. Loading pakern for use of mitochondrial stress reagents...106 or drug treatments in mitochondrial bioenerge:cs assay
Figure 4.4. Mitochondrial stress bioenerge:cs profile...107 Figure 4.5. MTT assay...110 Figure 4.6. Proposed model for the genera:on of mitochondrial...116 morphological subtypes
Figure 4.7. Triglyceride accumulates with adipocyte differen:a:on...120 Figure 4.8. Effect of p38 inhibi:on through 3T3 differen:a:on...122 Figure 4.9. Marker of mitochondrial dynamics expression...124 through adipocyte differen:a:on
Figure 4.10. Timecourse of p38 inhibi:on...126 Figure 4.11. Cytotoxicity of the p38 inhibitor, SB203580...128 Figure 4.12. Fis1 protein expression decreases significantly...130 following p38 inhibi:on
Figure 4.13. Mfn2 protein expression decreases significantly...132 following p38 inhibi:on
Figure 4.14. Mitochondrial DNA content remained unchanged...134 following p38 inhibi:on
Figure 4.15. Op:misa:on of seahorse mitochondrial bioenerge:cs...136 assay; cell density, culturing condi:ons, concentra:on of stress test reagents.
Figure 4.19. Effect of p38 inhibi:on on mitochondrial size and abundance...144 mitochondrial subtypes in 3T3-‐L1 preadipocytes
Table 3. Effect of p38 inhibi:on on the composi:on of ...146 mitochondrial subtypes in 3T3-‐L1 preadipocytes
Figure 4.20. Effect of p38 inhibi:on on mitochondrial morphology subtypes...147
Chapter 5. Molecular modelling of p38 and selection of exemplars of putative
p38 isoform selective inhibitors from the AZ compound collection
Figure 5.1. Roles of the p38 MAPK pathway...155 Figure 5.2. Sequence homology of p38 receptor isoforms...157 Figure 5.3. Structural specificity, substrates and mechanism of ac:on...158 of the p38 receptor isoforms
Figure 5.4. Crystal structure of the human p38α MAPK...159 Figure 5.5. p38α inhibitor, SB203580 molecule alone (A)...162 and complexed within the p38α crystal structure (B).
Figure 5.6. Principles of NMR...164 Figure 5.7. Energy profile of nuclei in NMR...165 Figure 5.8. Conforma:onal difference in binding modes...166 between DFG-‐in vs DFG-‐out inhibitors
Figure 5.9. Binding modes of two different types of p38 MAPK inhibitors...168 Figure 5.10. Kine:c scheme for the conforma:onal exchange of the DFG mo:f...169 Figure 5.11. Hierarchical clustering analyses of known p38 inhibitors...187 within the AZ compound collec:on
Figure 5.10. Two dimensional clustering of AZ compounds...189 based on their chemical and kinase ac:vity assay profile.
Figure 5.13. Treatment of 3T3-‐L1 with the puta:ve p38 beta inhibitor,...193 AZ_0002, resulted in no significant change in mitochondrial copy number
Acknowledgments
Thank you to my supervisors Dr. Gyanendra Tripathi, Dr. Philip McTernan and Dr.
Graeme Robb for their invaluable support, knowledge and guidance over the years. I
would also like to thank Dr. Adaikala Antonysunil, Dr. Alison Harte, Dr. Mingzhan
Xue, Philip Voyias and Warunee Kumsaiyai for their technical support and Shaun
Sabico for his advice and guidance with the statistical analysis of human samples. I
would like to thank Dr. Graeme Robb at AstraZeneca for the kinase assay data (Table
5 ) and for advice and discussions on analysis and presentation of figures for this
chapter. I would also like to thank, Dr. Anatoly Shmygol for training and technical
assistance in confocal imaging of 3T3 preadipocytes. Finally, to Professor Dmitiris
Grammatopoulis,Dr. Hugo van den Berg of the University of Warwick and Dr.
Graeme Robb of AstraZeneca for their research suggestions, discussions and advice
throughout the PhD.
With regards to samples, I would like to thank Dr. Ioannis Kyrou at the University of
Warwick and our collaborators in the Czech Republic, whose cooperation supplied the
bariatric surgery adipose tissue samples and fasting glucose and insulin data for this
study. The MKK6 (Glu) plasmid for the genetic overexpression work was ordered
through Addgene and provided by Roger Davis. Samples for the adiposity study were
kindly provided through a collaboration with University Hospital Coventry and
War-wickshire. Lastly, many thanks to Dr. Milan Piya and Sean James who helped
Declaration
I declare that this thesis is a record of results obtained by myself and, is composed by
myself, unless otherwise stated in the text in the acknowledgments. None of the work
has previously been submitted for a higher degree. Sources have been specifically
Summary
This thesis advances the understanding of mitochondrial dynamics in adipocytes.
Chapter 1 outlines mitochondrial dynamics, health, function and quality control in the
context of obesity and T2DM. Chapters 2 and 3 are concerned with characterising
mitochondrial dynamics in human abdominal subcutaneous adipose tissue and how
the balance of this process may be augmented by adiposity and bariatric surgery. As
an extension of this, Chapter 4 explores the potential regulatory role of p38 within
adipogenesis in the 3T3-L1 cell line model together with the interplay between p38
and mitochondrial dynamics throughout differentiation. As part of this study, the
impact of modulating p38 by chemical means or via the introduction of an
overexpression vector was used to investigate the functional consequences of this
gene on mitochondrial bioenergetics. The subtle balance of mitochondrial fusion and
fusion markers is critical, not only for controlling the abundance and bioenergetic
health of mitochondria but also, for overall cellular health. Finally, Chapter 5 extends
analysis of the regulatory role of p38 on mitochondrial dynamics through
computational modelling of the p38β . From the entire AstraZeneca compound
collec-tion, a series of novel and putative p38β inhibitors were selected for further functional
assays to assess the effect of these compounds on mitochondrial bioenergetics in
Abbreviations A AbSc AbSc AT Ad AT ATP ANOVA β-actin BMI BPD C.E C/EBP C-NMR CRP CT CVD CytB Da dCt DEPA dH2O DMEM DMSO DN DNA DNase dNTPs DTT EBI ECL EDTA ER FCCP GB GLUT-4 GTP HEPES HMW H20 HOMA-IR Absorbance Abdominal subcutaneous
Abdominal subcutaneous adipose tis-sue
Adipocyte Adipose tissue
Adenosine triphosphate Analysis of Covariance Beta actin
Body mass Index
Biliopancreatic diversion Coupling efficiency
CCAAT-enhancer-binding protein Carbon-Nuclear magnetic resonance C-reactive protein
Cycle threshold
Cardiovascular disease Cytochrome B
Daltons
Delta threshold cycle Diethyl pyrocarbinate Distilled water
Dulbecco's Minimum Essential Me-dium Dimethlysulphoxide Dominant negative Deoxyribonucleic acid Deoxyribonuclease Deoxynucleotides triphosphates Dithiothreitol
European Bioinformatics Institute Enhanced chemiluminescence Ethylenediaminetetraacetic Acid Endoplasmic reticulum p-trifluromethoxyphenylhydrazone Gastric banding Glucose-transporter-4 Guanosine triphosphate 4-(2-hydroxyethyl)-1-piperazineethanesulphonic acid High molecular weight
Water
hr HRP IMM kDa L L LMW LPS MAPK Mfn1/2 mg min ml mm mM MMPs mRNA MS mtDNA mQH2O MW NaCl ng nm nM nDNA N.S NADH Ob OD O.E Om OMM Opa1 Ov PBS PBS-T PPAR-γ PVDF RIPA RNAi ROS hour Horseradish Peroxidase
Inner mitochondrial membrane Kilodaltons
Lean (results figures only) Litre
Lipopolysaccharide Low molecular weight Mitogen-activated Kinase Mitofusin 1/2 milligrams minute milliliter miliimetres millimolar Matrix metalloproteases messenger RNA Metabolic Syndrome Mitochondrial DNA
milliQ water (ultra filtered water) Molecular weight Sodium Chloride Nanometers nanograms nanomolar Nuclear DNA non significant
Nicotinamide adenine dinucleotide Obese
Optical density Overexpression Omental
Outer mitochondrial membrane Optic atrophy 1
Overweight
Phosphate buffered saline
Phosphate-buffered Saline containing 0.1% Tween 20
Peroxisome Proliferator Activated Re-ceptor gamma
Polyvinylidene-fluoride
RT-PCR qRT-PCR R2 S.D SDS SDS-PAGE S.E.M SG SPSS SRC TBS TCA TEMED T2DM TZD μg UV v/v w/v WAT WHO yrs Reverse transcriptase-polymerase chain reaction
Quantitative reverse transcriptase po-lymerase chain reaction
Correlation coefficient Standard Deviation Sodium dodecyl sulphate Sodium dodecyl
sulphate-polyacryamide gel electrophoresis Standard error of the mean
Sleeve gastronectomy
Statistical package for the social sci-ences
Spare respiratory capacity Tris-buffered Saline Trichloric acid
Tetramethylethelenediamine Type 2 Diabetes Mellitus Thiozoladinediones micrograms
ultraviolet
Ratio of Volume per Volume Weight per Volume
1.1 Obesity and T2DM.
1.1.1 Definition of Obesity and T2DM.
Obesity is a key contributory factor in the development of insulin resistance
(Fernandez-Sanchez, Madrigal-Santillan et al. 2011). The excess accumulation of fat
in both overweight (BMI ≥ 25 kg/m2) and obese (BMI ≥ 30 kg/m2) individuals results
in 2.8 million deaths per year (World Health Organization.). The co-existence of
insu-lin resistance and obesity are known as significant risk factors for the development of
Type 2 Diabetes Mellitus (T2DM) (Bastard, Maachi et al. 2006, Abdullah, Peeters et
[image:22.595.139.421.352.583.2]al. 2010).
Figure 1.1. Central vs peripheral fat depots. Central fat accumulation
(subcutane-ous or visceral adipose tissue) is referred to colloquially as an ‘apple’ shape (left)
whilst peripheral deposition of fat (thighs, hips, buttocks) is termed as a ‘pear’ body
1.1.2. Prevalence and financial impact of obesity.
T2DM accounts for 90% of all diagnosed cases of diabetes (Diabetes UK). T2DM
develops by one of two mechanisms, an inability of pancreatic beta cells to produce
sufficient insulin or the development of cellular insensitivity to insulin (i nsulin
resis-tance (IR)) (DeFronzo 2004). The consequence of IR is the inability to control blood
glucose (Nesher, Della Casa et al. 1987, Covey, Wideman et al. 2006, Bao, Jacobson
et al. 2008) and onset of hyperglycaemia (Mah and Bruno 2012). Typically, T2DM
develops and is diagnosed in Caucasians over 40 years of age (1994, Sharp, Grunwald
et al. 2003, Gujral, Pradeepa et al. 2013). However, in south Asians, T2DM can occur
as early as 25 (Diabetes UK). South Asians exhibit a greater tendency than Caucasian
cases towards central lipid storage in the abdominal and visceral adipose tissue depots
(Morris, Velkoska et al. 2005, Nystad, Melhus et al. 2010, Cai 2013, Ali, Cerjak et al.
2014). Meta-analysis of the risk factors for the development of diabetes, indicate that
80-85% can be explained by obesity (Abdullah, Peeters et al. 2010). Between 1993
and 2011, obesity increased from 13 to 24% in men and 16 to 26% of women (NHS).
Together with the trend towards increasing adiposity, cases of diabetes are set to
dou-ble, in percentage terms, from 5% of the UK population in 2011, to 5 million people
(~12% of today’s population) (Statistics from World Health Organisation, WHO). In
conjunction with the requirement for pharmacological control of diabetes and
treat-ment of obesity, these conditions are often associated with secondary complications
including vascular diseases such as coronary artery disease, peripheral vascular
dis-ease, renal diseases and ophthalmological disdis-ease, which could lead to blindness and
peripheral nerve damage causing neuropathy (Sharp, Grunwald et al. 2003). In 2035,
reach £39.8 billion (Farzadfar, Finucane et al. 2011). Given the public health burden
of diabetes and obesity globally, understanding at a molecular level, the regulation of
insulin sensitivity and diabetes, is of vital significance.
1.1.3. Adipose tissue; central vs peripheral obesity.
Adipose tissue is the primary storage depot for excess nutritional intake. During
con-ditions of nutrient excess, adipocytes store excess dietary lipids as triglycerides
(Ra-jala and Scherer 2003). Excess dietary intake can be stored centrally (subcutaneous or
visceral AT) or in peripheral regions (hips, thighs, buttocks) (Rosen and Spiegelman
2006) ( Figure 1.1). Deposition of excess triglycerides centrally is a major risk factor
for the onset of metabolic conditions including but not limited to, cardiovascular
dis-ease and T2DM (Jung and Choi 2014).
1.1.4. Adipose tissue remodelling in obesity.
Adipocytes are capable of cellular remodelling. The inherent flexibility of adipocytes
enables them to dynamically increase their number and size in response to conditions
of nutrient excess (Lemoine, Ledoux et al. 2012). Adipose tissue remodelling can
oc-cur in one of two ways; through increased adipose tissue number (hyperplasia) or
vol-ume (hypertrophy) (Figure 1.2). The ability of adipocytes to store excess dietary
in-take as triglycerides is finite and this capacity differs between individuals (Figure
1.3.) (Scherer 2006, Sun, Kusminski et al. 2011) (Figure 1.3). Once this expansion
capacity has been reached, triglycerides must seek new sites of fat deposition (Jung
Figure 1.2. Hypertrophy vs Hyperplasia.
Adipose tissue remodelling can occur in one of two ways, through increased
adipo-cyte number (hyperplasia) or volume (hypertrophy). The ability of adipocytes to store
excess dietary intake as triglycerides is finite and this capacity differs between
indi-viduals (expansion limit). Hyperplasia is accompanied by increased adiponectin
se-cretion and reduction in inflammatory adipokines. Conversely, hypertrophy decreases
adiponectin whilst increasing inflammatory adipokines. In obesity, hypertrophy
Figure 1.3. Healthy and unhealthy adipose tissue expansion.
(A) The conversion of preadipocytes to mature adipocytes is accompanied with
acti-vation of angiogenesis, thereby maintaining sufficient oxygen supply. Continued
at-tempts to store excess nutrient supply as triglycerides above the expansion limit of
adipocytes results in the onset of hypoxia and inflammation . Hypoxia occurs in
re-gions of adipose tissue with insufficient oxygen supply. (B) In contrast, unhealthy
adipose tissue expansion is accompanied by significant enlargement of adipocytes
under conditions of limited angiogenesis and corresponding development of hypoxia.
Together with the induction of hypoxia inducing factor 1 (HIF-1 alpha), fibrosis is
initiated. Furthermore, inflammation increases as a result of the recruitment of M1
macrophages into adipose tissue. M1 macrophages are a pro-inflammatory phenotype.
Conversely, M2 macrophages are anti-inflammatory and have been proposed to be
involved in tissue repair. Overall the contribution of macrophages in this adipose
tis-sue, is towards a pro-inflammatory bias, which is strongly associated with insulin
These excess lipids remain in the circulation and are deposited in secondary organs
such as the liver and heart resulting in lipotoxicity and cardiac damage (Vigouroux,
Caron-Debarle et al. 2011). During obesity and T2DM, these circulating lipids
acti-vate the innate immune system and maintain a state of chronic low grade or
meta-inflammation within adipose tissue (Creely, McTernan et al. 2007). Taken together,
these conditions have negative implications for cellular metabolism (Bastard, Maachi
et al. 2006, Hotamisligil 2006, Hotamisligil and Erbay 2008). A reduction in insulin
sensitivity and metabolic function are two cornerstones of metabolic syndrome
(Vir-tue and Vidal-Puig 2010). As a condition, Metabolic Syndrome (MetS) is defined as
the co-existence of conditions including obesity, insulin resistance and dyslipidemia
within patients (Abella, Scotece et al. 2014). Individuals exhibiting Metabolic
Syn-drome display sustained insulin resistance during fasting and post-prandially (Harte,
Varma et al. 2012, Piya, Harte et al. 2013). Finally, additional evidence for the
func-tional link between lipid and IR is, that humans with lipodystrophy due to genetic
mu-tations, also present with insulin resistance (Simha and Garg 2009).
1.1.5. Metabolic flexibility is compromised in obesity.
Cells are programmed to exhibit metabolic flexibility (Mingrone, Manco et al. 2005).
In response to substrate availability and cellular demand, cells are capable of
switch-ing between lipid or glucose oxidation (Astrup, Buemann et al. 1996, Blaak and Saris
2002). Under homeostatic conditions, glucose oxidation is more commonly used as a
cellular substrate. The randall hypothesis was proposed to explain the etiology of
T2DM during obesity. During obesity and T2DM, the excess circulating free fatty
metab-olically active abdominal adipose depots, may contribute to the impairment of
glyco-lysis and development of glucose intolerance. One process by which this may occur is
the stimulation of gluconeogenesis in hepatocytes (stimulated by free fatty acids and
results in the creation of glucose from predominantly pyruvate, glycerol or lactate)
further compounding the situation. In an attempt to return these elevated glucose
lev-els to a homeostatic level, the pancreas releases insulin to promote the conversion of
the glucose to glycogen. The impairment of glycolysis and continued release of
insu-lin to control glucose levels in the blood, places significant pressures on energy
ho-meostasis regulation. Research has suggested that it is the impairment of carbohydrate
metabolism and development of glucose intolerance, orchestrated by these circulating
free fatty acids, which are responsible for the pathophysiology of T2DM.
1.2. Energy homeostasis in adipose tissue.
1.2.1. Regulation of energy metabolism in a dipose tissue.
Previously dismissed as nothing but a passive site for excess energy storage (Ahima
2006), the identification that adipokines secreted from a dipose tissue can modulate
energy homeostasis, insulin action and whole body metabolic processes including
glucose and lipid metabolism (Antuna-Puente, Feve et al. 2008, Abella, Scotece et al.
2014, Knights, Funnell et al. 2014), has brought the role of a dipose tissue as an
en-docrine organ to the fore. The origin of the term adipokines, was coined to
collec-tively represent the group of hormones generated from adipocytes and the stromal
vascular fraction within the adipose tissue (Antuna-Puente, Feve et al. 2008). A
multi-tude of cell types including preadipocytes, macrophages and fibroblasts are contained
et al. 2010, Liu, Guo et al. 2014). Collectively, these cell types work in coordination
with the adipokines secreted from them, to support the a dipose tissue within energy
[image:29.595.96.498.185.466.2]homeostasis (Lehr, Hartwig et al. 2012, Abella, Scotece et al. 2014).
Figure 1.4. Energy homeostasis and hepatic glucose metabolism.
Energy homeostasis is regulated through balancing dietary intake with cellular
re-quirements for energy in the form of ATP. This model displays the different
mecha-nisms involved in coordinating and monitoring availability of nutrients. Signals
gen-erated from circulating nutrients or adipose related adipokines e.g. leptin and insulin
are transduced to the hypothalamus. As a consequence, changes in energy intake,
ex-penditure and glucose production occur. Under conditions of nutrient excess, glucose
production is lowered and nutrients are stored as triglycerides resulting in an increase
in body fat mass. Conversely, during starvation, leptin secretion is reduced promoting
an enhancement in appetite. Together with a feedback loop from leptin, insulin
secre-tion is lowered reducing storage of essential energy in adipocytes. Figure taken and
1.2.2. Role of adipokines in energy homeostasis.
Adipose tissue can respond to both central and peripheral metabolic signals via
adi-pokines (Trayhurn and Wood 2004, Antuna-Puente, Feve et al. 2008). Adiadi-pokines can
regulate appetite (leptin, 1.2.2.2) as well as energy expenditure (adiponectin,1.2.2.3
thereby extending their role from a cellular level to whole body homeostasis (Dyck
2009). A description of a few critical adipokines and their role within energy
homeo-stasis are given below :
1.2.2.1. TNFα: is a pro-inflammatory cytokine and is primarily secreted from macro-phages. Insulin resistance induced through TNFα action, has been proposed to involve
dysregulation of fatty acid metabolism together with impairment of insulin signalling
(Dyck 2009).
1.2.2.2. Leptin: is a 16kDa non-glycosylated hormone (Kamohara, Burcelin et al.
1997). As a critical regulator of appetite, it works with the central nervous system as a
signalling molecule between adipose tissue and the brain. Leptin is secreted from
adi-pocytes and is capable of initiating lipolysis through its stimulatory and feedback
ac-tivity on the sympathetic nervous system (Kennedy 1953). Furthermore, it is capable
of lowering food intake whilst concurrently increasing energy expenditure (Friedman
and Halaas 1998). These functions are achieved through signalling to hypothalamic
nuclei via neuronal circuits, resulting in the promotion of anorexigenic factors
(appe-tite suppressant) together with the inhibition of the opposing orexigenic (appe(appe-tite
characterisation of the murine obese (ob) gene or human LEP gene, leptin protein was
identified as an ob gene product (Zhang, Proenca et al. 1994). Through its appetite
suppressing action, leptin is capable of promoting weight loss (Pelleymounter, Cullen
et al. 1995). Conversely, during conditions of nutrient deprivation, a key energy
sen-sor AMPK is activated by leptin (Wu, Chao et al. 2013). The detection of high AMP:
ATP ratio by AMPK, results in the activation of fatty acid oxidation to enhance
shut-tling towards oxidative phosphorylation. The ATP generated via oxidative
phosphory-lation, maintains the capability of mitochondria to meet the energy demands of the
cell (Covey, Wideman et al. 2006).
1.2.2.3. Adiponectin: originally identified in 1995 (Scherer, Williams et al. 1995) is
secreted in serum and is an insulin sensitising, anti-inflammatory and anti-apoptotic
protein (Dridi and Taouis 2009). During obesity and T2DM, adiponectin binds to tthe
adiponectin receptor (Hara, Yamauchi et al. 2005). As a result, energy expenditure is
reduced resulting in weight gain (Hara, Yamauchi et al. 2005, Tajtakova, Petrasova et
al. 2006). Two forms of adiponectin, globular and full-length adiponectin are capable
of binding and thereby activating both adiponectin receptors, adipoR1 and adipoR2
(Guillod-Maximin, Roy et al. 2009). Nevertheless, the binding affinity of adipoR1 is
greater for the globular compared to the full-length form of adiponectin (Yamauchi,
Kamon et al. 2003). Following their activation, a diponectin receptors transduce their
signal to a number of signalling messengers including MAPK, PPAR-α and AMPK
(Trayhurn and Wood 2004, Iwabu, Yamauchi et al. 2010, Chen, Zhang et al. 2013).
Insulin resistance and obesity have been shown to be inversely proportional to plasma
studies revealed that the reduction of adiponectin expression was linked to a greater
incidence of metabolic syndrome (Kozlowska and Kowalska 2006, Miczke, Szulinska
et al. 2006, Shimomura, Maeda et al. 2006, Tajtakova, Petrasova et al. 2006,
Mo-jiminiyi, Abdella et al. 2007). Finally, observation studies have concluded that human
adiponectin levels in those with T2DM are greatly reduced compared to their
non-diabetic counterparts (Vasseur, Meyre et al. 2006). Administration of adiponectin in
mice with obesity and insulin resistance boosted their low basal circulating
adipo-nectin levels and corresponded with an improvement in their insulin sensitivity
to-gether with enhanced glucose tolerance (Yamauchi, Kamon et al. 2003).
1.2.3. Energy homeostasis dysregulation in obesity and T2DM.
Obesity is often associated with dysregulated adipokine secretion (Nawrocki, Rajala
et al. 2006). In obese and insulin resistant patients, adiponectin is downregulated,
whilst leptin is increased (Qi, Takahashi et al. 2004). Mutations in the ob gene are
accompanied by insufficient expression of leptin. It is this downregulation of leptin,
which is responsible for the 3-fold increase in the weight of ob/ob mice compared to
wild type mice (Schafer, Halle et al. 2004). Leptin and insulin signalling are known
as the adipo-insular axis and are integral for regulating nutrient and energy balance
(Perry and Wang 2012). The exact mechanisms responsible for coordinating both the
local and global effects of leptin in promoting insulin sensitivity are unknown and
1.3. Mitochondrial health and function.
Mitochondrial health is vitally important for cellular viability and function
(Magal-haes, Venditti et al. 2014). As the powerhouse of the cell, mitochondria are
responsi-ble for liberation of the energetic substrate, ATP via the fatty acid cycle and oxidative
phosphorylation (Figure 1.8) (Hafner, Brown et al. 1990).The symbiotic relationship
between the mitochondria and nucleus enables nuclear synthesis of the majority of the
1500 mitochondrial proteins (37 are encoded in the mitochondrial genome, 13 of
which are required for oxidative phosphorylation) (Anderson, Bankier et al. 1981,
Gaston, Tsaousis et al. 2009).These include subunit 6 (mt-ND6) of NADH
dehydro-genase (complex I) and subunit 6 (mt-ATP6) of ATP synthase (complex V) (Van
Ber-gen, Blake et al. 2014). Given the critical role of mitochondria to cellular health, the
process of nuclear synthesis of mitochondrial proteins may have arisen to minimise
the effect of the greater mitochondrial mutation rate, as much as 10-20 times that of
the nuclear genome (De Pauw, Demine et al. 2012). Coupled with this, mitochondrial
DNA repair enzymes have a low activity status (Linnane, Marzuki et al. 1989, Wang,
Lin et al. 2009). Therefore, quality control mechanisms have evolved within the
mito-chondria in an attempt to overcome some of the limitations of this inefficient DNA
repair system. One example of these quality control mechanisms is mitochondrial
biogenesis (Attardi and Schatz 1988, Medeiros 2008, Ren, Pulakat et al. 2010,
Weck-becker and Herrmann 2013).
1.3.1. Mitochondrial biogenesis.
Mitochondrial biogenesis protects mitochondrial health through the maintenance of
in-volving the coalescence of old mitochondria and their subsequent division (Ren,
Pu-lakat et al. 2010). As a result, functional mitochondrial DNA is retained whilst
com-promised mitochondrial DNA is selectively eliminated (Ren, Pulakat et al. 2010).
Mi-tochondrial DNA synthesis occurs de novo during the cell cycle to return
mitochon-dria mtDNA abundance to their homeostatic levels (Sheng and Cai 2012). However,
during obesogenic conditions, mitochondrial biogenesis is impaired thereby
contribut-ing to mitochondrial dysfunction. Mitochondrial biogenesis is coordinated at a
tran-scriptional level by peroxisome proliferator activated receptor co-activator 1 alpha
(PGC1α) (Fernandez-Marcos and Auwerx 2011) and nuclear respiratory factor 1
(NRF-1) (Escriva, Rodriguez-Pena et al. 1999). Together these promote the induction
of the catalytic subunit of the mitochondrial DNA polymerase (POLG) and expression
of other biogenesis transcription factors i.e. mitochondrial transcription factor A
(Tfam) and oxidative phosphorylation (OXPHOS) genes required for mitochondrial
replication (Murholm, Dixen et al. 2009, Elachouri, Vidoni et al. 2011). Previous
studies have identified that patients who possess mutations in either a mitochondrial
or nuclear gene involved in mitochondrial function, exhibit disturbances in their
respi-ratory capacity (Pich, Bach et al. 2005). Thus respiratory or oxidative capacity is a
reflection of both mitochondrial biogenesis and mitochondrial morphology regulated
via mitochondrial dynamics.
1.3.2. Mitochondrial dysfunction.
Mitochondrial dysfunction is most commonly defined as the inability of mitochondria
to produce ATP in response to cellular demand (Bournat and Brown 2010).
biogene-sis, reduction in fatty acid oxidation or increased production of reactive oxygen
[image:35.595.118.472.157.424.2]spe-cies (ROS) (Lowell and Shulman 2005, Zorzano, Liesa et al. 2009).
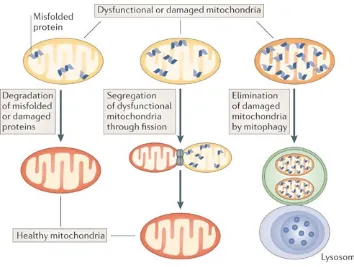
Figure 1.5. Origins of mitochondrial dysfunction.
Mitochondrial quality control involves surveillance and protection strategies to limit
mitochondrial damage and ensure mitochondrial integrity. This quality control occurs
at the following molecular, organelle and cellular levels. Figure and legend taken
from (Sheng and Cai 2012).
Importantly, mitochondrial dysfunction has been proposed to account for the
genera-tion of toxic lipid metabolites via the fatty acid cycle and hampering of metabolic
fit-ness, which accompany the stunted adipogenic capacity and Adipose tissue
dysfunc-tion (Vankoningsloo, Piens et al. 2005, Liu, Lin et al. 2012). Finally, evidence in
co-association of reduced mitochondrial oxidative phosphorylation capacity and
insu-lin resistance in elderly or obese individuals (Petersen, Dufour et al. 2004).
Further-more, mitochondrial dysfunction extends beyond the inability to synthesise sufficient
ATP, to processes of mitochondrial DNA abundance and mitochondrial morphology
(Okamoto and Shaw 2005, Yu, Robotham et al. 2006). In the skeletal muscle of obese
and T2DM, a reduction of mitochondrial copy number together with enhanced
mito-chondrial fission have been observed (Barthelemy, Ogier de Baulny et al. 2001, Jeng,
Yeh et al. 2008). Mitochondrial dynamics, which involves mitochondria fission, is
discussed in further detail in section 1.4.2.
1.3.3. Causes of mitochondrial dysfunction.
Despite multiple studies in skeletal muscle implicating a connection between insulin
resistance and mitochondrial dysfunction, little data is available in white adipose
tis-sue (WAT), regarding the involvement of mitochondria during conditions of insulin
resistance or AT dysfunction.
1.3.4. Mitochondrial dysfunction in adipose tissue.
In humans, insulin resistance has been found to co-exist with a lower mitochondrial
oxidative phosphorylation activity (Petersen, Dufour et al. 2004). Nevertheless,
whether insulin resistance is a primary or secondary effect of mitochondrial
dysfunc-tion is unknown (Shulman 1999, Shulman 2000, Guilherme, Virbasius et al. 2008,
Amati, Dube et al. 2011, Koliaki and Roden 2014). In an attempt to address this
ques-tion, studies performed in skeletal muscle of obese and T2DM subjects found that
Martins et al. 2012). Recapitulating this scenario and analysis of mitochondrial
dy-namics in skeletal muscle biopsies from either morbidly obese (Semple, Crowley et
al. 2004), following a high fat feed in humans with an ideal BMI (Richardson,
Kashyap et al. 2005, Sparks, Xie et al. 2005)or mice (Rong, Qiu et al. 2007) resulted
in the downregulation of the mitochondrial biogenesis gene, PGC1α (Puigserver and
Spiegelman 2003, Mitra, Nogee et al. 2012). As mentioned earlier in section 1.3.1, the
respiratory capacity of mitochondria is a reflection of both mitochondrial biogenesis
and morphology that are regulated via mitochondrial dynamics.
1.4. Mitochondrial dynamics.
In response to changes in their cellular environment, mitochondria are able to alter
their morphology and abundance through the balance of “fusion” and “fission” events
(Liesa, Palacin et al. 2009). Together with mitophagy, mitochondrial dynamics genes
selectively identify and eliminate dysfunctional mitochondria (Twig, Elorza et al.
2008, Twig, Hyde et al. 2008).
1.4.1. Fusion.
Mitochondrial fusion is characterised by two independent events culminating in the
coordinated fusion of inner and outer mitochondrial membranes from separate
mito-chondria to form a single larger mitochondrion (Huang, Galloway et al. 2011). The
mitochondrial membrane proteins involved are Opa1 (inner mitochondrial membrane
Opa1: Optic atrophy 1 is a dominant autosomal mutation resulting in atrophy of the
optic nerve and often progresses to visual blindness (Figure 1.9) (Eiberg, Kjer et al.
1994, Alexander, Votruba et al. 2000, Olichon, Landes et al. 2007, Song, Chen et al.
2007, Akepati, Muller et al. 2008). The regulation of Opa1 occurs at a
post-transcriptional level through alternative splicing (Song, Chen et al. 2007). Splicing at
exons 4,4b and 5b can generate a total of 8 mRNA isoforms (Satoh, Hamamoto et al.
2003, Akepati, Muller et al. 2008). Opa1 isoforms that include exon 4 (Opa1 isoform
1, the most abundant in mice and humans) have been shown to influence
mitochon-drial fusion activity and maintain membrane potential (Akepati, Muller et al. 2008).
Following the generation of Opa1 isoforms, proteolytic cleavage represents a
secon-dary level of Opa1 regulation (Satoh, Hamamoto et al. 2003, Duvezin-Caubet, Jagasia
et al. 2006, Ishihara, Fujita et al. 2006, Ehses, Raschke et al. 2009). Proteolytic
cleav-age generates shorter Opa1 isoforms, at the expense of a reduction in the abundance
of the longer isoforms (Olichon, Emorine et al. 2002, Ishihara, Fujita et al. 2006,
Ehses, Raschke et al. 2009, Quiros, Ramsay et al. 2012). Only these longer isoforms
possess the capacity to redress defective mitochondrial fusion in Opa1 knockout cells
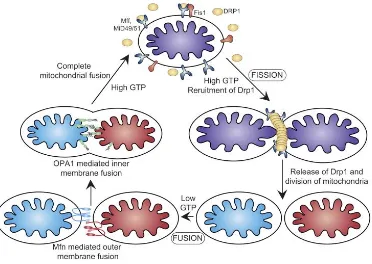
Figure 1.6. Proteins involved in mitochondrial dynamics.
Mitochondrial fission involves the translocation of Drp1 from its cytosolic location to
the outer mitochondrial membrane. Fis1 together with the other integral membrane
proteins of Mff, MiD49 and MiD51 have been proposed to assist in the recruitment of
Drp1 to the outer mitochondrial membrane. Nevertheless, the role and mechanism of
these putative Drp1 receptors are still under investigation. Drp1 creates a concentric
ring around the mitochondria restricting the mitochondrial tubule and mediating
fis-sion to generate two asymmetric daughter mitochondria. Fufis-sion, involves Mfn1/2 and
Opa1. Opa1 mediates the tethering of inner mitochondrial fusion whilst Mfn mediate
outer mitochondrial fusion. Together these contribute to the coalescence of two
mito-chondria to a single mitochondrion. This coalescence allows mixing of mitomito-chondrial
contents including protein and DNA. Complete mitochondrial fusion is dependent on
GTP hydrolysis. Mitochondrial fission factor (Mff), mitochondrial dynamics proteins
of 49 and 51kDa (MiD49/51), Guanosine triphosphate (GTP), optic atrophy 1 (Opa1),
dynamic related protein (Drp1), mitochondrial fission protein 1 (Fis1), Mfn
Mfn2: Mitofusin 2 is localised within the outer mitochondrial membrane and assists
with mitochondrial fusion (Figure 1.9) (Chen, Detmer et al. 2003, Bach, Naon et al.
2005). Mutations within Mfn2 gene cause the autosomal dominant neurodegenerative
disease Charcot-Marie-Tooth type 2A (CMT) resulting in weakness and loss of
mus-cle control particularly in the lower extremities e.g. the feet. (Zuchner, Mersiyanova et
al. 2004) Knockdown of Mfn2 is associated with lower mitochondrial oxygen
con-sumption together with diminished mitochondrial membrane potential (Pich, Bach et
al. 2005). These observations also exist within patients with known Mfn2 mutations
within their fibroblasts. Fibroblasts from patients with amino acid substitutions from
R364Q or A166T have greater oxygen consumption at rest together with a diminished
mitochondrial membrane potential (Loiseau, Chevrollier et al. 2007).
Mfn1: Mitofusin 1 is a human homolog of Mfn2 (Santel, Frank et al. 2003). In
keep-ing with their homologous nature, Mfn1 shares 80% sequence identity with Mfn2
(Detmer and Chan 2007). Likewise, the functional domains of the GTPase,
Coiled-coil regions, GTPase effector domain and transmembrane domain are conserved
across Mfn1 and 2 (Ishihara, Eura et al. 2004). A localisation sequence located within
the carboxy terminus of the protein directs the localisation of the transmembrane
GTPase protein to the outer mitochondrial membrane (Santel, Frank et al. 2003).
Mi-tochondrial fusion is initiated through formation of a dimeric anti-parallel coiled-coil
structure (Koshiba, Detmer et al. 2004). Formation of this complex, engages the
teth-ering of two mitochondria and signifies that mitochondrial fusion has begun
embryos, as it results in defects within placenta formation (Chen, McCaffery et al.
2007).
FOXC2: Forkhead transcription factor 2 is capable of inducing mitochondrial fusion
(Lidell, Seifert et al. 2011) and is associated with a lean and insulin sensitive
pheno-type (Cederberg, Gronning et al. 2001). Furthermore, its critical role as a metabolic
regulator is evidenced by its ability to transactivate Tfam and initiate
mitochondrio-genesis resulting in elongated mitochondrial morphology (Bergman, Van Citters et al.
2001). Correlation analyses between FOXC2 and mitochondrial fusion genes (Mfn2,
Mfn1 and Opa1) have confirmed a positive association and provide support to
sugges-tions that the regulation of fusion by FOXC2 extends from mice to humans (Lidell,
Seifert et al. 2011).
1.4.2. Fission.
Fission involves the segregation of one mitochondrion into two smaller mitochondria
(James, Parone et al. 2003). This process is unequal, and is used to segregate the
compromised mitochondrial membrane and its components from an otherwise
func-tional organelle (Figure 1.9) (Twig, Elorza et al. 2008, Galloway, Lee et al. 2012,
El-gass, Pakay et al. 2013). Where possible, components such as lipids within the
mito-chondrial membrane are recycled and the remainder of the defective mitomito-chondrial
membrane is tagged for degradation by ubiquitylation (Praefcke and McMahon 2004).
Similar to the ubiquitylation of misfolded proteins, compromised mitochondria are
cellular autophagy) (Twig, Elorza et al. 2008, Twig, Hyde et al. 2008). Mitochondrial
fission requires Drp1 and Fis1 proteins.
Drp1: is a key protein required for fission and translocates from the cytosol to the
mi-tochondria with assistance from Fis1 (Figure 1.9) (Smirnova, Shurland et al. 1998).
Once localised to the outer mitochondrial membrane, Drp1 punctuate holes within the
mitochondria required for initiation and assembly of future sites of fission (Smirnova,
Griparic et al. 2001). Importantly, these scission sites are created as a concentric ring
within the outer mitochondrial membrane (Taguchi, Ishihara et al. 2007). Together
with the scission sites and a GTP hydrolysis reaction, mitochondrial membranes can
become severed and physically separated from one another (Liesa, Palacin et al.
2009). Nevertheless, the mitochondrial fission proteins involved in the division of the
inner mitochondrial membranes remain unresolved.
Fis1: is a 17kDa protein and functions as the mechanical scissors to finalise and
coor-dinate the creation of two separated mitochondria (Stojanovski, Koutsopoulos et al.
2004). Ubiquitously expressed and dispersed throughout the mitochondrial network
and is thought to be the limiting factor for mitochondrial fission (Yoon, Krueger et al.
2003).
1.4.3. Dysregulation of mitochondrial dynamics.
How mitochondrial dynamics become dysregulated is unknown. Understanding the
molecular mechanisms that underlie this phenomenon, offers a key opportunity to
their adipocyte expression, abundance of mtDNA and mitochondrial dynamics
pro-teins is lower than non-diabetic mice (Rong, Qiu et al. 2007). The balance of
mito-chondrial fusion and fission are key to maintaining mitomito-chondrial health and
mor-phology (Zorzano, Liesa et al. 2009, Liesa and Shirihai 2013). Over-activation of
fis-sion or an absence of balanced fufis-sion initiates the fragmentation of mitochondria
(Ferrier 2001, James, Parone et al. 2003, Huang, Galloway et al. 2011). Mitochondrial
fragmentation results in the generation of smaller and greater numbers of
dria. Depending on the duration and severity of the imbalanced fission, the
mitochon-drial population may become compromised or reduced in abundance through their
removal by mitophagy (Jheng, Tsai et al. 2012). Both mitochondrial fragmentation
and a reduction in mitochondrial membrane potential must occur before mitochondria
are shuttled towards mitophagy (Lee, Jeong et al. 2004). Under conditions of transient
or acute cellular stress, mitochondrial fusion can be upregulated to compensate for
damage induced within the mitochondria (Huang, Galloway et al. 2011). Investigation
of the effect of cellular stress within cultured cells have revealed that mitochondria
display the ability to resolve damage such as misfolded mitochondrial proteins or the
effects of cellular stress such as production of reactive oxygen species (ROS) (Michel,
Wanet et al. 2012). If unresolved, damage induced to cells would require their
re-moval by apoptosis (Ferrier 2001).
1.5. Mitochondrial bioenergetics.
Mitochondrial bioenergetics is a measure of mitochondrial capacity. Measurement of
oxidative phosphorylation enables quantification of the rate of ATP synthesis within
Figure 1.7. Quality control pathway: The life cycle of a mitochondrion and the
involvement of mitochondrial dynamics proteins.
Local control is exerted at the level of the G0 phase of the cell cycle (resting phase).
During this phase, mitochondrion undergo fusion, fission, depolarisation and
auto-phagic degradation. Global control is governed by the cellular metabolism and thus
demand for energy needed to perform cell division and re-organisation of cellular
components between cells during metaphase. Examples of these global signal effects
on mitochondria include, the presence of hyperfused mitochondrial network (cell
growth-synthesis, G1-S phase) or mitochondrial fragementation (cellular synthesis
and mitosis, S and M phases).Figure from Ferree,A. and Shirihai,O. Chapter 2.
Mito-chondrial oxidative phosphorylation: (748). Advances in Experimental Medicine and
1.5.1. Quantitative measurement of OXPHOS can be performed in situ.
Measuring mitochondrial bioenergetics can be performed in situ (Gerencser,
Chino-poulos et al. 2012) within a cell or following isolation of the mitochondrial fraction
from cells (Hafner, Brown et al. 1990). Recent developments in mitochondrial
bio-energetics have enabled in situ measurements of intracellular mitochondria. Despite a
slight compromise in precision for in situ analyses, this significantly outweighs the
damage and time required to perform bioenergetic analyses on isolated mitochondria
(Hafner, Brown et al. 1990). Additional advantages include the physiological
rele-vance of maintaining mitochondria within their cellular environment (Nicholls 2002,
Nicholls, Johnson-Cadwell et al. 2007). Mitochondria exhibit inter-organelle contacts
with the ER and interact with their cytoplasmic environment.
Maintaining mitochondria within its surrounding environment permits a more realistic
recapitulation of its interaction with other organelles and cellular role (Affourtit,
Jas-troch et al. 2011). The measurement in real time allows determination of the dynamic
flux of mitochondrial ATP production in response to energy demand. Mitochondrial
dysfunction is most commonly defined as the inability of mitochondria to produce
ATP in response to cellular demand (Nicholls 2002). Through parallel measurement
of mitochondrial potential and respiration, the effect of chemical, genetic treatment on
mitochondrial function together with the target site (within the mitochondrial
com-plexes of the oxidative phosphorylation chain) and distribution of this effect can be
Figure 1.8. The oxidative phosphorylation cycle.
Oxidative phosphorylation cycle involves electron transfer (e-) sequentially through
complexes I to V. Accompanying this are a series of redox reactions culminating at
the ATP synthase in the generation of ATP (adenosine triphosphate). Complex
inhibi-tors (given in orange boxes) Oligomycin is an ATP synthase inhibitor. Through its
in-hibition of this mitochondrial membrane bound complex, it is capable of blocking
oxidative phosphorylation from proceeding past this point of the electron transport
chain. As a consequence, only electrons generated through mitochondrial uncoupling,
allow protons to diffuse using UCP1 (uncoupling protein 1) from the outer to inner
mitochondrial membrane.
FCCP (carbonyl cyanide-p-trifluoromethoxyphenylhydrazone) is a
mitochon-drial uncoupling agent, used to increase mitochonmitochon-drial permeability to protons
through depolarisation of the mitochondrial membrane potential. FCCP measures the
maximal oxygen consumption rate of cellular mitochondria. Antimycin inhibits
com-plex III of the electron transport chain resulting in leaking of electrons to molecular
oxygen resulting in the generation of superoxides. Rotenone inhibits Complex I of the
electron transport chain (specifically the NADH dehydrogenase enzyme). The
cock-tail of antimycin/rotenone quantifies non-mitochondrial respiration rate within the
Maintaining mitochondria within its surrounding environment permits a more realistic
recapitulation of its interaction with other organelles and cellular role (Affourtit,
Jas-troch et al. 2011). The measurement in real time allows determination of the dynamic
flux of mitochondrial ATP production in response to energy demand. Mitochondrial
dysfunction is most commonly defined as the inability of mitochondria to produce
ATP in response to cellular demand (Nicholls 2002). Through parallel measurement
of mitochondrial potential and respiration, the effect of chemical, genetic treatment on
mitochondrial function together with the target site (within the mitochondrial
com-plexes of the oxidative phosphorylation chain) and distribution of this effect can be
1.6. Summary.
In summary, adiposity and T2DM are often accompanied by mitochondrial dysfunction.
Whilst, the role of mitochondrial dynamics in the regulation of mitochondrial abundance
have been previously addressed and is known to influence mitochondrial abundance and
morphology, its link to the regulation of mitochondrial function in adipocytes remains
largely uncharacterised. As the primary energy storage tissue, adipose tissue functions
together with mitochondrial dynamics to maintain energy homeostasis. As such,
investi-gating both theconsequences of adiposity on the balance of markers of mitochondrial
and may provide the basis for future research into novel therapeutic interventions for
obe-sity and T2DM.
1.7 Aims and Objectives.
Aim: Assess the regulation of mitochondrial dynamics in adipocytes and adipose
tis-sue.
The four key objectives of my thesis were as follows:
1. Define mitochondrial dynamics within human adiposity.
2. Bariatric surgery; implications of the surgical procedure and weight loss on
mitochondrial dynamics.
3. To study the regulation of mitochondrial dynamics by signalling pathways in
adipocytes.
4. Modelling the interaction between putative p38 beta isoform inhibitors and
their effects on mitochondrial morphology and bioenergetics.
Based on previous literature, I wished to test and examine the following hypotheses:
1. Mitochondrial dynamics proteins are differentially expressed in the
subcuta-neous a dipose tissue of lean, overweight and obese individuals.
2. Mitochondrial dynamics can be redressed through weight loss induced by
bariatric surgery in T2DM individuals.
3. p38 positively regulates mitochondrial dynamics and adipocyte differentiation.
4. Modelling of p38 and selection of putative p38 β isoform inhibitors.
5. p38 inhibition diminishes mitochondrial bioenergetics and is accompanied by
Chapter 2:
2.1. Introduction.
Obesity is a key contributory factor in the development of insulin resistance.
(Fernandez-Sanchez, Madrigal-Santillan et al. 2011) Obesity is defined as an
individ-ual whose body mass index is above 30 kg/m2 (World Health Organisation). The
co-existence of insulin resistance and obesity are known significant risk factors for the
development of T2DM (Bastard, Maachi et al. 2006, Abdullah, Peeters et al. 2010).
During periods of excess nutritional intake, which if continuous would result in
obe-sity, cellular substrates are converted for storage into cells as triglycerides (Scherer
2006). However, the site of fat storage also has metabolic implications for the
indi-vidual (Sun, Kusminski et al. 2011). In particular, central obesity, characterised by the
deposition of fat in the abdominal region (Rosen and Spiegelman 2006)
(subcutane-ous and visceral adipose tissue), is a greater risk factor for the development of T2DM
compared to that posed by peripheral obesity (accumulation of fat around the hips and
thighs) (Kraunsoe, Boushel et al. 2010). Mitochondria are indispensable for energy
homeostasis (Liesa and Shirihai 2013) (Magalhaes, Venditti et al. 2014) and are
re-sponsible for generating the essential cellular substrate, ATP via oxidative
phosphory-lation (Robertson 2014). Tasked with maintaining energy homeostasis, mitochondria
are capable of adapting their abundance and thus capacity to meet the energetic needs
of the cell, through mitochondrial biogenesis (Medeiros 2008) and dynamics
(Zor-zano, Liesa et al. 2009, Picard and Turnbull 2013). Mitochondrial dynamics regulates
mitochondrial abundance (Jeng, Yeh et al. 2008), morphology (da Silva, Mariotti et al.
2014) and health through fusion and fission (Okamoto and Shaw 2005, Palaniyandi,
Qi et al. 2010). Fusion generates a larger mitochondrion from two smaller