http://wrap.warwick.ac.uk
Original citation:
Hoffrichter, Andreas, Fisher, Peter, Tutcher, Jonathan, Hillmansen, Stuart and Roberts,
Clive. (2014) Performance evaluation of the hydrogen-powered prototype locomotive
‘Hydrogen Pioneer’. Journal of Power Sources, Volume 250 . pp. 120-127. ISSN
0378-7753
Permanent WRAP url:
http://wrap.warwick.ac.uk/64675
Copyright and reuse:
The Warwick Research Archive Portal (WRAP) makes this work of researchers of the
University of Warwick available open access under the following conditions.
This article is made available under the Creative Commons Attribution 3.0 (CC BY 3.0)
license and may be reused according to the conditions of the license. For more details
see:
http://creativecommons.org/licenses/by/3.0/
A note on versions:
The version presented in WRAP is the published version, or, version of record, and may
be cited as it appears here.
Performance evaluation of the hydrogen-powered prototype
locomotive
‘
Hydrogen Pioneer
’
Andreas Hoffrichter
*, Peter Fisher, Jonathan Tutcher, Stuart Hillmansen, Clive Roberts
University of Birmingham, Edgbaston, Birmingham B15 2TT, UK
h i g h l i g h t s
The performance of the UK’sfirst hydrogen-powered locomotive was evaluated. Empirical measurements of vehicle performance were gathered.
Behaviour of a hydrogen hybrid drive train for railway propulsion was analysed. Vehicle and power-plant efficiency in a number of scenarios was examined.
Little difference between duty cycle and steady state vehicle operation was observed.
a r t i c l e i n f o
Article history:
Received 23 August 2013 Received in revised form 16 October 2013 Accepted 29 October 2013 Available online 12 November 2013
Keywords: Hybrid Fuel cell Rail
Vehicle efficiency Hydrogen Hydrail
a b s t r a c t
The narrow-gauge locomotive‘Hydrogen Pioneer’, which was developed and constructed at the Uni-versity of Birmingham, was employed to establish the performance of a hydrogen-hybrid railway traction vehicle. To achieve this several empirical tests were conducted. The locomotive utilises hydrogen gas in a Proton Exchange Membrane Fuel Cell power-plant to supply electricity to the traction motors or charge the on-board lead-acid batteries. First, the resistance to motion of the vehicle was determined, then operating tests were conducted for the speeds 2 km h1, 6 km h1, 7 km h1, and 10 km h1on a 30 m straight, level alignment resembling light running. The power-plant and vehicle efficiency as well as the performance of the hybrid system were recorded. The observed overall duty cycle efficiency of the power-plant was from 28% to 40% and peak-power demand, such as during acceleration, was provided by the battery-pack, while average power during the duty cycle was met by the fuel cell stack, as designed. The tests establish the proof-of-concept for a hydrogen-hybrid railway traction vehicle and the results indicate that the traction system can be applied to full-scale locomotives.
Ó2013 Elsevier B.V. All rights reserved.
1. Introduction
The majority of the world-wide energy demand for railway
motive power is currently supplied by diesel [1], but concerns
about point-of-use emissions and total greenhouse gas contribu-tions as well as petroleum supply security require alternative so-lutions for railway lines that are not economical to electrify. Hydrogen, being a secondary energy, allows a mix of production feedstocks and leaves as point-of-use exhaust pure water if utilised
in fuel cells[2]. For these reasons hydrogen-powered railway
pro-pulsion offers an alternative to diesel and this has been considered
in several studies[3e8], and the application of fuel cells as
power-plants for railway vehicles has been discussed[9e12]. The annual
International Hydrail Conference,www.hydrail.org, is dedicated to
the topic of hydrogen-powered railway vehicles and hydrogen fuel cells as power-plants for railway motive power. In addition to these studies and the conference series, some prototypes have been
constructed [13e18]. In 2012, the first commercial fleet of five
hydrogen-powered locomotives was introduced in South Africa for
use in a mine [19], and four hydrogen-powered trams will be
brought into commercial operation in Aruba during 2013[20].
The UK’s first hydrogen-powered locomotive was developed
and demonstrated at the University of Birmingham in June 2012[7].
This narrow-gauge hybrid locomotive, the‘Hydrogen Pioneer’, was
employed for an empirical performance evaluation. The vehicle uses gaseous hydrogen in a Proton Exchange Membrane (PEM) Fuel Cell to generate power for traction or charging of the on-board lead-acid batteries, which are also re-charged during braking. A DC to DC converter, together with the fuel cell stack forms the power-plant of the Hydrogen Pioneer. The electrical drive-train, or DC bus, can be fed either from the power-plant or the battery-pack *Corresponding author. Tel.:þ44 (0) 121 414 5063.
E-mail address:[email protected](A. Hoffrichter).
Contents lists available atScienceDirect
Journal of Power Sources
j o u r n a l h o me p a g e : w w w . e l s e v i e r . c o m / l o c a t e / j p o w s o u r
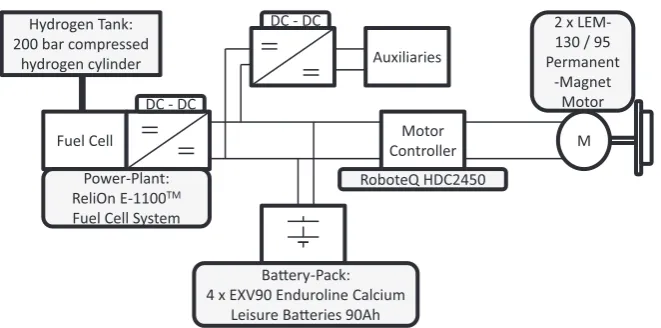
or a combination of both. The power output of the DC bus is used to drive the traction motors, supply power to auxiliaries and, depending on the operating conditions, to charge the battery-pack.
The parameters of the locomotive are presented inTable 1and the
drive-system is illustrated inFig. 1.
The evaluation consisted of (a) the Run-Down Experiment, to determine the resistance to motion, and (b) the Locomotive
Oper-ation Experiment, to establish the drive-train efficiency in
oper-ating conditions.
An on-board National Instruments CompactRIO computer system was used to control the locomotive and collect the measured data, which were stored for later processing and analysis. This data acqui-sition system is able to measure and record the following properties:
Hydrogen consumed by the fuel cell, measured using a mass
flow meter.
Electrical current output of the fuel cell.
Electrical voltage across each battery and currentflow through
all batteries, and thus the DC traction bus voltage whilst in operation.
Electrical current draw of the traction motor controller.
Speed of the locomotive, measured using a tachometer on one
axle.
Only data relevant to each experiment were collected and analysed as described in more detail below. All tests were con-ducted without a trailing load, therefore, resembling light running on a full-scale operational railway.
2. Locomotive characteristics
The resistance to motion for railway vehicles is often described
through the Davis equation[24,25]:
R ¼ AþBvþCv2 (1)
where: resistance term A is independent of speed and mainly
influenced by the mass of the vehicle, accounting for rolling
resis-tance, track resisresis-tance, and friction in bearings. Resistance termBv
increases proportionally with speed and accounts forflange
fric-tion, swaying, and oscillation. Resistance termCv2increases with
the square of the speed and accounts for aerodynamic drag[24].
Traditionally, the Davis parameters, A,B, and C, are determined
through analysis of railway vehicle run-down tests [25]and this
was the approach taken to determine resistance to motion of the Hydrogen Pioneer. Test track was installed in the laboratory and the locomotive was accelerated to the maximum safe speed, after which propulsion was stopped and the vehicle decelerated to a halt due to the resistance to motion. The collected speed and
deceler-ation data were tabulated and a function derived tofit the
experi-mental data while conforming to the general Davis equation. Computational modelling of the braking performance of the Hydrogen Pioneer was employed to establish its resistance to motion function, which is as follows:
R ¼ 0:051626þ0:018131v (2)
Giving the Davis parameterAas 0.052 kN andBas 0.018 kN
when rounded. A coefficientCis not present, and Davis[24]
[image:3.595.43.294.84.292.2]ex-plains that an equation without an exponential term is to be anticipated for light vehicles that travel at low speeds and have a small cross section. The Hydrogen Pioneer conforms to these conditions.
Table 1
Hydrogen Pioneer hybrid locomotive parameters.
Parameter Unit
Mass (without hydrogen tank) 270 kg
Maximum speed 20 km h1
Characteristics of the ReliOn E-1100Ôpower-plant[21]
Maximum net power output (electrical) 1.1 kW
Output tension 48 V
Rated current at 48 V DC 28 A Hydrogen consumption at 1000 W output 13 slpm Characteristics of the LEM-130/95 permanent magnet traction motor[23]
Peak current 100 A
Rated tension 36 V
Continuous traction motor power 2.2 kW
Rated torque 4.35 Nm
Number of motors 2
Characteristics of the EXV90 Enduroline calcium leisure battery 90 Ah[22]
Tension 12 V
Capacity (one battery) 90 Ah Battery-pack capacity (four batteries) 4.3 kWh DC-bus electrical tension 48 V Tractive effort (with compressed hydrogen tank) 645 N Maximum acceleration with a 600 kg trailing load 0.8 m s2 Hydrogen-gas storage pressure 200 bar Gross mass of hydrogen tank 16 kg
[23]Lynch Motor Company. (2013). LMC Motors: LEM-130. Honiton: Author. [21]ReliOn. (2011). E-1100TM Fuel Cell System: Operator’s Manual. Spokane, WA: Author.
[22]Tayna Ltd. (2013). EXV90 Enduroline Calcium Leisure Battery 90 Ah. Retrieved
from http://www.tayna.co.uk/EXV90-Enduroline-Calcium-Leisure-Battery-P8281.
html.
Fig. 1.Drive-train of the Hydrogen Pioneer.
[image:3.595.139.470.563.727.2]3. Locomotive Operation Experiment
Tests at various selected maximum speeds of the locomotive were conducted to show the respective energy contribution of the
power-plant and battery-pack. Test speeds of 6 km h1 and
7 km h1showed negligible battery-pack charging, thus allowing
comparison with other non-hybrid railway traction technologies. Further tests at two representative speeds were also
under-taken: at 2 km h1 the power-plant charges the battery-pack as
well as drives the vehicle, and at 10 km h1the batteries contribute
energy to meet the higher traction power demand.
All tests were conducted outdoors on a 30 m long test track, with a 5 m safety distance at each end to ensure safe stopping of the locomotive before the end of the line. The track only included straight alignment and a reasonably level right of way, but a small gradient, due to the gravel subgrade, was present. The Hydrogen Pioneer was operated with a pressurised 200 bar gas cylinder, which had a mass of 16 kg.
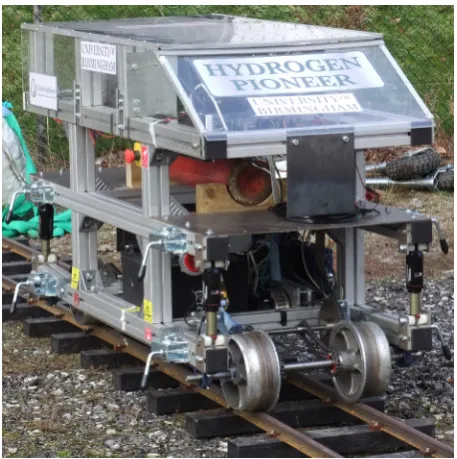
The locomotive was placed on the test track and operated in the
forward and reverse directions.Fig. 2shows the locomotive on the
test track prior to the start of the experiment.
Each speed test consisted of five forward and five reverse
movements, covering a distance in each move of between 20 and 25 m. The vehicle was accelerated as fast as possible to the selected maximum speed and, once the marker point for the experiment distance was reached, slowed as quickly as possible, utilising the regenerative service brake. After a brief stop, the run was repeated
in the opposite direction. This procedure continued untilfive laps
were completed, as illustrated inFig. 3, and is the modelled duty
cycle of the locomotive including acceleration and deceleration. In contrast, the steady state operation analysis shown below only includes a subset of the data: the time when the vehicle is operating at its target speed.
All the results, data analysis, and data presentation conform to
the law of conversion of energy, and the termlossis used in this
context to refer to energy that could not be utilised for a useful purpose but led to non-recoverable heat generation. The lower
heating value of hydrogen, at 120.21 MJ kg1, has been applied to all
relevant calculations.
The auxiliary power value was not measured but was deter-mined through calculation: From the power-plant output, the motor controller power and the battery charge power were sub-tracted to give the value for power consumed by the auxiliaries. Losses are also included in this calculation, but are considered negligible due to the short cable length. Auxiliaries are all the components that are not directly necessary for the drive-train but are necessary for vehicle operation; they include: the CompactRIO control computer and associated instrumentation, the traction
motor controller, and the vehicle’s emergency stop and mechanical
brake systems.
3.1. Results and discussion
Detailed results are presented for the 7 km h1test, which was
closest to hydrogen-only operation over the whole duty cycle. To avoid repetition, the results for the other speeds are summarised
and shown after the 7 km h1 test, which is followed by a
discussion.
3.1.1. 7 km h1maximum speed test
In this test the target line-speed of the locomotive was 7 km h1
(1.94 m s1), and each run was approximately 25 m long, as shown
[image:4.595.44.273.64.294.2] [image:4.595.303.554.67.239.2]in Fig. 3. In this figure, the brief stops of the locomotive are Fig. 2.Hydrogen Pioneer on 30 m test track.
Fig. 3.Distance covered during 7 km h1duty cycle test.
[image:4.595.304.552.552.726.2]indicated by the peaks and troughs. The target speed was
main-tained for the majority of the running time, illustrated inFig. 4, and
the stops are indicated by the troughs. A slight variation in the actual speed can be observed between forward and reverse runs, indicating the gradient in the alignment. The gradient does not have a large effect on the other results as the slightly higher energy consumption during the uphill run is balanced by the lower energy consumption during the downhill run.
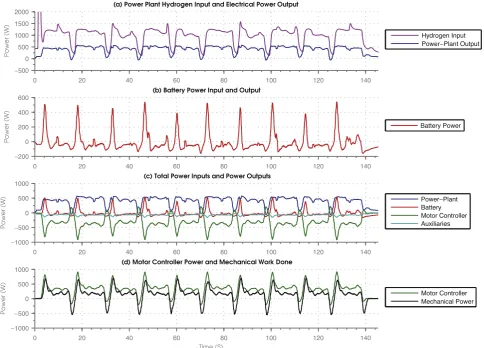
The power that was necessary to complete the duty cycle is presented inFig. 5.
Graph (a) inFig. 5shows the hydrogen input into the
power-plant and the corresponding electrical-power output of the power-plant. The large peaks in the hydrogen consumption are due to power-plant maintenance, where the fuel cells are purged with addi-tional hydrogen to remove excess water that is produced when in operation. The hydrogen used for purging is not converted to en-ergy but ensures the reliable operation of the fuel cells.
Graph (b) shows the power contribution of the battery-pack, and it can be seen that the batteries are being charged for the majority of the duty cycle. The battery-pack provides power in high power demand situations, such as during acceleration, which is illustrated by the positive peak values. Energy recovered through regenerative braking is shown at the negative peak power values in this graph.
Graph (c) shows the DC bus power inputs and consumption. Power consumption is shown as negative values while input power is shown as positive. The auxiliary power consumption remains relatively constant throughout the duty cycle, and the majority of
the input-power is transferred to the traction motor controller and consequently to the traction motors.
Graph (d) shows the power consumption by the traction motors and the power required to overcome the resistance to motion. This value is based on the Davis equation determined earlier, combined with the power necessary or gained during acceleration of the vehicle; its kinetic power.
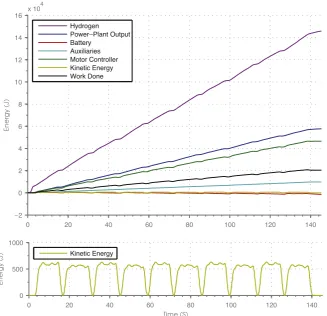
The cumulative integration of the power of each main compo-nent over time, or the cumulative energy distribution during the
duty cycle, is visually presented inFig. 6. The Hydrogen designation
in the graph’s legend refers to hydrogen input into the power-plant.
The depletion of hydrogen in the pressurised tank is not shown. InFig. 6it can be seen that the overall energy consumption rises over the time of operation, as expected. Further, it is shown that the battery-pack state of charge increases slightly over time. Therefore, the power-plant provides the energy necessary to move the vehicle
as well as to charge the battery-pack. The lower plot in thefigure is
a more detailed view of the kinetic energy stored through the motion of the locomotive. It drops to zero whenever the vehicle is stationary, at the end of each run.
The‘work done’plot accounts for the energy that was required
to overcome the resistance to motion during the duty cycle. The values at the end of the duty cycle as well as during steady state
operation are shown in Table 2. The account shows: in thefirst
[image:5.595.61.546.65.413.2]column, energy that is not used for the motion of the vehicle; in the second column, energy that is available for the motion of the vehicle, both columns designated in joules; in the third column, the drive-train component loss or energy available at the component in Fig. 5.Drive system performance for 7 km h1duty cycle test.
percentages; and in the fourth column, the cumulative
tank-to-wheel efficiency chain in percentage. All the values presented in
percentages have been rounded to the closest integer.
From the energy accounts it can be seen that overall efficiency
is higher in steady state operation compared to the overall duty cycle. This is expected, as the plant can operate in a continuous state rather than having to react to changes in energy demand, and is consistent with full scale experiments of electric traction
vehicles[26]. However, in our experiment the variation between
the steady state and the duty cycle efficiency is low, which
sug-gests a quick, reactive response to the change in demand. InFig. 7
the energy input share and the energy consumption distribution respective to the total energy input is presented for all tests. In the
7 km h1 test, overall vehicle efficiency is 14% during the duty
cycle and 15% in the steady state. The efficiency is lower than
anticipated, mainly due to the relatively low efficiency of the
traction motors at these speeds, but the power-plant performs as
expected. This suggests that traction motor changes or modifi
ca-tions to the mechanical drive-train may be necessary to increase the vehicle efficiency.
The Hydrogen Pioneer completed all the tests without difficulty,
establishing that a hydrogen-hybrid locomotive can perform various duty cycles effectively. The development of the locomotive was, therefore, a success and demonstrated the proof-of-concept of such a vehicle.
Effects of the short length and straight alignment of the test track, as well as the light running operating mode of the locomo-tive, were observed in all test results. These are primarily shown in
short steady state operation and in the relatively low vehicle effi
-ciencies, as no useful work, such as moving passengers or goods, was undertaken.
3.1.2. Power-plant
The power-plant performed as expected and provided an effi
-cient prime-mover in all cases but the lowest speed test at
2 km h1. A hydrogen-to-electrical power conversion efficiency of
around 40% was achieved, with a peak efficiency of 43%, which
matches the manufacturers specifications[21].
The lowest efficiency was recorded at the 2 km h1test when
only a fraction of the maximum power output was needed. This is expected, as with any chemical energy conversion device, low
ef-ficiencies are common at partial loading.
All the tests indicate a quick response of the power-plant to changes in power requirements. Further, little difference between the duty cycle and steady state performance is observed. This is in contrast to many combustion engine operated railway vehicles
where the peak efficiency is often considerably different from the
duty cycle efficiency[27]. An improved power management of the
hybrid drive-train could lead to cases where the power-plant is
operating close to its maximum efficiency for the majority of the
time.
The performance of the power-plant, established by the tests, suggests that a hydrogen fuel cell based prime-mover is suitable for railway applications; the small scale of the Hydrogen Pioneer having little effect on the functionality of the fuel cell stack. A more powerful fuel cell system that is suitable for standard gauge railway
vehicles could have a higher efficiency, of around 50%, as full-scale
tests have demonstrated[13,15].
3.1.3. Hybrid drive-train
In all tests the hybrid function of the locomotive was apparent: During high power demands, in the test cases during acceleration,
[image:6.595.132.460.65.381.2]the battery-pack contributed a significant proportion of the
traction power. During the regenerative service brake application the batteries were recharged, recovering some of the braking en-ergy. In steady state operation the power-plant charged the battery-pack in all but the highest speed test, as per locomotive design.
The power-plant provided, in the three lower-speed cases, all the energy required during the duty cycle, and the average
elec-trical power output was around 500 W for all but the 10 km h1test
case. If the lower speed cases were the standard operating condi-tions, then the power-plant could be down-sized to an output of slightly more than the average power requirement, approximately 600 W. This would not affect the performance of the locomotive but conserve energy.
The hybrid design shown can also be applied to full scale vehicles, allowing autonomous railway vehicles to utilise regen-erative braking and offers the potential to down-size the
prime-mover, both modifications lowering overall primary energy
consumption. The tests have demonstrated that this is a feasible option without compromising on performance. Autonomous hybrid railway vehicles have already been introduced on some
railway services[28,29], albeit not hydrogen-powered. The
au-thors suggest, based on the test results and implementation of the hybrid drive system, that hydrogen-hybrid traction systems
can be successfully implemented in full-scale railway traction vehicles.
3.1.4. Auxiliaries
Behaviour of the auxiliary load is similar throughout all tests in proportion to total energy consumption, with a small differ-ence in power draw between duty cycle and steady state oper-ation. This can be observed during acceleration, where a high power demand is present and the auxiliary load increases respectively.
The largest energy consumers are the control computer and the emergency brake hold-off, which both have relatively stable power requirements. The overall auxiliary power share is not excessive and the total consumption is reasonable for the locomotive operation.
3.1.5. Traction motors and mechanical drive-train
The traction motors and the mechanical drive-train perform poorly in all experiments in energy consumption terms, with a peak
efficiency of 43% in the 10 km h1test. The majority of the energy
[image:7.595.45.560.81.483.2]usage is most likely due to sub-optimum operation of the traction motors, as the losses in the mechanical drive train are likely to stay practically constant, independent of speed.
Table 2
Energy Account for 7 km h1locomotive test.
Energy source or consumer Energy not used for motion
Energy available for motion
J J % %
Duty cycle energy account
Energy source
Hydrogen 145867 100
Power-plant 88101 60
Electrical energy input 57766 40 40
Non-traction consumption
Battery-pack charge 1390 2
Auxiliary and electrical drive-train losses 9813 17
Total non-traction consumption 11203 19
Traction consumption
Energy available at traction motor controller 46563 81 32
Traction motors and mechanical drive-train 26129 56
Energy consumed to overcome resistance to motion 20434 44 14
Vehicle efficiency 14
Steady state energy account
Energy source
Primary energy input as hydrogen 1189 100
Power-plant 680 57
Electrical energy input 509 43 43
Non-traction consumption
Battery-pack charge 52 10
Auxiliary and electrical drive-train losses 70 14
Total non-traction consumption 122 40
Traction consumption
Energy available at traction motor controller 387 76 33
Traction motors and mechanical drive-train 214 55
Energy consumed to overcome resistance to motion 173 45 15
Vehicle efficiency 15
Given the current design, the traction motors operate with
maximum efficiency at vehicle speed of approximately 25 km h1,
rather than lower speeds used in these tests. Higher speeds were not possible due to the short track length.
The normal operating speed of the locomotive is within the
range represented by the tests, and vehicle efficiency could be
improved by altering the mechanical drive-train design. Increasing the gearing ratio between motor and driven wheelset would reduce maximum vehicle speed but allow the motor to operate in its most efficient region.
3.1.6. General performance
In general, the Hydrogen Pioneer performed better in steady state operation than in the overall duty cycle, as illustrated inFig. 8.
This is usual for any type of railway vehicle[26], but the difference
in performance seen in the conducted tests is small.
In the steady state, components such as the power-plant, bat-tery-pack, and traction motors do not have to react to changes,
which positively affect their performance. Total duty cycle effi
-ciency would increase with extended periods of steady state operation, and such periods would be typical of usual railway operation.
At low speeds, the vehicle’s performance was poor, owing to
the minimal utilisation and loading of all components. This was to be expected, as the vehicle was not designed to operate at such speeds for extended periods of time. Once the normal
operating speed is reached, between 5 km h1and 10 km h1, the
efficiency of the power-plant and the vehicle stabilise at around
40% and 15%, respectively. A higher vehicle efficiency in the
operating speed range is desirable, and this may be achieved through mechanical alterations as described above. When eval-uating the performance of the locomotive, the original design
objective must be considered: demonstration of proof-of-concept for hydrogen-powered railway traction vehicles. Rather than
optimising overall efficiency, the original design effort for the
Hydrogen Pioneer was focused on novel fuel and power-plant integration.
The performance of the vehicle is expected to improve with higher operating loads, as work done would increase proportion-ally more compared to energy consumption. The tests establish that a hydrogen-hybrid locomotive can perform a duty cycle in an
effective and efficient manner.
[image:8.595.78.509.63.379.2]The Hydrogen Pioneer energy storage and drive-train design, supported by the strong performance of the power-plant, will Fig. 7.Energy input share and energy distribution for locomotive speed tests.
[image:8.595.305.553.557.718.2]provide a valuable contribution towards a full-scale concept design. In such a design the main drive-train components, such as compressed-gas hydrogen storage, PEM fuel cell based power-plant, and a hybrid system utilising batteries as energy storage devices will be retained. Computer modelling of such a concept railway vehicle that includes data collected from this evaluation, such as duty cycle
power-plant efficiency, will allow fact based suitability evaluation.
Further, a comparison with a conventional simulated vehicle is possible and, therefore, performance characteristics, energy con-sumption, and carbon impact can be contrasted.
4. Conclusion
The narrow-gauge hydrogen-hybrid locomotive Hydrogen Pioneer was utilised for an empirical performance evaluation. It was established that the fuel cell power-plant operated as expected,
at an efficiency of around 40%, and the hybrid drive-train
per-formed as designed: the battery-pack provided peak power and was re-charged during steady-state operation and service braking. Overall, the evaluation showed a strong performance of the power-plant and hybrid-system, and established the suitability of both for railway traction purposes. A gaseous hydrogen on-board power supply system with a fuel cell based power-plant is demonstrated to be suitable for railway traction vehicles and the potential for a
high vehicle efficiency shown.
Acknowledgements
This research used equipment funded through the Science City
Research Alliance Energy Efficiency project, part funded by the
European Regional Development Fund. Further support was
pro-vided by the University of Birmingham’s “Circles of Influence”
alumni fund.
In addition to the authors, the Hydrogen Pioneer was con-structed by a number of colleagues at the University of Birming-ham, including: Duncan Coombe, Stephen Kent, and Daniel Reed. The team was supported by Alexander Bevan, Mani Entezami, Hamed Rowshandel, Louis Saade, Kevin Sperin, Edward Stewart, Graeme Yeo, and Adnan Zentani.
Andreas Hoffrichter and Jonathan Tutcher werefinancially
sup-ported by the Engineering and Physical Science Research Council.
References
[1] IEA, Transport, Energy and CO2, IEA, Paris, 2009. [2] C.-J. Winter, Int. J. Hydrogen Energy 34 (2009) S1eS52.
[3] S. Hillmansen, Proc. Inst. Mech. Eng., Part F J. Rail Rapid Transit. 217 (2003) 291e298.
[4] Y. Haseli, G.F. Naterer, I. Dincer, Int. J. Hydrogen Energy 33 (2008) 1788e 1796.
[5] G.D. Marin, G.F. Naterer, K. Gabriel, Int. J. Hydrogen Energy 35 (2010) 6084e 6096.
[6] G.D. Marin, G.F. Naterer, K. Gabriel, Int. J. Hydrogen Energy 35 (2010) 6097e 6107.
[7] A. Hoffrichter, Hydrogen as an Energy Carrier for Railway Traction (PhD thesis), University of Birmingham, Birmingham, 2013. Retrieved from,http:// etheses.bham.ac.uk/4345/.
[8] L.M. Fernandez, P. Garcia, C.A. Garcia, F. Jurado, Energy Convers. Manag. 52
(2011) 2183e2192.
[9] L. Guo, K. Yedavalli, D. Zinger, Energy Convers. Manag. 52 (2011) 1406e1413. [10] D.J. Schroeder, P. Majumdar, Int. J. Hydrogen Energy 35 (2010) 11308e11314.
[11] A.S. Martinez, J. Brouwer, G.S. Samuelsen, J. Power Sources 213 (2012) 203e
217.
[12] A.S. Martinez, J. Brouwer, G.S. Samuelsen, J. Power Sources 213 (2012) 358e
374.
[13] A.R. Miller, T.L. Erickson, J.L. Dippo, R.I. Eisele, M.D. Johnson, T. Lambrecht, in:
9th World Congress on Railway Research (WCRR), Lille, 2011.
[14] J. Kawasaki, S. Takeda, R. Furuta, Jpn. Railw. Eng. 160 (2008) 6e8.
[15] T. Yamamoto, H. Hasegawa, T. Furuya, K. Ogawa, Q. Rep. RTRI 51 (2010) 115e
121.
[16] W. Chen, in: 8th International Hydrail Conference, Toronto, 2013.
[17] A.R. Miller, M.D. Johnson, K.S. Hess, T.L. Erickson, J.L. Dippo, T. Lambrecht, in: The Fuel Cell Seminar, Palm, Springs, CA, 2009.
[18] Railway Gazette International, Hydrogen Fuel Cell Tram Unveiled, Sutton, 2011. Retrieved from, http://www.railwaygazette.com/news/single-view/
view/hydrogen-fuel-cell-tram-unveiled/archiv/2011/10.html.
[19] A.R. Miller, A. Hoffrichter, S. Hillmansen, C. Roberts, in: 19th World Hydrogen
Energy Conference 2012, Toronto, 2012.
[20] TIG/m Modern Street Railways, TIGm Modern Street Railways Sends World’s
Greenest Streetcars to Aruba Toward 100% Sustainability, 2012. Chatsworth, CA.
[21] ReliOn, E-1100TM Fuel Cell System: Operator’s Manual, ReliOn, Spokane, WA,
2011.
[22] Tayna Ltd, EXV90 Enduroline Calcim Leisure Battery 90Ah, Tayna Batteries,
Abergele, 2013.
[23] Lynch Motor Company, LMC Motors: LEM-130, Lynch Motor Company,
Honiton, 2013.
[24] W.J. Davis, Gen. Electric Rev. 29 (1926) 685e707.
[25] B.P. Rochard, F. Schmid, Proc. Inst. Mech. Eng. Part F 214 (2000) 185e199. [26] UIC, Evaluation of Energy Efficiency Technologies for Rolling Stock and Train
Operation of Railways (EVENT), 2003. Paris.
[27] S. Lu, S. Hillmansen, C. Roberts, IEEE Trans. Veh. Technol. 60 (2011) 406e420. [28] R. Cousineau, Instrum. Meas. Mag. IEEE 9 (2006) 25e29.
[29] N. Shiraki, H. Satou, S. Arai, in: 2010 International Power Electronics Confer-ence (IPEC), 2010, pp. 2853e2858.