University of Warwick institutional repository: http://go.warwick.ac.uk/wrap
A Thesis Submitted for the Degree of PhD at the University of Warwick
http://go.warwick.ac.uk/wrap/57266
This thesis is made available online and is protected by original copyright.
Please scroll down to view the document itself.
Library Declaration and Deposit Agreement
1. STUDENT DETAILS Please complete the following:
Full name: ….……… Emma Louise Wright ...………. University ID number: ………0859654………
2. THESIS DEPOSIT
2.1 I understand that under my registration at the University, I am required to deposit my thesis with the University in BOTH hard copy and in digital format. The digital version should normally be saved as a single pdf file.
2.2 The hard copy will be housed in the University Library. The digital version will be
deposited in the University’s Institutional Repository (WRAP). Unless otherwise indicated (see 2.3 below) this will be made openly accessible on the Internet and will be supplied to the British Library to be made available online via its Electronic Theses Online Service (EThOS) service.
[At present, theses submitted for a Master’s degree by Research (MA, MSc, LLM, MS or MMedSci) are not being deposited in WRAP and not being made available via EthOS. This may change in future.]
2.3 In exceptional circumstances, the Chair of the Board of Graduate Studies may grant permission for an embargo to be placed on public access to the hard copy thesis for a limited period. It is also possible to apply separately for an embargo on the digital version. (Further information is available in the Guide to Examinations for Higher Degrees by Research.)
2.4 If you are depositing a thesis for a Master’s degree by Research, please complete section (a) below. For all other research degrees, please complete both sections (a) and (b) below:
(a) Hard Copy
I hereby deposit a hard copy of my thesis in the University Library to be made publicly available to readers immediately as agreed by the Chair of the Board of Graduate Studies.
I agree that my thesis may be photocopied. YES
(b) Digital Copy
I hereby deposit a digital copy of my thesis to be held in WRAP and made available via EThOS. My thesis can be made publicly available online. YES
3. GRANTING OF NON-EXCLUSIVE RIGHTS
Whether I deposit my Work personally or through an assistant or other agent, I agree to the following:
4. DECLARATIONS
(a) I DECLARE THAT:
I am the author and owner of the copyright in the thesis and/or I have the authority of the authors and owners of the copyright in the thesis to make this agreement.
Reproduction of any part of this thesis for teaching or in academic or other forms of publication is subject to the normal limitations on the use of copyrighted materials and to the proper and full acknowledgement of its source.
The digital version of the thesis I am supplying is the same version as the final, hard- bound copy submitted in completion of my degree, once any minor corrections have been completed.
I have exercised reasonable care to ensure that the thesis is original, and does not to the best of my knowledge break any UK law or other Intellectual Property Right, or contain any confidential material.
I understand that, through the medium of the Internet, files will be available to automated agents, and may be searched and copied by, for example, text mining and plagiarism detection software.
(b) IF I HAVE AGREED (in Section 2 above) TO MAKE MY THESIS PUBLICLY AVAILABLE DIGITALLY, I ALSO DECLARE THAT:
I grant the University of Warwick and the British Library a licence to make available on the Internet the thesis in digitised format through the Institutional Repository and through the British Library via the EThOS service.
If my thesis does include any substantial subsidiary material owned by third-party copyright holders, I have sought and obtained permission to include it in any version of my thesis available in digital format and that this permission encompasses the rights that I have granted to the University of Warwick and to the British Library.
5. LEGAL INFRINGEMENTS
I understand that neither the University of Warwick nor the British Library have any obligation to take legal action on behalf of myself, or other rights holders, in the event of infringement of intellectual property rights, breach of contract or of any other right, in the thesis.
Please sign this agreement and return it to the Graduate School Office when you submit your thesis.
Student’s signature: ... ... Date: ...28/02/13...
The effect of pathogens on honeybee
learning and foraging behaviour
By
Emma Wright
A thesis submitted for the degree of Doctor of Philosophy
University of Warwick, School of Life Sciences
And
Rothamsted Research
I
Table of Contents
Table of Contents ... I List of figures ... V List of tables ... X Acknowledgements: ... XIII Declaration: ... XIV Abstract ... XV Abbreviations ... XVI
Chapter 1: General introduction ... 1
1.1 Bees: ... 1
1.1.1 Taxonomy:... 1
1.1.2 The Colony: ... 1
1.1.3: The Queen:... 2
1.1.4 The Workers: ... 5
1.1.5 The Drones: ... 8
1.1.6 Economic value: ... 8
1.2 Colony losses: ... 8
1.3 Honeybee pathogens and parasites: ... 11
1.3.1 Bacteria: ... 11
1.3.2 Fungi: ... 11
1.3.3 Protozoa: ... 12
1.3.4 Parasitic mites: ... 12
1.3.4.1 Tracheal mites (Acarapis woodi): ... 12
1.3.4.2 Varroa destructor: ... 13
1.3.5 Viruses: ... 15
1.3.5.1 Chronic Bee Paralysis Virus; CBPV: ... 17
1.3.5.2 Acute Bee Paralysis Virus; ABPV:... 17
1.3.5.3 Black Queen Cell Virus; BQCV: ... 18
1.3.5.4 Deformed Wing Virus; DWV: ... 18
1.3.5.5 Kashmir Bee Virus; KBV: ... 20
1.3.5.6 Sacbrood Virus; SBV: ... 20
1.3.5.7 Israeli Acute Paralysis Virus; IAPV: ... 21
1.3.6 Nosema disease: ... 22
1.4 Effects of pathogens on hosts: ... 24
1.4.1 Immune response: ... 24
1.4.2 Behavioural responses: ... 25
1.4.2.1 Adaptive responses: ... 25
1.4.2.1.1 Behavioural fever: ... 25
II
1.4.2.1.3 ‘Suicide hypothesis’: ... 27
1.4.2.1.4 Hygienic behaviour:... 27
1.4.2.2 Host manipulation and deleterious behavioural changes: ... 28
1.4.2.2.1 Free flying choice experiments: ... 28
1.4.2.2.2 Nest orientation: ... 29
1.4.2.2.3 Pollination efficiency: ... 29
1.5 Molecular detection and quantification methods: ... 30
1.5.1 PCR & electrophoresis: ... 30
1.5.2 QPCR: ... 32
1.6 Aims: ... 36
Chapter 2: General Methods ... 38
2.1 Maintaining bees in the lab: ... 38
2.2 Collecting bees for experiments: ... 39
2.2.1 Young adult bees: ... 39
2.2.2 Forager bees: ... 39
2.3 Maintaining an in vitro M. anisopliae culture ... 39
2.4 Collecting M. anisopliae spores ... 40
2.5 Inoculation of bees with M. anisopliae conidia... 41
2.6 Parasite and pathogen detection: ... 42
2.6.1 PCR-based analysis of pooled bee samples: ... 42
2.6.2 Quantification of pathogens in bees by quantitative reverse transcription–PCR (Q-RT-PCR): ... 45
Chapter 3: Characterisation of the germination and radial growth of
the fungus Metarhizium anisopliae and the effect of fungal infection
and forage availability on honeybee survival. ... 48
3.1 Introduction ... 48
3.1.1: Use of the fungus Metarhizium anisopliae for biological control and as a model system: ... 48
3.1.2: Experimental setup and hypotheses: ... 50
3.2 Methods: ... 52
3.2.1 Experiments to quantify conidia germination and colony growth of Metarhizium anisopliae at different temperatures: ... 52
3.2.1.1 Experiment to determine the germination rate of populations of conidia of Metarhizium anisopliae at different temperatures: ... 53
3.2.1.2 Experiment to determine the rate of colony growth of Metarhizium anisopliae at different temperatures: ... 55
3.2.2 Multiple dose bioassay to determine the concentration of M. anisopliae for use in subsequent experiments: ... 55
III
3.2.4 Experiment to determine the effect of pathogen load, forage availability during development, and pollen availability as adults, on the longevity and survival of
honeybees: ... 59
3.3 Results: ... 60
3.3.1 Experiments to determine germination rate of Metarhizium anisopliae at different temperatures:... 60
3.3.1 Experiments to determine colony growth of Metarhizium anisopliae at different temperatures:... 62
3.2.2 Multiple dose bioassay to determine the concentration of M. anisopliae to use in experiments: ... 63
3.2.3 Experiment to determine the effect of background pathogen load and forage availability on the longevity and survival of honeybees when challenged with the fungal pathogen M. anisopliae: ... 64
3.3.4 Experiment to determine the effect of pathogen load and forage availability during development and pollen availability as adults on the longevity and survival of honeybees: ... 68
3.4 Discussion: ... 70
Chapter 4: The effect of pathogens on honeybee learning and
sucrose sensitivity... 75
4.1 Introduction ... 75
4.1.1 Behavioural effects of pathogens and parasites on honeybees: ... 75
4.1.2 Conditioned Proboscis Extension (CPE): ... 77
4.2 Methods ... 79
4.2.1 General methods for CPE: ... 79
4.2.2 Testing for differences in learning behaviour in young adult bees over the course of infection with M. anisopliae: ... 81
4.2.3 Testing for differences in learning behaviour in young adult and forager bees infected with M. anisopliae: ... 82
4.2.4 Testing for differences in learning behaviour of pollen starved forager bees infected with M. anisopliae: ... 84
4.2.5 Testing for differences in sucrose sensitivity in young adult bees infected with M. anisopliae: ... 85
4.3 Results: ... 86
4.3.1 Testing for differences in learning behaviour in young adult bees over the course of infection with M. anisopliae: ... 86
4.3.2 Testing for differences in learning behaviour in young adult and forager bees infected with M. anisopliae: ... 87
4.3.3 Learning behaviour of pollen-starved forager bees infected with M. anisopliae: . 91 4.3.4 Sucrose sensitivity in young adult bees inoculated with M. anisopliae: ... 92
4.4 Discussion: ... 94
Chapter 5: The effect of disease load on the orientation flights of
honeybees. ... 100
5.1 Introduction ... 100
5.1.2 Effect of pathogens on honeybee flight: ... 102
IV
5.1.4 Experimental background and hypotheses: ... 103
5.2 Methods ... 104
5.2.1 Experimental setup: ... 104
5.2.2 Attaching the transponders to the bees: ... 107
5.2.3 Molecular analysis: ... 107
5.2.4 Track analysis: ... 107
5.2.5: Statistical analysis:... 108
5.2.5.1: Chi Square analysis of flight types: ... 109
5.2.5.2: Mann-Whitney U tests on flight parameters:... 109
5.2.5.3: Simple linear regression analysis on flight parameters: ... 109
5.3 Results ... 109
5.3.1: Radar summary: ... 109
5.3.2: Disease loads: ... 110
5.3.3: Chi square analysis of flight types: ... 111
5.3.4: Mann-Whitney U test on flight parameters: ... 112
5.3.5: Simple linear regression analysis on flight parameters: ... 114
5.4 Discussion ... 116
Chapter 6: In-hive behaviour and time to first forage for honeybees
from colonies of differing disease status in observation hives. ... 119
6.1 Introduction ... 119
6.1.1: Use of observation hives to study honeybee in-hive behaviour: ... 119
6.1.2: Division of labour in bees: ... 120
6.1.3: Effect of bee diseases on honeybee in-hive behaviour and polyethism: ... 121
6.1.4: Experimental setup and hypotheses: ... 122
6.2 Methods ... 123
6.2.1: Observation hive set up: ... 123
6.2.2: Monitoring of behaviour within the observation hives: ... 126
6.2.3 Statistical analysis of results: ... 128
6.2.3.1 Survival analysis: ... 128
6.2.3.2 Time to first forage: ... 128
6.2.3.3 Behavioural analysis: ... 128
6.3 Results ... 130
6.3.1 Survival results: ... 130
6.3.2 Time to first forage: ... 132
6.3.3 Behavioural analysis: ... 133
6.4 Discussion: ... 137
Chapter 7: General Discussion ... 144
References ... 152
V
List of figures
Figure 1.1 Figure taken from Karl von Frisch’s 1973 Nobel lecture showing the 2 forms of dance used by foraging bees to transmit
information to other workers. From Nobel Lectures, Physiology or Medicine 1971-1980, Editor Jan Lindsten, World Scientific
Publishing Co., Singapore, 1992 7
Figure 1.2 The annual number of hives reported to the FAO in western European countries (the former 15 EU member states, black circles) and the former Warsaw Pact countries in Eastern Europe (including the former USSR, open circles). The dramatic decline in Europe coincides with the political system changes in the in Eastern Europe, whereas the introduction of V. destructor
had no perceptible impact on the number of hives reported. 10
Figure 1.3 A bee with deformed wings caused by DWV. Image taken by
Graham Shephard, Rothamsted VCU. 19
Figure 1.4 Light microscope images of Nosema caranae (Left) and
Nosema apis (right) at x400 with a single spore shown at x1000 magnification taken from Bee Craft January 2008 Page 7: Nosema ceranae. Giles Budge, National Bee Unit, Central Science
Laboratory, York. 23
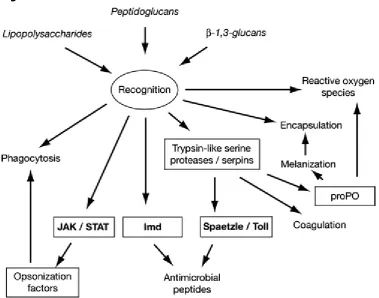
Figure 1.5 Typical responses of the insect immune defense after different antigens (lipopolysaccharides, peptidoglucans, and β-1,3-glucans) have been recognized (oval). Rectangles denote major receptors and signaling pathways. Image taken from
(Schmid-Hempel, 2005). 24
Figure 1.6 Sample gel: results for BQCV in 10 honeybee colonies at Rothamsted Research. The ladders are in the first and last well, the positive control is in the second well with the negative control (no band) next followed by each numbered colony. Colonies 4, 15, 21, 54, 132, 135 and 140 tested positive (bands) colonies 63 and 67 tested negative (no bands). All the bands have travelled the same distance meaning that the PCR fragments are the same size,
in this case 294 base pairs. 31
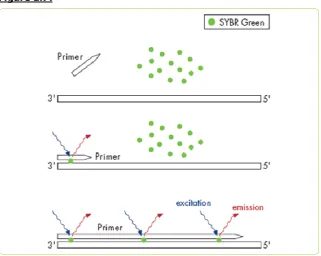
Figure 1.7 SYBR Green is a dye that binds to any dsDNA. Image taken from
ww1.quiagen.com. 33
Figure 1.8 Figure taken from (Wilhelm and Pingoud, 2003). a) Shows the decrease in fluorescence as the reaction is heated for both a positive and negative control. b) Shows the change in fluorescence at each temperature, melting curves. The peak for the positive control occurs at 87.5oC, this is the T
m of the specific PCR product. 34
Figure 1.9 Figure showing repeated QPCR results for a dilution series on an arithmetic scale. The graph shows change in fluorescence over time for 3 technical replicates of 8 samples following a dilution series. The curves nearest the y axis have fluorescence increasing in the earliest cycles because they had the highest concentration of target sequence. Plot taken from New England Biolabs
VI
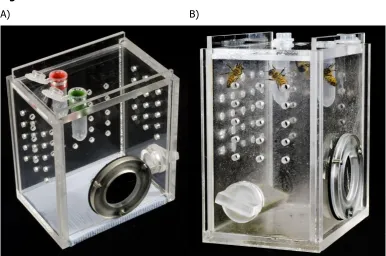
Figure 2.1 The bioassay cages used for maintaining bees in the lab (Rothamsted VCU: Graham Shephard 2010). A) an empty box with colour coded gravity feeders (red for water, green for 60% sucrose solution). B) Bees inside a box. 38
Figure 2.2 Metarhizium anisopliae grown on SDA for 14 days at 23oC in
darkness. 40
Figure 2.3 Typical PCR gel showing presence/absence of honeybee pathogen in pooled bee samples. This gel showed the BQCV results for 10 colonies. The virus was present in colonies 6, 15, 21, 54, 132, 135 & 140 and absent in colonies 63, 67 & 74. 45
Figure 2.4 Melting curves for 1 plate of samples. The mostly blue/green/purple curves are the curves for the N apis positive samples and all the samples of this plate which tested positive for N. apis. The mostly yellow/pink/orange curves are the -actin positive samples and all samples tested for -actin. This curve has a shoulder (a second smaller peak on the left) which is likely produced by left over primers. There is one green curve at ~83.5oC (between the two
sets of curves) this is a negative result, the curve is probable
produced by left over primers. 47
Figure 3.1 Graph showing the mean logit proportion of conidia that had germinated for M. anisopliae (445.99) when grown on SDA and bees wings. The germination rate was highest on bee wings. The error bars show the standard error of the mean (SEM) for this
data. 60
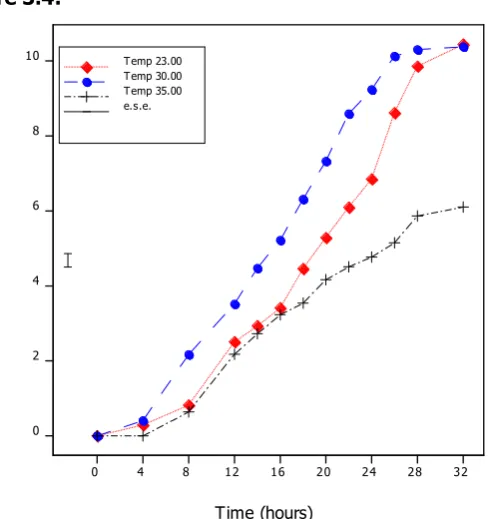
Figure 3.2 Graph showing the mean logit proportion of conidia that had germinated over time for M. anisopliae (445.99). The germination rate was highest at 30oC. At 35oC 100% germination was not
achieved within the time of the experiment (36 hours). The error bar is the average SEM for the data. 61
Figure 3.3 Graph showing the square root of the mean germ tube length for M. anisopliae (445.99) when grown on SDA and bees wings. The germ tubes grew best on agar. The error bars show the SEM for
this data. 62
Figure 3.4 Graph showing the square root of the length of germ tube growth over time for M. anisopliae (445.99) incubated at 3 temperatures. The germination length grew fastest at 30oC and slowest at 35oC.
The error bar shows and average SEM for the data set. 62
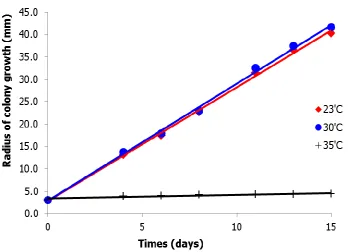
Figure 3.5 Colony growth of the fungus M. anisopliae recorded over a fifteen day period. There was a significant reduction in growth at 35oC
compared to 23 and 30oC. 63
VII
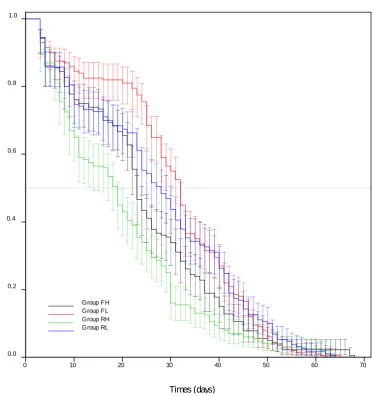
Figure 3.7 Kaplan-Meier plot showing survival of bees from colonies that were allowed to forage freely (F) or were restricted (R) in their foraging and with high (H) or low (L) varroa loads. The best survival was seen in bees from FL (Free forage, low varroa) colonies and the worst in RH (Restricted forage, high varroa) colonies. (FH N = 180, FL N = 200, RH N = 200, RL N = 190). 66
Figure 3.8 Kaplan-Meier plot showing survival of M. anisopliae infected bees from colonies who were allowed to forage freely (F) or were restricted (R) in their foraging and with high (H) or low (L) varroa loads. The best survival was seen in bees from RH (Restricted forage, high varroa) and FL (Free forage, low varroa) colonies, and the worst in RL (Restricted forage, low varroa) and FH (Free forage, high varroa) colonies. (FH N = 180, FL N = 200,
RH N = 200, RL N = 190). 67
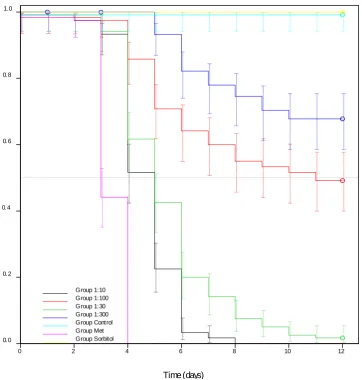
Figure 3.9 Kaplan-Meier plot showing survival of bees with (P) and without (N) pollen, from colonies who were allowed to forage freely (F) or were restricted (R) in their foraging and with high (H) or low (L) varroa loads. This plot shows the lowest and highest challenged colonies, bees from high varroa, restricted forage colonies and bees from low varroa, free foraging colonies. (FLP, N=60. FLN, N=60. FHP, N=100. FHN, N=100. RLP, N=80. RLN, N=80. RFP,
N=100. RHN, N=100). 69
Figure 4.1 A bee secured for CPE experimentation. The bee is secured in such a way that the antennae are free and it can extend its proboscis. It is held in a glass tube by a band of electrical tape (yellow) and by thinner tape (lining tape) to hold its head in place (grey). 80
Figure 4.2 Learning ability of young adult bees infected with M. anisopliae at 2, 4, and 6 days after inoculation. The proportion of bees that learnt the CPE response is shown for each of the six training trials except the first in which no bees responded to the odour stimulus. Open shapes and dotted trend lines are M. anisopliae inoculated bees, filled shapes and continuous trend lines are sham (sorbitol)
inoculated bees. 87
Figure 4.3 Learning ability of forager and young adult bees infected with the fungus M. anisopliae 4 days after inoculation. Open shapes and dotted trend lines are M. anisopliae inoculated bees, filled shapes and continuous trend lines are sham (sorbitol) inoculated bees. 88
Figure 4.4 Canonical variance analysis including presence or absence of BQCV, SBV, N. apis & N. ceranae, age and whether the bees had learned the association in the sixth and final trial. 89
Figure 4.5 Biplot from the canonical variance analysis including presence or absence of BQCV, SBV, N. apis & N. ceranae, age and whether the bees had learned the association in the sixth and final trial. 90
Figure 4.6 Histogram showing the distribution of relative DWV load within the bees from experiment 4.2.3. 91
VIII
inoculation on learning ability in this experiment. 92
Figure 4.8 Graph showing proportion of bees responding to each sucrose concentration. Metarhizium anisopliae infected bees (dotted lines, open shapes) were significantly more likely to respond to lower sucrose concentrations than uninfected bees (solid lines, filled shapes). Bees tested 2 days after inoculation (black) were significantly less likely to respond to lower concentrations of sucrose than those tested 4 (blue) and 6 (red) days after
inoculation. 93
Figure 5.1 The experimental set up. A) Map of Rothamsted farm (Black boxes are farm buildings). The position of the radar is shown as a red circle; the positions of the hives used in the experiment are shown as blue circles. Potential forage at the time of the experiment (oilseed rape fields, bean fields and wild flowers) are shown in yellow. B) The harmonic radar dishes. C) The external view of experimental hive V125. A second tunnel opens into the mesh
pollination cage. 105
Figure 5.2 Typical flight track produced in this experiment. Track of bee H132-14, a bee which tested negative for BQCV, had low DWV load and relatively low levels of n. apis and N. ceranae. This bee shows a looping flight pattern as it explores the landscape. The range lines are 100m apart. The red lines connect concentric points, if there was a gap, even of only one rotation, the points are connected by green lines. 110
Figure 5.3 Box plots showing the effect of DWV load (high/low) on flight distance (a) and duration (b) and BQCV (presence/absence) on speed (c). Bees with high DWV flew for shorter distances and
times and bees infected with BQCV flew faster. 113
Figure 5.4 Plots showing relationship between disease load relative to actin and flight analysis. For all plots a relative disease load of 20 is a negative result, and lower values are higher disease loads. Bees with higher N. apis loads tended to fly faster (a) than bees with lower N apis loads. Bees with higher BQCV loads tended to fly faster (b) and stop less often (c) than bees with lower BQCV loads. Bees with higher DWV loads tended to have shorter flights in terms of distance (d) and duration (e) than bees with low DWV
loads. 114-115
Figure 6.1 One of the observation hives at the Rothamsted Bee Field Lab. Each section is 460 x 227 x 45mm. 124
Figure 6.2 The tunnel of the observation hive with the feeder attached. The feeder has a honey jar which can be filled with sucrose solution. The bees can get to the sucrose via a gauzed hole. 124
Figure 6.3 Figure showing the orientation of marking tags on the bees for run 2 of the observation hive experiment. A: bees added to observation hive A with the tags readable when the bee’s head is down.
B: bees added to observation hive B with the tags readable when the bee’s head is up. Both bees are shown with the
IX
Figure 6.4 Figure showing the proportion of bees, from all treatments, resting over time for the observation hive experiment. The
number of bees recorded in this experiment decreased over time. 129
Figure 6.5 Kaplan Meier plot of survival for each treatment of bees in the observation hives. For most of the experiment there is no significant difference in the CIs for each treatment, however, between 20-30 days the DWV only bees and the bees from colonies with all three diseases differ significantly such that the DWV bees survive better than those from colonies with all three
diseases. 130
Figure 6.6 Graph showing LT50s calculated from the Kaplan Meier results for each group of 95 bees from colonies with 1 (DWV), 2 (DWV and Nosema sp. ) or 3 (DWV, Nosema sp. and BQCV) diseases. 1 and 2 for each treatment went into observation hive A and 2 and 3
went into observation hive B. 132
Figure 6.7 Graph showing the average time to first forage against number of diseases in the source colonies. The error bars show the standard error of the mean (SEM) for these data. 133
Figure 6.8 Barycentric triangle plots showing the proportion of bees resting, cleaning or doing other activities over time (20 days) for each
treatment in each observation hive. 134
Figure 6.9 Plot of proportion of bees resting over time for the first 20 days of the observation hive experiment. Black spots are bees from colonies with one disease (DWV), red spots are bees from colonies with two diseases (DWV & Nosema sp.) and blue spots are bees from colonies with all three diseases (DWV, Nosema sp. and BQCV). The fitted mixed model is shown as the black line; this was found To be the same for all disease treatments. 135
Figure 6.10 Graph of rainfall data for Rothamsted farm from over the first 20 days of the observation hive experiment. All values were recorded from 0900-0900 the following day. 136
Figure 6.11 Plot of proportion of bees interacting with other bees over time for the first 20 days of the observation hive experiment. Black spots are bees from colonies with one disease (DWV), red spots are bees from colonies with two diseases (DWV & Nosema sp.) and blue spots are bees from colonies with all three diseases (DWV, Nosema sp. and BQCV). The fitted mixed model is shown as the black line; this was found to be the same for all disease
X
List of tables
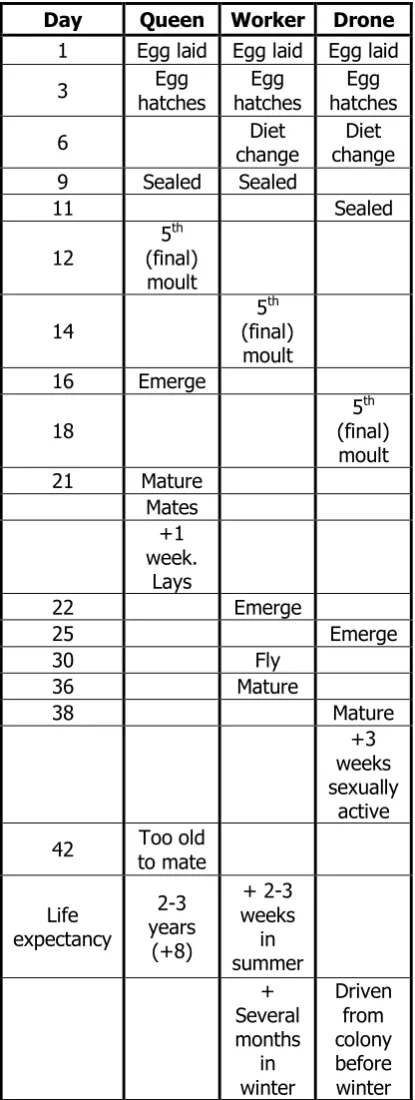
Table 1.1 Table showing honey bee early development adapted from
(Waring, 2006 p20). 4
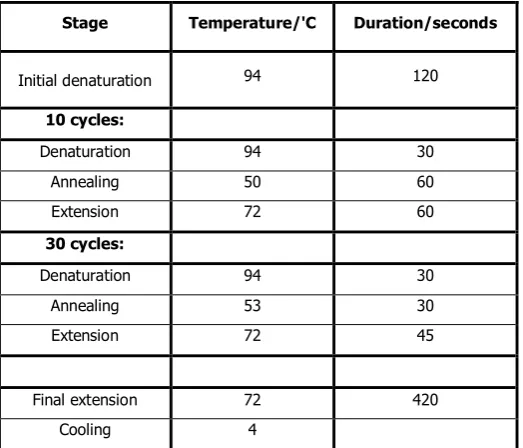
Table 2.1 Table showing the thermocycler routine used for all PCR reactions in this project. The protocol was optimised by Dr Ryabov,
University of Warwick. 43
Table 2.2 Table showing the primers used for PCR and QPCR analysis. The primers are also shown for -actin which was used as a
housekeeping gene for QPCR analysis (see section 2.6.2). 44
Table 2.3 Table showing the routine used for all QPCR reactions in this
project. 46
Table 3.1 Treatments established for the project BB/H00114X/1 summer 2011 field experiment. Twenty colonies were set up, one of each treatment at each of five field sites. 54
Table 3.2 Table showing set up and recording times for the germination experiments. One plate of each type (SDA or tap water agar with bee wings) was set up at each temperature (23, 30 & 35oC) for
each recording time. The experiment was repeated on 3
occasions. 57
Table 3.3 Table showing the varroa counts for different treatments of colonies used in the survival experiments which took place between July and September 2011. FL (free forage, low disease) and RL (restricted forage, low disease) colonies have lower average varroa numbers by both counting methods than FH (free forage, high disease) and RH (restricted forage, high disease)
colonies. 65
Table 3.4 Table of LT50s (time until half the bees were dead) for each treatment when not inoculated with fungus. The bees from the colonies with restricted forage and high varroa loads had a significantly shorter LT50 (died significantly earlier) than any other
treatment. 66
Table 3.5 Table of LT50s (time until half the bees were dead) for each treatment when inoculated with the fungus M. anisopliae. The bees from the colonies with free forage and high varroa has significantly shorter LT50s than the bees from the restricted forage colonies who in turn had significantly shorter LT50s than the bees from the colonies with free forage and low varroa. 68
Table 3.6 Table of LT50s (time until half the bees were dead) for the low and high challenge colonies when fed or deprived of pollen. The low challenge colonies bees had the longest LT50 and the high
challenge colonies bees had the shortest. When bees from the low challenge colonies were deprived of pollen or bees from the high challenge colonies were fed pollen their LT50s were not significantly
XI
Table 4.1 Table showing the experimental design employed to examine changes in learning ability of honeybees over the course of infection
with M. anisopliae. 82
Table 4.2 Table showing the experimental design employed to examine differences in learning behaviour in young adult and forager bees after infection with M. anisopliae. 83
Table 4.3 Table showing experimental design employed to test changes in learning ability after infection with M. anisopliae in pollen-starved
bees. 84
Table 4.4 Table showing timings for the sucrose sensitivity experiment. 86
Table 4.5 Summary of PCR analysis. 128 bees from experiment 4.2.2 were analysed using RT-PCR based detection to identify the viral diseases and Nosema spp. present. Five diseases were detected, the viruses BQCV, DWV & SBV and both N. apis and N. ceranae. A few samples were inconclusive. 89
Table 4.6 Table showing REML analysis combining molecular and behavioural data for bees whose learning behaviour was tested after infection with the fungus M anisopliae. The relationships amongst each pathogen, the learning behaviour and the age of the bee were analysed. The only significant effects were on age (for DWV and BQCV) and the interaction between age and learning (for DWV
and N. apis). 91
Table 5.1 Table showing the flight parameters calculated from the radar
track data. 108
Table 5.2 Table of disease presence for bees tracked using the harmonic radar. DWV results are given as high (relative DWV load <-4) and low (relative DWV load >-4), all other diseases (BQCV, N. apis (Na) and N. ceranae (Nc)) are shown as presence (+)/absence(-). Inconclusive results are shown as ‘ * ’. 56 bees were tested in
total. 111
Table 5.3 Table showing the number of bees with low/ high DWV load for
each flight type. 111
Table 5.4 Table showing the number of bees tested positive/ negative for
BQCV for each flight type. 112
Table 6.1 Table showing the set up for both runs of the observation hive experiment to monitor the in hive and foraging behaviour of bees from colonies of differing disease statuses. 125
Table 6.2 Table showing a list of behaviours recorded in the observation hive
experiment. 127
Table 6.3 Table showing meteorological data for Rothamsted farm from 4th-7th
XII
Table 6.4 Table showing survival time results for observation hive
experiments. 137
Table 6.4 Table showing time to first forage results for observation hive
XIII
Acknowledgements:
I would like to take this opportunity to thank all of my supervisors for all their help and support and general enthusiasm over the last four years. Judy Pell for correcting my
atrocious spelling and grammatical errors. Juliet Osborne for pointing out the obvious things I’d completely missed. And Dave Chandler for noticing that I got bored half way through the discussion to chapter three and then sending me hundreds of useful references to fix it!
There are so many other people at Rothamsted who helped me throughout my PhD there is no way I can mention them all, but I would to thank Suzanne Clarke, without whom there would be no good stats. Pam, Angela and Eleri, thanks for helping me out with so many things! And thanks to Jenny Jacobs and Mathilde Briens (then of Inscentinel) for showing me how to make bees stick their tongues out!
The primers and positive material for all the RT-PCR and Q-RT-PCR analysis came from Joachim De Miranda and Eugene Ryabov. Eugene also taught me how to actually do PCR, and both Joachim and Giles Budge (National Bee Unit) gave me advice thank you all.
A big thank you to Gill Prince and Sally Hilton at Warwick for making me feel at home every time I went up there. Without you I never would have found anything!
Thank you to everyone in the bee group, especially Jenny Swain who spent an inordinate amount of time driving me to collect bees and sitting in a field waiting for the radar bees to return. But also Pete Kennedy, Matthias Becher, Stephan Wolf and Alison Haughton for the lively bee group meetings. Also thank you to Andrew Martin and Pete Tompkins (Tomo).
Thanks to all the students who made the last four years so much fun, especially Becky Nesbit, Nichola Hawkins and Trish Wells for blogging and videos and so many cakes! Sam Gorny for moving my snails and cooking the best roast dinners ever. Nina Stanczyk for eeing over firefly. Jon Carruthers and Hayley Jones for making me feel like I knew things
occasionally. And James Cook for reminding me that sometimes I can be very blond (how do you spell EIEIO?).
Finally, and possibly most importantly, thank you to Trish Wells, Martin Torrance and Jason Baverstock for letting me be part of the best group at Rothamsted (BEEF: PIE)! Without you all I probably would have gone just as crazy as Trish did last year! Also thank you for putting up with the snails and stick insects!
XIV
Declaration:
XV
Abstract
The European honeybee, Apis mellifera, is important economically not just for honey production but also as a pollinator. Bee pollinated plants contribute towards one third of the food eaten worldwide. However, honeybee numbers in some areas are declining. A range of interacting factors are thought to be involved, including pathogens and parasites, loss of forage, pesticide use, bad weather, and limited genetic variability. Pathogens are also known to cause changes in the behaviour of their hosts and these premortality and
sublethal effects of disease may well play a role in colony declines and are the focus of this thesis.
For individual bees the fungus Metarhizium anisopliae was used as a model pathogen and RT-Q-PCR was used to detect and quantify naturally occurring pathogens. In field colonies the level of infestation of the parasitic mite Varroa destructor was modified as a surrogate for disease load as the amounts of many viruses correlate with mite levels.
Survival experiments showed that both disease load and forage availability had an effect on honeybee longevity and feeding the bees pollen increased their survival. Learning
experiments showed that both the fungus and some of the bees’ naturally occurring pathogens caused changes in the learning ability of young adult and older forager bees. Young adult bees were better able to learn when infected with the fungus, possibly because it made them more responsive to the sucrose stimulus, whilst older forager bees where less able to learn when infected with the fungus. Harmonic radar was used to show that
XVI
Abbreviations
ABPV Acute Bee Paralysis Virus AFB American foul brood ANOVA ANalysis Of VAriance BQCV Black Queen Cell Virus CBPV Chronic Bee Paralysis Virus CCD Colony Collapse Disorder CI Confidence Interval
CPE Conditioned Proboscis Extension CSD allele Complementary Sex Determining allele Ct Cycle Threshold
DEFRA Department for Environment and Rural Affairs DWV Deformed Ring Virus
EFB European Foul Brood
FERA Food and Environment Research Agency FRET Fluorescence Resonance Energy Transfer IAPV Israeli Acute Paralysis Virus
IPA Industrial Partnership Award JH Juvenile Hormone
KBV Kashmir Bee Virus LPS LipoPolySaccharides LT50 Lethal Time 50
NASS National Agricultural Statistics Service NBU National Bee Unit
PER Proboscis Extension Reflex PO Phenyloxidase
REML REstricted (residual or reduced) Maximum Likelihood SBV Sac Brood Virus
SDA Sabouraud Dextrose Agar
1
Chapter 1: General introduction
1.1 Bees:
1.1.1 Taxonomy:
Bees belong to the order Hymenoptera and honey bees to the family Apidae. The species most commonly used for honey production in Europe is the European Honeybee; Apis mellifera, the name coming from the Latin meaning ‘honey bearing bee’ (Linnaeus, 1758). There are several subspecies of A. mellifera including: A.m. iberica, A.m. mellifera (native to Britain), A.m. carnica (the Carniolan honeybee) and A.m. scutellata (the African subspecies used to breed Africanized honeybees). Due to its nature and honey production an Italian subspecies ‘ligustica’ is currently most favoured although other subspecies are sometimes used. This species was chosen because it is generally a good housekeeper, prolific, a good forager, uses little propolis and shows less tendency to swarm than other subspecies (Hooper, 2008). The honeybee genome sequence was published in 2006 (Weinstock et al., 2006) making it a good model organism for linking experimental results to genetics. The honeybee has been used as a model system for studying immunity, allergic reaction, antibiotic resistance, development, mental health, longevity and diseases of the X chromosome (Reviewed in Dearden et al., 2010).
1.1.2 The Colony:
A typical honeybee colony can contain as many as 80 000 bees at the height of summer although this number decreases dramatically over winter when the bees over winter; relying on the warmth of a cluster of individuals to survive the cold weather. A minimum of about 10 000 bees is required to maintain the temperature required; if brood is present in the hive then the centre of the cluster must be 35oC whilst the edges may be only 6-7oC (Waring,
2006). In cool weather the temperature within the hive is increased by activating the thoracic muscles to produce heat. In hotter weather, however, the bees collect water which they fan with their wings to evaporate, thereby cooling the temperature of the hive (Tautz et al., 2003). Honey must be stored to fuel the colony which usually requires between 200-300 grams per week. 15-20kg of stored honey should last the colony not only through the cold weather but more importantly through the colony’s restart the following spring (Waring, 2006).
2
developing from unfertilised eggs and having only one copy of each chromosome. Sex determination is controlled by complementary sex determining (CSD) alleles. If these are inherited heterozygously a female is produced, if inherited homozygously (or singly as in the case of haploid males) the embryo develops to be male. Diploid males are produced if the queen mates with a male having the same CSD alleles as she does. These offspring do not survive to maturity (Charlesworth, 2008).
It was originally assumed that this haplo-diploidy favoured altruism within the colony. If the queen mates with one male drone then each worker is more closely related to her sister workers (75%) than any nephews (haploid drones produced by other workers) (35%). Hamilton’s equations (equations that can be used to predict the likelihood that a certain behaviour or attribute will evolve within a population based on the theory of inclusive fitness) (Hamilton, 1964) show that this close relatedness should favour the evolution of altruism. However, the queen mates with up to 20 different males and therefore workers are only likely to be 30% related to each other (Ratnieks and Wenseleers, 2008). However, workers in the colony continue to act altruistically leaving the queen as the only
reproductive female.
Ratnieks (2008) suggests that this is due to coercion rather than altruism. Using Hamilton’s equation (Hamilton, 1964) it can be shown that if the queen mates with ten males, then 54% of workers should theoretically benefit from reproducing. However the actual number reproducing is far lower than that, between 0.01 and 0.1%. The coercion in queen-right (ie a colony with an actively laying queen) honeybee colonies takes the form of queen
substance, a pheromone produced by the queen that, amongst other things, reduces the worker’s propensity to lay and encourages policing. Ratnieks (1993) examined a queen-right colony and found that, on average, one egg was laid by workers per day per 16000 drone cells. Of these 85% were removed within a day and only 2% hatched. In queenless colonies around 40% of workers lay, supporting the idea that it is coercion not altruism that
maintains the social structure of the colony (Ratnieks and Wenseleers, 2008).
1.1.3: The Queen:
3
into a queen. The queen takes about 16 days from laying to emergence and a week after that is mature enough to mate (table 1.1). The queen may fly one, two or three times and mate with up to 20 males storing their sperm in her spermatheca. The queen then remains in the colony for the rest of her life unless she swarms or is disturbed (Hooper, 2008).
The A. mellifera queen produces several pheromones. The pheromone produced by the queens mandibular gland, ‘queen substance’, prevents the workers from laying their own eggs (Butler et al., 1959). This ensures that every individual in the colony comes from the queen. At the height of summer this means a single queen may lay as many as 3000 eggs a day (Waring, 2006). Another of the queen’s pheromones encourages those workers near her to turn to face her. The surrounding workers will then feed, clean and generally care for all her needs allowing the queen’s attention to be focused solely on laying (Hooper, 2008). Queen bees have been known to live for up to eight years. These long-lived individuals usually run out of their stored sperm long before this however, and most queens are replaced after three to four years (Waring, 2006). This occurs when a virgin queen is raised to take over from the old queen. In most cases when virgin queens are ready to hatch the colony will swarm. The old queen leaves the hive with several thousand workers to set up a new colony. The hatching virgins can either take workers from the colony, if it is big enough, and swarm to set up a new hive themselves, or kill off any other emerging queens and take over the existing colony. If the old queen is superseded, however, one new virgin queen will emerge, go on her mating flight and return without the colony swarming. Any other queen larvae being raised at the time will either be killed by the emerging virgin queen or by the workers. The old queen usually leaves (or may be killed) but on some occasions the two queens may be seen laying together for some time. Thus the main difference between ‘supersedure’ and swarming is that no new colony is formed when the queen is superseded (Butler, 1957).
4 Table 1.1:
Day Queen Worker Drone 1 Egg laid Egg laid Egg laid 3 hatches Egg hatches Egg hatches Egg
6 change Diet change Diet 9 Sealed Sealed
11 Sealed
12 5
th
(final) moult
14 5
th
(final) moult 16 Emerge
18 5
th
(final) moult 21 Mature
Mates +1 week.
Lays
22 Emerge
25 Emerge
30 Fly
36 Mature
38 Mature
+3 weeks sexually
active 42 to mate Too old
Life expectancy 2-3 years (+8) + 2-3 weeks in summer + Several months in winter Driven from colony before winter
Table showing honey bee early development adapted from (Waring, 2006 p20).
5
there to be a significant female bias with on average 64% of reproductive offspring
produced being female. This is less than the 75% predicted if the workers are in full control but also more than the 50% predicted if the queen is in full control.
Once the larva reaches a certain size the cell is capped, i.e. sealed over with wax. The larva will continue to develop, eating stored food, until ready to pupate. At this point the larva orientates itself by finding the rough end of the cell so that its head is towards the capped end of the cell. The inside of the cell in polished smooth before eggs are laid so that when capped the capped end will be rough. (Hooper, 2008) The timetable for bee development is shown in table 1.1.
1.1.4 The Workers:
The worker caste are the smallest adults within the colony usually being less than 2cm in length. They have smooth mandibles and a long proboscis; on average 6.5mm. These morphological attributes enable the workers to carry out the ‘work’ of the colony (Waring, 2006). When a worker first emerges she will remain within the hive and carry out tasks there including the cleaning, trimming, capping and polishing of cells, storage of nectar and pollen, feeding larvae and drones and attending to the queen. Some of these young bees may act as undertakers, removing dead bees from the hive. They may also act as guards, stationed at the hive entrance. A guard bee will attack violently if approached by an
aggressor, for example by wasps or bees from other colonies attempting to gain entrance to the hive and its stores (robbing).
Sometimes, however, a worker bee from another colony may be confused and try to enter the wrong hive. In these cases the lost bee will not behave aggressively; it acts as if it has entered its own colony. In fact it acts submissively, offering the honey or nectar it carries and dropping its head. The guard bees mob the unfamiliar bee but are not particularly violent. Over time the continued mobbing leaves the lost bee smelling like the new colony and it can soon pass unharmed. The lost bee may now join this new colony. This process is called drifting (Hooper, 2008).
6
foragers. These bees collect the resources required by the colony including water, pollen and propolis. The propolis is made from resinous material taken from tree buds and is used as a sealant within the hive. Propolis also has antimicrobial activities. The honeybee hive is warm, humid and provides the perfect conditions for fungal and bacterial growth. Propolis is used to keep microbial growth under control (Silici et al., 2005). The foragers also collect nectar which will be turned into honey. The nectar is mostly comprised of sugars dissolved in water but the high water concentration of nectar (30-40%) means that it cannot be stored as bacteria and fungi would grow within it and contaminate it. If the water content is decreased, however, it can be stored. The bees achieve this by regulating the humidity within the hive by fanning which allows the water in the nectar to evaporate (Hooper, 2008). Honey therefore has a water content of 18% or less. In the UK it is illegal to sell honey containing more than 20% moisture (Waring, 2006). It has been found that the sugar concentration of the nectar is increased during foraging and the return flight to the nest. Nicolson et al., (2008) tested the concentration of nectar in honeybee crops and found that not only was this higher than the nectar from the plant itself but also that the concentration increased between leaving the flower and returning to the hive. It is thought that this is achieved by regurgitating the liquid onto the tongue to evaporate off some of the water (Nicolson and Human, 2008). Further evaporation occurs within the hive where the nectar droplet is placed at the top of the cell and fanned with the wings. The enzyme invertase is added to the nectar and converts the sucrose to fructose and glucose (Gordon, 1980). Ruizargueso et al., (1975) determined that there may be bacterial activity involved in the ripening of honey. They discovered the presence of Lactobacillus and Gluconobacter within samples of ripening honey. When added to sugar syrup, the bacteria produce lactone and change the pH of the syrup to an acidity similar to natural honey.
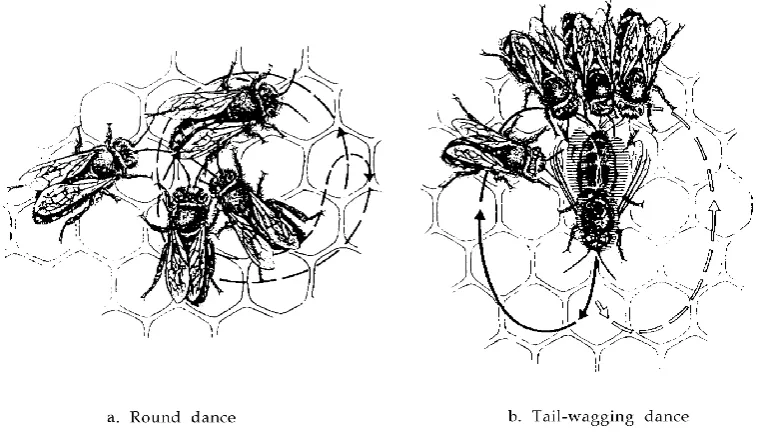
Some foraging bees act as scouts to find new sources of these resources. To pass on the information they use several dances the most well-known of which are the round dance and the waggle dance (figure 1.1). If the resources are near to the hive, some spilt honey for example, the scouting bees will rotate in ¾ inch circles stopping every so often to offer a sample of the resource to gathered bees. This dance is only used if the resource is within 50m of the hive and although it has been found to encode directional and distance information this information is not precise to encode directional and distance information this information is not precise (Griffin et al., 2012). If the resource is further away a waggle dance is used. This dance consists of a repetitive figure of 8 motion, the abdomen is ‘waggled’ rapidly as the bee walks the centre of the pattern. The vigour of the dance
7
[image:27.595.115.494.276.499.2]equal to the degree of deviation from the direction of the sun (Couvillon, 2012). For example if the bee walks directly up the face of the hive then the resource can be found directly towards the sun. If the bee walks down the hive then the resource is in the opposite direction and so on. The bees have polarised vision allowing them to accurately detect the direction of the sun even through cloud cover and near its zenith. It was Karl Von Frisch who first determined the meaning of the waggle and round dances (von Frisch, 1974). He even determined that the bees must have polarised vision capabilities long before this was proved physiologically (von Frisch, 1974). He was eventually rewarded with a joint Nobel Prize for his efforts.
Figure 1.1:
Figure taken from Karl von Frisch’s 1973 Nobel lecture showing the 2 forms of dance used by foraging bees to transmit information to other workers. From Nobel Lectures, Physiology or Medicine 1971-1980, Editor Jan Lindsten, World Scientific Publishing Co., Singapore, 1992
In addition to the waggle and round dances Seeley (1992) also identified a ‘Tremble dance’ in which a returning forager who is unable to pass her load onto another worker shakes her body back and forth, at the same time rotating her body axis by about 50-degrees every second or so, all the while walking slowly across the comb. This can last for 30 minutes and is thought to mean that the forager has found a rich food source but the colony already has enough supplies coming in to keep the workers busy.
Over winter the worker bees are subtly different from their summer sisters. The winter bees are produced in late autumn and unlike other workers their brood food glands remain active for their entire life. Whilst the summer workers may only live for about six weeks on
8 1.1.5 The Drones:
Finally the male drones; these are bigger and ‘dumpier’ than the workers, unable to sting, with very big eyes and long antennae used when searching for virgin queens to mate with. They have only a short proboscis and must be fed by workers (Waring, 2006). many researchers believe that they do little more than mate with the queens. In good weather, the males leave the colony and gather together to wait for passing queens to mate with. It does seem, however, that colonies without drones tend to fare worse than those with. It may be that only better faring colonies can produce drones or the drone may have some as yet unknown function within the hive. It has been suggested that they are important for temperature regulation (Kovac et al., 2009). However at the end of the summer when the colony is preparing to hibernate any remaining drones are evicted from the hive (Hooper, 2008).
1.1.6 Economic value:
The honeybee, Apis mellifera, is an ecologically and economically important species across the world. Products taken directly from managed bee colonies include honey, wax and propolis. Honey production in the UK was valued at £10 - 35 million annually (Burr, 2009). However, honeybees are most important as crop pollinators. The honeybee is a good pollinator because of its manageability and large forager populations (Benjamin and McCallum, 2008). In the UK a recent Defra report valued honeybee pollination at almost £200 million annually (Burr, 2009). In the USA honeybee pollination of crops such as almonds and oranges has been valued at over $14 billion per annum (Morse and Calderone, 2000) and worldwide the figure may be as much as $75 billion (~£50 billion) annually (Swinton et al., 2007). In fact, bee pollinated crops could contribute up to 35% of global food production (Klein et al., 2007).
1.2 Colony losses:
Recently there have been several reports suggesting that there has been a massive decline in honeybee numbers especially in the USA and parts of Europe including the UK (Neumann and Carreck, 2010; Potts et al., 2010b; vanEngelsdorp et al., 2011). A lot of media attention has been drawn to dramatic honeybee losses (eg, guardian:
9
(Hooper, 2008). However, occasionally large numbers of colonies die for apparently unknown reasons.
In the USA honeybee losses have been estimated at around 30% in recent years compared to previous losses of only 5-10% per year (vanEngelsdorp et al., 2008). A long term survey of US honeybee numbers carried out by NASS (National Agricultural Statistics Service ) (2008) shows that the trend in declining honeybee numbers is not a new thing as numbers have fallen by more than 50% over the past 50 years. In Europe, a recent paper by Potts et al., (2010b) concluded that honeybee numbers are also declining across much of Europe. Across central European regions, including the UK, honeybee numbers fell by approximately 25% between 1985 and 2005, and in all countries examined the number of beekeepers had also decreased.
The causes behind colony losses in the UK and elsewhere are currently unknown. Various studies have attributed the problem to viruses (especially Israeli Acute Paralysis Virus, IAPV), varroa mites, Nosema spp., pesticide use, GM crops, stress, decreased forage, lack of genetic diversity, pollution, climate change, weather… or a combination of several of these and other factors (eg Bromenshaenk et al., 2010; Cox-Foster et al., 2007; Giray et al., 2010; Guzman-Novoa et al., 2010; McFrederick et al., 2008; Oldroyd, 2007; Paxton, 2010; Potts et al., 2010a; Tarpy and Seeley, 2006). It now appears that there is no one cause behind these losses. In fact it is likely that several different factors act together making the problem multifactorial (Oldroyd, 2007). It is also likely that there are different problems in different regions. Varroa mites have been suggested as a cause for honeybee losses in Canada (Guzman-Novoa et al., 2010) but may not be such a problem in Africa (Fazier et al., 2010) and a questionnaire study of colonies in Turkey suggested that Turkish honeybee losses may be more closely related to region and weather than to disease level (Giray et al., 2010). This may be down to differing bee keeping practices, differences in climate and weather conditions, or many other reasons.
10 Figure 1.2:
The annual number of hives reported to the FAO in western European countries (the former 15 EU member states, black circles) and the former Warsaw Pact countries in Eastern Europe (including the former USSR, open circles). The dramatic decline in Europe coincides with the political system changes in the in Eastern Europe, whereas the introduction of V. destructor had no perceptible impact on the number of hives reported.
Other studies suggest that Nosema spp. (microsporidian gut pathogens), especially N. ceranae, may be linked to honeybee losses. A review by Paxton (2010) summarises much of the information gathered so far. There is research to suggest that N. ceranae can lead to the loss of a colony within 18 months of infection (Higes et al., 2008) it is also thought that N. ceranae may be more virulent than N. apis (Higes et al., 2007; Paxton et al., 2007), although a more recent study showed no discernible difference in virulence between the two species in caged bee studies (Forsgren and Fries, 2010).
The large metagenomic study by Cox-Foster et al. (2007) however showed that although all the colonies identified as having been killed by colony collapse disorder (CCD) studied in the investigation were found to be positive for N. ceranae, so too were many of the apparently healthy colonies (47%) studied. This suggests that although N. ceranae may be linked to CCD losses it is unlikely to be the sole cause.
11
recent UK study suggests that whilst the honeybee contribution to insect pollination is declining there has been no subsequent decline in crop yields. This is likely due to the contributions of wild insect pollinators (Breeze et al., 2011).
1.3 Honeybee pathogens and parasites:
Honeybees are hosts to many different pathogens including viruses, bacteria, fungi, protozoa and microsporidia as well as invertebrate parasites (Bailey and Ball, 1991). It is thought that one of the causes behind the honeybee declines seen in several countries, including the UK, may be pathogens (e.g. Cox-Foster et al., 2007; Oldroyd, 2007). This project focuses on the effect of the honeybee viruses common to the UK, the microsporidia Nosema spp. and the parasitic mite V. destructor.
1.3.1 Bacteria:
Several bacteria have been isolated from A. mellifera, usually from the digestive tract. Dying bees have been found infected with Pseudomonus apiseptica and other bacteria. However Bailey and Ball (1991) believe that bacteria act more as agents of septicaemia causing secondary, though potentially fatal infections after previous primary pathogenic or non-infectious disorders are acquired. The two most common and virulent bacteria that infect honeybees are American foul brood (AFB) caused by the rod-shaped Gram-positive species Paenibacillus larvae and European foul brood (EFB) caused by the lanceolate, Gram-positive bacterium Melissococcus pluton. Both EFB and AFB are ‘notifiable’ diseases. In the UK this means that if the disease is found in a colony the secretary of state (or more accurately the National Bee Unit acting on his/her behalf) must be informed. This is part of DEFRA’s bee health program that was designed to control and limit the spread of bee diseases (DEFRA, 2006).
If AFB is confirmed within a colony that colony, must be destroyed, the frames burnt and the rest of the equipment scorched or fumigated. EFB colonies can be kept but must be quarantined. If the infection is light no treatment is needed other than to reduce the area of brood nest then feed and strengthen the remaining colony. For heavier infections chemical treatments such as Terramycin are used (Tarpy and Keller, 2007).
1.3.2 Fungi:
12
(Giordani, 1952). The two most common fungal pathogens of honeybees only infect the larvae. Chalk brood, Ascophaera apis, kills larvae after capping and makes them appear white, fluffy and swollen at first before shrinking and becoming hard. By this stage workers may have removed the cell cap (Bailey and Ball, 1991). Infected combs can be treated with Thymol but cedar oil has been found to be more effective if also more expensive (Mourad et al., 2005). Stone brood, Aspergillus flavus or Aspergillus fumigatus, also affects larvae after capping, first they appear white and fluffy but later become hardened and either a pale brownish or greenish yellow. There are no treatments available for this disease but it does not usually affect strong healthy colonies (Bailey and Ball, 1991).
1.3.3 Protozoa:
Malpighamoeba mellifica is a protozoan of the order Sarcodina and infects the lumen of the malpighian tubules of adult A. mellifera. This causes atrophy of the Malpighian tubules but leaves no other sign of infection. To diagnose this disease requires dissection of the bee to reveal the presence of cysts (Bailey and Ball, 1991). It is unclear how serious infection by M. mellifica actually is. Heavily infected colonies may show no outward sign of infection and the specific effects of this pathogen are unclear, however it may be linked to shortened worker longevity and is possibly associated with Nosema spp. infection (Jordan, 1937).
1.3.4 Parasitic mites:
1.3.4.1 Tracheal mites (Acarapis woodi):
This parasite infests the tracheae of the first pair of spiracles of adult honeybees although they have also been found in air sacs in the head and abdomen (Prell, 1927). Injection of the dye congo red into the haemolymph of infested bees causes the mites to change colour indicating that they are likely to be feeding on haemolymph by piercing the tracheal wall (Orosi-Pal, 1934). There are no outward symptoms of parasitism and so dissection is required for diagnosis. Parasitised individuals do, however, have shortened life spans
although this does not significantly affect the colony as a whole unless the parasitism level is high. In Britain this occurs only very rarely. In fact, prevalence of this mite in Britain has been falling since records began. This may be due to climate change, treatment or the breeding of resistant strains of bees (Bailey and Ball, 1991).
13
infestation decreases. In Florida parasitism levels were recorded to drop between 5 and 90% during nectar flows (Taber, 1987).
There are other Acarapis species that infect A. mellifera including A. dorsalis in Britain. This mite is located in the v-shaped groove between the mesoscutum and mesoscutellum on the bee’s dorsal region (Morison, 1931). Tracheal mites can be treated with many chemicals including Apiguard and Apilife VAR (Tarpy and Keller, 2007).
1.3.4.2 Varroa destructor:
More than 40 species of mite have been associated with honeybees of which six parasitize A. mellifera. The most common in UK is Varroa destructor. Varroa destructor, hereafter called ‘the varroa mite’ or simply ‘varroa’, is a relatively recent parasite of A. mellifera having transferred from the Asian honeybee, Apis cerana, in the early 1960s probably in the
Primorsky region of the former USSR (Dejong et al., 1982). This is likely to have occurred due to mutual robbing and drift between the two bee species as well as the use of A. cerana brood to bolster Western honey bee hives. Varroa is therefore co-evolved with A.cerana but not with A. mellifera, and A. mellifera colonies can soon be overrun with mites. Varroa has been linked to reduced adult bee size, weight, flight frequency and life span (Kralj, 2004). Previous studies have suggested that some viruses may be transmitted by the mite (e.g. Bakonyi et al., 2002; Tentcheva et al., 2004a, see also 1.3.5) but a study by Santillan-Galicia et al. (2010) was the first to prove that both DWV and slow paralysis virus are transmitted by the mite and mite transmission appears to be more important than bee-to-bee
transmission.
The mite is also able to ‘activate’ viruses. Many bee viruses occur at inapparent
(symptomless) levels but varroa appears to trigger overt infections. For example Nazzi et al (2012) showed that varroa infestation transformed the usually inapparent virus DWV into a rapidly replicating and lethal infection. This may be due to some biochemical component of the mite’s saliva that may suppresshumoral, cellular or genetic immune responses of the individual bees (Bailey and Ball, 1991; Gregory et al., 2005). Yang and Cox-Foster (2005) examined the expression of several immune chemicals in A. mellifera infested with varroa both with and without deformed wings. Expression of the antimicrobial peptides
14
important in insect immunity (see 4.5); all of these were also found to be suppressed by varroa (Yang and Cox-Foster, 2005).
Many viruses are more effectively transmitted by injection than by ingestion by the bees and in nature those viruses vectored by varroa are transmitted through the mite’s feeding activity and thus effectively injected into the individual (Martin, 2001). Finally varroa
transmits viruses between the different life stages of the bees. This is especially important in the case of DWV where the characteristic deformed wings are only seen when infection occurs at the early (white eyed) stage of pupal development (Ribiere et al., 2008).
Zhang et al. (2010) examined gene expression in both Asian and European honeybees in response to varroa infestation to determine whether the varroa tolerant Asian honeybees showed different gene expression compared with the more susceptible European bees. Several genes were differentially up or down regulated in response to infestation. Some of these have been pinpointed as potentially linked to varroa mite tolerance; although more work needs to be carried out to confirm this. If these genes are indicators of varroa tolerance they may be useful in selectively breeding varroa tolerant bees.
However, it has been suggested by Fries et al. (2006) that if honeybees were left to adapt naturally to varroa infestation without the influence of applied miticides and other
treatments, then they may be able to develop natural tolerance to the parasites. Fries et al. (2006) studied an isolated island population of honeybee colonies (N=150) each infested initially with 36-89 varroa mites. Mortality increased over the first three years but then over the next three years, mortality decreased, as did varroa levels whilst more colonies began to swarm. A similar study in Louisiana, USA, showed that swarming rates and colony survival decreased in the first three years after the introduction of varroa to the area, but after this swarming rates and colony survival returned to normal (Villa et al., 2008). Similar results were also found in France (Le Conte et al., 2007). A study of the reproductive success of varroa mites in control colonies and colonies that had previously survived varroa infestations showed the average proportion of successfully reproducing varroa mites was significantly lower in surviving colonies compared to control colonies (Locke et al., 2012).
15
examined these colonies in 1995-6 and showed that they had lower mite populations than similar hives in Baton Rouge Louisiana, but could not say for certain that this was not because of other influences such as environment and bee keeping practices. Research is being carried out in the USDA Honey Bee Research Laboratory in Baton Rouge, Louisiana, into the use of Russian stocks to form varroa-tolerant colonies (Harris and Rinderer, 2004).
African honeybees have also been shown to be more hygienic than similar bees found in Europe (Fries and Raina, 2003), and it has been suggested that the bees showing greater hygienic behaviour may be more resistant to the varroa mites. However, a recent study by Çacmak (2010) showed that hygienic colonies of bees, as determined using a liquid nitrogen freeze killed brood assay, were no more likely to survive over winter in the presence of varroa infestations than non-hygienic colonies. This may mean that either this assay is not a good indicator of hygienic behaviour in relation to varroa removal, or it may simply suggest that hygienic bees are no more tolerant to varroa than non-hygienic bees.
Currently, control of varroa is achieved by chemicals (miticides or essential oils), drone trapping or powdered sugar application (Hooper, 2008). Mites are commonly seen crawling on bees and are present in nearly all colonies in the UK, although some island populations have remained varroa-free. Mites can be quantified within colonies by placing sticky varroa boards beneath the mesh floor of the colony and counting the number of mites that fall onto the boards within a week (varroa drop counts). Collecting a known number of adult bees into a container and covering them with icing sugar can induce grooming behaviour and may interfere with how the mites grip onto the bees (Fakhimzadeh, 2000), removing all the mites that can then be counted to provide an estimate of the number of mites living on the adult bees (phoretic mite counts) (Hooper, 2008; Waring, 2006). In Spring, if more than 2-3 mites per bee are detected by these counting methods, or if 40-80 mites are trapped within 24 hours on the sticky trap, then treatment is needed. In Autumn the threshold rises to 5-6 mites per bee or 100-150 mites trapped in 24 hours (FERA, 2010). There are several chemical treatments that can be used from Apiguard and essential oils that encourage mites to leave their hosts, or pesticides such as Apistan or Bayvarol. It is known that resistance to pesticides is widespread, however, so these should be used in rotation (FERA, 2010). Treatment is not recommended in late Spring or Summer during honey flow (Tarpy and Keller, 2007).
1.3.5 Viruses:
16
stranded RNA viruses, usually isometric (with the exception of Chronic bee paralysis virus, CBPV) and forming three separate size classes; 17, 30 and 35nm respectively. Whilst all viruses except filamentous and CBPV are indistinguishable microscopically they do possess differing buoyant densities in CsCl and have different capsid protein profiles (Ribiere et al., 2008). Each virus can also be distinguished using molecular techniques. In this project the viruses were identified using PCR (see chapter 2.6.1).
All the honey bee viruses described below are single stranded, positive sense viruses. This means that each is made up of a single strand of RNA within a protein capsid. The ‘positive sense’ refers to the fact that it can be read in the same direction as mRNA without need for transcription first. The positive sense RNA can be read as mRNA to produce the protein capsids needed for packaging new virions and to produce RNA dependent RNA polymerase. This enzyme is used to replicate new minus sense RNA from which new positive sense strands can be made thus allowing the virus to replicate (Madigan et al., 2006).
Most bee viruses in nature occur in ‘inapparent’ or ‘covert’ forms. This means that whilst the viruses are present within individuals in the colony there are no outward signs of infection. Covert infections are defined as conditions in which there are low levels of the virus which produces no clinical symptoms but the virus can re-emerge at a later date or be passed on vertically to subsequent generations. In contrast inapparent infections are short term, characterised by large levels of virus production and horizontal transmission but again with no obvious symptoms (Yue et al., 2007). Confusingly, ‘inapparent’ is often used to describe any infection where there are no outward symptoms irrespective of quantity of virus particles present or the transmission route (Ribiere et al., 2008). Virulence is thought to depend on the transmission route to which the virus is adapted. Vertical transmission requires increased longevity of the host compared to horizontal transmission and so vertically transmitted viruses are generally less virulent than horizontally transmitted ones. Thus covert viruses should be less virulent than inapparent ones (Yue et al., 2007). Several viruses may be present in a single colony or individual bee without any obvious signs.
There are six honeybee viruses commonly detected around the world which are routinely checked for in honeybee samples by the National Bee Unit (NBU): acute bee paralysis virus (ABPV), black queen cell virus (BQCV), chronic bee paralysis virus (CBPV), deformed wing virus (DWV), Kashmir bee virus (KBV) and sac brood virus (SBV). The NBU also routinely test for the presence of one additional virus, Israeli Acute Paralysis Virus (IAPV) which is a new virus and has not yet been detected in the UK (Bee Base: